Smart Money Trap Identified! FVG + Liquidity Grab“Smart Money Trap Identified! FVG + Liquidity Grab Before Super USD Skyrockets to Target Zone ”
⸻
🧠 Technical Breakdown:
1. Liquidity Sweep (Manipulation Phase):
We see price aggressively sweep local liquidity around July 23, likely triggering stop-losses of early longs or breakout traders. This is a classic Smart Money trap, where big players induce volatility to grab liquidity before a move in the real direction.
2. Fair Value Gap (FVG):
A clear bullish FVG (imbalance) has formed post-liquidity grab, suggesting a potential institutional entry zone. This imbalance typically acts as a magnet for price and an entry point for Smart Money after manipulation.
3. Demand Zone & Target Projection:
• Price is now reacting from a well-defined Demand Zone, with clear rejection wicks indicating aggressive buying interest.
• The target zone (0.88334882) sits just below a previous supply zone, aligning with a potential distribution area where Smart Money may begin profit-taking.
4. Supertrend Indicator:
The supertrend has flipped bullish, confirming potential momentum shift, supporting the bullish bias as long as the FVG holds.
5. Confluence Factors:
✅ Liquidity Grab
✅ FVG Reaction
✅ Demand Zone Bounce
✅ Supertrend Confirmation
✅ High-Risk/High-Reward Entry Before Smart Money Run
⸻
🎯 Trade Idea (For Educational Purpose Only):
• Entry: On pullback into the FVG zone
• Stop Loss: Below the recent swing low or Demand Zone
• Target: 0.8833 (inside the upper supply/demand imbalance)
⸻
🧠 Educational Note:
This chart beautifully showcases how market makers operate — manipulate liquidity, fill imbalances, and target inefficiencies. Always think like Smart Money, not retail traders.
Demandandsupplyzones

XRP/USD H1 Educational Market Analysis – Support-Based XRP/USD H1 Educational Market Analysis – Support-Based Long Opportunity
🔍 Structure Overview:
• Support Zone: $3.21 – $3.23
This level has acted as a strong liquidity pool and base for past bullish moves. Price has tapped into it, showing signs of potential demand returning.
• Resistance Zone: $3.65 – $3.70
Acts as a key supply zone, where previous bullish attempts failed. Targeting this area after a rebound is technically sound if structure confirms.
⸻
🔄 Price Action Insights (H1):
• Price broke down through EMAs (20/50/100/200), confirming short-term bearish pressure.
• A rejection wick from support hints at possible absorption of selling pressure.
• If price forms a higher low structure above $3.25 and reclaims EMAs, a potential bullish reversal may unfold.
⸻
🧠 Educational Note:
• H1 charts are ideal for intraday strategies, and this structure provides a clear example of:
• Support-resistance dynamics
• The use of EMAs as trend confirmation tools
• Reversal vs. continuation setups
⸻
🎯 Intraday Bullish Scenario:
• If price holds above $3.21 and breaks above the $3.40 (EMA cluster), bulls may push toward the $3.55290 target.
• This level aligns with the mid-range of the resistance zone, offering scalp-to-swing potential.
⸻
🚫 Bearish Risk:
• Failure to hold $3.21 could lead to a deeper correction toward $3.10 or even $3.00.
• Confirmation of bearish continuation would be a lower high rejection from EMAs without reclaiming them.
⸻
📌 Summary:
On the H1 chart, XRP is at a critical support. Watch for a clean bounce and break above EMAs for a move toward $3.55. However, losing $3.21 could attract further downside. Use price action confirmation before entries.

MARA supply and demand; swing tradeI'm looking at the weekly chart here, we have an interesting zone between 14.00$ and 14.68$. We've had decent amount of price action correlating to the areas going back to December of 2020. I set my trade idea with a stop loss at 12.95$ just in case of a liquidity flush , we're still getting at least a 3.5 to 1 ratio, with 2 other targets. This could take till May 2026 to conclude, would consider this a swing trade so could take months or more.

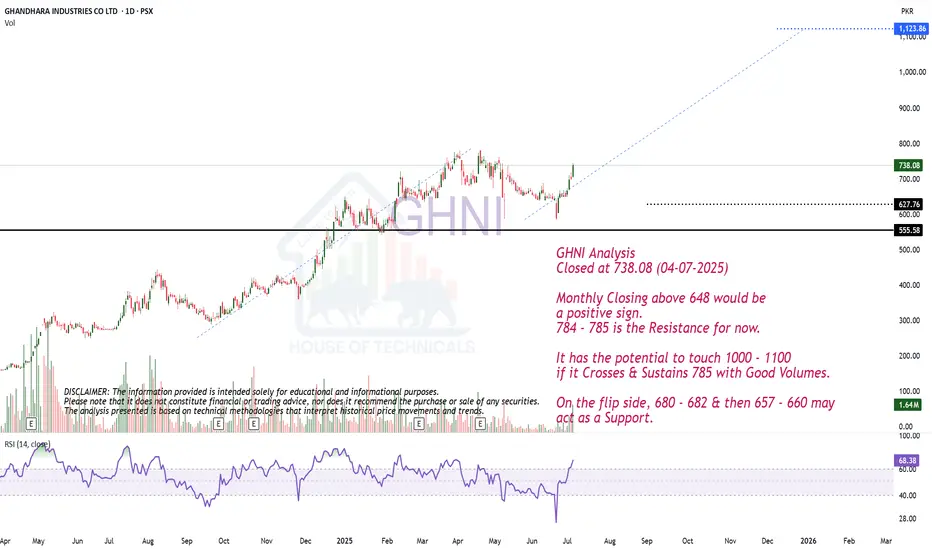
ABCD PatternGHNI Analysis
Closed at 738.08 (04-07-2025)
Monthly Closing above 648 would be
a positive sign.
784 - 785 is the Resistance for now.
It has the potential to touch 1000 - 1100
if it Crosses & Sustains 785 with Good Volumes.
On the flip side, 680 - 682 & then 657 - 660 may
act as a Support.
Profit taking on Netflix for the summer, only to buy in lowerNASDAQ:NFLX is still in a strong high time frame uptrend, I'm not saying the stock has turned bearish overall, however profits need to be taken when trading and this is one of those times.
I'd prefer to buy back in closer to $1,000 if possible though either way I'll keep 33% of my stack.

EURAUD (BOS + IMB + OTE)Hello traders!
Description: We have STB(Sell to Buy Action) - you can see it on 1H TF, which grab some liquidity and then made BOS. In this moment we can expect that price comeback to 0.5 and then i will look reversal on LFT, after closing IMB.
Entry: Confirmation on LTF in POI. Alarm on 0.5 Fib Level.
Target: HH
P.S: check also previous idea. We still have valid Demand on LTF.
Have a profitable day and don't forget to subscribe for more updates!
If you like this idea drop a like, leave a comment or write your pair, i will check.

EURNZD (BOS + DEMAND + 705 FIB LEVEL)Hello traders!
Description: Now we already in demand + check RSI)))
Entry: Confirmation on LTF in POI
Target: TILL problem zone.
P.S: check also previous idea.
Have a profitable day and don't forget to subscribe for more updates!
If you like this idea drop a like, leave a comment.

EURAUD (BOS 1H + DEMAND + OTE)Hello traders!
Description: Now we already in 0,5 of fib level, price want to close imb and mitigate demand + 705 OTE in case BOS 1H.
Entry: Confirmation on LTF in POI
Target: New HH
P.S: check also previous idea.
Have a profitable day and don't forget to subscribe for more updates!
If you like this idea drop a like, leave a comment.

Accumulation in BANKNIFTY? a rally to 60,000 in near future?Bank Nifty has completed its range of accumulation and is headed for a rally to approx. target of 60k (most likely in strength by this quarter).
The Index was in Spring pad at 13th March,
Broken the Stride at 18th March
24th March was entering into the accumulation zone again in strength,
this all started with a Preliminary Climax price texture on 4th June, followed by a buying climax on 27th June, then an automatic reaction largest to its other price texture which completed on 6th August
a Terminal shakeout from 6th Jan to 11th March, Volume is Increasing on Rallies and reducing on Reactions
A Potential Target of 60,000 is on Cards, won't be surprised if this happens in the coming 2 months too

#HEROMOTOCORP DEMAND ZONE A demand zone at 3395 indicates a potential area of buying pressure, where price may reverse or bounce upward. Traders can consider going long on price rejection at this zone, with a stop loss below 3395.

#CRUDEOIL SUPPLY ZONE A supply zone at 5923 indicates a potential area of selling pressure, where price may reverse or stall. Traders can consider shorting on price rejection at this zone, with a stop loss above 5923 (e.g., 5950) and a target at the next support level (e.g., 5750).

#TITANCOMPANY Demand ZoneTitan Company Limited, a leading Indian consumer goods company, is primarily known for its watches, jewelry, eyewear, and other lifestyle accessories. The concept of a "demand zone" for Titan Company can be analyzed across various dimensions, including market demand, product portfolio, distribution channels, and customer engagement strategies.

XRP BEFORE & AFTER@XRP Weekly-Monthly Analysis / Retracement...Weekly - Monthly trend: Bearish
Chart Pattern: Head & Shoulders (H&S) - Bearish Continuation Pattern
Bearish Candlesticks signals:
HANGING MAN (Bearish, Single Candlestick pattern) / Weekly Timeframe / 09 DEC 2024
BEARISH ENGULFING (Bearish, Double Candlestick pattern)/ weekly Timeframe / 27 JAN 2025
TWEEZER TOP (Bearish, Double Candlestick pattern) / 1 Day timeframe / 20 FEB 2025
FALLING THREE METHODS (Bearish, five-fold Candlestick pattern) / 1 Day timeframe / 07 MAR 2025
Retracement Fib Price Levels:
0.00% (3.4000)
23.60% (2.6879)
38.20% (2.2474)
50.00% (1.8914)
61.80% (1.5353)
78.60% (1.0284)
100.00% (0.3827)
Good prices for buy (the lower the better):
61.80% (1.5353) – Golden Zone / Golden Pocket
78.60% (1.0284) – Entry Zone
Between 78.60% (1.0284) and 100.00% (0.3827) is the Risk Zone, which we have the Neckline of the ‘’ Quadruple Bottom Pattern ‘’ at the price range ‘’ 0.6291 – 0.7850 ‘’
I am having buy limit at 0.78500 on the neckline of ‘’ Quadruple Bottom Pattern ‘’.

Crude Oil daily time frame - potential Ascending Channel Crude Oil Futures (CL1!) – Daily Chart Analysis (Feb 11, 2025)
📉 Market Structure:
Crude oil is trading within a broad ascending channel, with higher lows forming near $68 and resistance near $80-$82.
Price recently bounced from a key support zone around $70-$72, indicating demand in this area.
🔑 Key Levels to Watch:
Support: $70-$72 (previous resistance turned support)
Resistance: $78-$80 (previous strong rejection area)
Major Resistance: $82+ (upper trendline of the channel)
📊 Potential Scenarios:
Bullish Case: If price holds above $72, a continuation to $78-$80 is likely. Breaking $80 could lead to a test of the upper channel at $82-$85.
Bearish Case: A break below $70 could invalidate the bullish momentum, pushing price towards the lower trendline near $68-$66.
📌 Conclusion: Oil is in a consolidation phase, respecting key levels. Bulls need a breakout above $78-$80 for further upside, while bears would target a breakdown below $70. 🚀🔥

XAUUSD is like to have a pullback after the impulse move previously price boosted towards 2880 without retesting the resistance which is marked and the level is around 2830 -2820 as demand area
wait for the that zone retest and find a bullish condition or price action to aim back at 2880

DXY LOOKS TO HEAD DOWN LOWER FOLLOWING FOMC ON WEDNESDAYDXY is retesting the previous fractal low zone from the (Buy Before The Sell). The weekly golden retracement is still not reached (0.382 Weekly Retracement). Following the FOMC anything can occur including spikes and market confusion. Trade all major dollar pairs with careful understanding.

MNQ Trade 1/24/2025Bought in the green demand zone and sold in the red supply zone. Nicely executed trade!

SCB BUY Buy SCB
Price Stand Over Supply Zone Month.
Buy Price 118 THB
If price Close Under 118 THB Cut loss.

Textbook distribution setupFor the past couple months, it seems like bitcoin has made a typical head and shoulders top. If this plays out, we can see a sizable drop in the near future.

DOT LongPossible Long for Dot at the demand zone around 7.25-7.1. Take Profit Target at supply zone 7.9. Not a Financial Advice Please do your analysis

PZone PRO ( Zone Buy or Sell )**PZone PRO Explanation**
🔹 **Overview**:
PZone PRO is an innovative trading tool designed to enhance your trading precision and save time. Using patented technology, PZone PRO analyzes financial markets to identify Un-Filled Orders (UFOs) and map these areas on your chart. By leveraging these UFOs, traders can determine precise entry points, stop-loss levels, and targets, providing a strategic edge in trading decision-making.
The PZone PRO indicator helps identify Demand and Supply zones on the chart by marking specific patterns. It searches for patterns such as Drop-Base-Rally and Rally-Base-Rally to mark Demand zones, as well as Rally-Base-Drop and Drop-Base-Drop to mark Supply zones.
🔹 **Key Concepts**:
- **Identifying Key Price Areas**: PZone PRO detects price areas with pending buy or sell orders.
- **Dynamic Visualization**: UFOs are illustrated as green zones (for buying) or red zones (for selling), highlighting potential price reversal points.
- **Precision Advantage**: This tool supports all trading styles (long-term, medium-term, short-term) and is suitable for hedging strategies.
- **Time Flexibility**: PZone PRO can be applied to various timeframes, from seconds to monthly intervals.
- **Benefits for Options Traders**: It aids in determining the ideal strike price and zones for selling out-of-the-money options.
🔹 **Key Features**:
- **Automatic Zone Analysis**: Assists in identifying Supply/Demand zones with accuracy.
- **Timeframe Flexibility**: Usable across various timeframes.
- **Customizable Colors**: Fresh zones and retested zones can be assigned different colors.
- **Built-in EMAs**: Includes 5 EMAs – EMA 200, 100, 50, 20, and a daily EMA 9 (adjustable as needed).
🔹 **Final Note**:
Trading carries high risks, and past performance does not guarantee future results.
PZone PRO helps identify hidden market opportunities but should be used with a solid understanding and well-thought-out strategy.

BALAMINES: SUPPORT & RESISTANCE TRADINGBalaji Amines has been trading in a consolidating zone for an extended period, oscillating between well-defined support and resistance levels. This range-bound behavior reflects a lack of decisive directional movement, but also offers an excellent opportunity for range-based trading strategies.
Technical Analysis:
The stock has recently touched its support level for the 7th time, indicating a strong demand zone at this level.
The repeated testing of support without a significant breakdown strengthens the case for a potential bounce.
Key support: ₹ 1990-2000
Key resistance: ₹ 2441-2550
Trade Setup:
Entry: Near the support level around ₹1990-2000.
Target: ₹2441-2550, the upper boundary of the consolidation range.
Stop Loss: Below the support level, to minimize risk if the support fails.
Disclaimer: This analysis is for educational purposes only. Conduct thorough research or consult a financial advisor before making trading decisions.

Sonata Software Ltd. (NSE: SONATSOFTW)The daily chart of Sonata Software shows a notable consolidation phase after a strong uptrend earlier this year, which peaked around ₹837. The stock has been trading within a descending triangle pattern, a sign of ongoing consolidation with potential for a breakout in either direction. Here’s a closer look at key levels and technical indicators:
1.Fibonacci Retracement Levels:
The stock has retraced to key Fibonacci levels, finding temporary support near the 0.236 level around ₹563 and facing resistance near the 0.382 level around ₹615. These levels are crucial as the stock approaches a breakout or breakdown point.
2.Trendline Analysis:
Two converging trendlines form a descending triangle, indicating potential price compression. A breakout above the upper trendline or a breakdown below the lower trendline could signal the next trend direction. Traders should watch for a breakout above ₹615-₹620 or a breakdown below ₹563.
3.Volume and Momentum:
Volume has been gradually decreasing during this consolidation, which typically precedes a breakout. If there’s a spike in volume with a breakout, it could confirm the direction.
The RSI (Relative Strength Index) is around 47, showing neutral momentum but with room for movement in either direction. A rise above 50 could indicate bullish momentum.
3.Key Support and Resistance:
Support: Major support is around ₹563 (0.236 Fibonacci level) and ₹479 (100% retracement).
Resistance: Immediate resistance stands at ₹615, with stronger resistance around ₹658 (0.5 Fibonacci level) and ₹700.
Outlook:
Given the current pattern, Sonata Software is approaching a decisive moment. A breakout above ₹615-₹620 with strong volume could push the stock towards ₹658 and beyond. Conversely, a breakdown below ₹563 might lead to further downside.
Note: Keep an eye on broader market conditions as well, as they can influence breakout strength and follow-through.
