Housing Market Crash Incoming!Demand always rules supply. Always.
BLUF:
Short-term projection = TBD
Mid-term projection = bullish
Long-term projection = bearish to extremely bearish
Traders,
I have been quick to point out the tremendous amount of disinflationary data in my videos which leads CPI reports in some cases by as much as 6 months (i.e. -rent). Now, let's take a closer look at the NAHB's Housing Market Index data which helps us to better denote market sentiment.
First, observe that we have entered well below the weak demand zone. This is generally an area in which we can notice softening demand. Though the housing market may still remain hot in certain cities, others have noted softening demand.
Once we dive below this "Weakening Demand Zone", it can often represent the beginning of a housing market recession, or, in the case of the 2008 era, a crash! We began this crash with certain city markets plummeting through this weakening demand zone, Detroit comes to mind along with a few others. These were our lead cities to watch at the time. At the point in which weakness in these markets began to be acknowledged and reported, it was already too late. Michael Bury (aka - The Big Short) knew this. The crash had begun.
The markets did not react immediately, as we all know. In fact, the opposite: it would be a full 17 months before the stock markets reached their tops and then crashed hard. In a similar fashion, the Fed was notoriously tardy in recognizing lead disinflationary indicators and reducing rates accordingly. Not until a full year and two months AFTER the housing demand fell below its weakening zone would the Fed jump in and begin to diminish rates. By then it was too late.
Fast forward to 2022. Despite the fact that our U.S. housing demand has fallen far below the weakening demand zone and below the approximate median for a housing crash start, the Fed continues to raise rates at a historic record pace. These rate hikes will come home to roost eventually, but not immediately. This is why I am under the persuasion that we WILL enter a more disastrous recession or worse in 2023. The lag effect of the Fed rate hikes will have a significant consequential impact. Just as in our past housing market crash story the impact will be significantly delayed and by the time they are noticeably felt, it will be far too late. Disinflationary data, low demand, low consumer sentiment, etc., will have hit us harder far in advance and the Fed will have realized they should have pivoted sooner.
Though my longer-term outlook appears rather dismal at the onset, my mid-term outlook may be rather surprising to many. I do believe that just as occurred before the 2007-2008 market crash, the preceding price action will become bullish. It took the market a full 17 months to recognize the significance of our housing data, and the fed wasn't much better. Will it be any better this time around? It might be, but as we can learn from history, the market collective and the fed are often irrational and reactionary. The case for my blowoff top past the previous year's November highs still stands. The market will begin to recognize and digest more and more disinflationary data not least of which is housing market demand. The Fed will begin to be pressured more and more to pivot. And whether due to pressure or reason, I believe they will pause or pivot soon. Then the meltup (aka blowoff top) will begin. And sometime mid to late 2023, it all ends. Secular bull market (since 2009) exited. Secular bear market entered.
Be ready my friends!
And pray that I am wrong!
Stew
Demandandsupplyzones

EUR/USD - Caught a beautiful trade this morning/Possible 1/10 RRMarket approached my POI this morning and gave a beautiful weak to strong hand transfer. Literally a 1 PIP drawdown on the entry. Waiting to see if it will reach TP by today. ;D

COMP LEVELS TO WATCH COMP KEY LEVELS TO WATCH FOR REACTION, either a break to the upside to take the sell liquidity or a push down to the demand zone

SHORT TERM BUYGold is clearly on a downward trend since we broke structure 2 weeks ago. Price has however reached a fresh demand zone where we took a buy order. This will act as a retracement area to around 1685 area, where we'll take some longer term sells after confirmation. For long positions, wait for price to break 1646.38 with momentum, then enter using retest or Return to Orderblock.
All the best

USDCHF Short From M15 OrderblockHello everyone!
The pair has swiped all the liquidity and then dropped making a CHOCH. Now it has filled the imbalance left after this move and touched the Fibo level + OB.
I expect it now to swipe the liquidity down bellow and fill some immbalnce left.
Entry: 0.9858
SL: 0.9875
TP: 0.9757

LONGPrice has clearly broken market structure on the weekly to sell structure. It's however approaching a weekly Orderblock around 1833 area where we're likely to see some retracement. To enter long positions at the OB, ensure you identify clear BMS on 1 hour or more lower timeframe for short term buys to 1792 area.
All the best

LONGGJ is on a clear downtrend after breaking the monthly and weekly structure. Price is currently on critical demand zone where we're expecting to see some retracement. To enter long positions, wait for clear break of market structure in 1 hour timeframe. However, It will not be a surprise to see price drop to 154.24 and 151.95 before retracement.
All the best

GOLD Potential Upsideshello traders
We have a strong bullish wave in the price chart and the bearish wave is somewhat correcting. It is possible that we will get a bullish wave similar to the first one, but the liquidity will be seized first.

SPY - Short term bullish - Quick TradeHello Friends,
AMEX:SPY has shed a lot of value in a week but there seems to be some good news if you're looking for a very short term bullish trade. We will have to understand supply/demand levels on multiple time frames.
In a daily TF, Price opened gap down, approached a daily/weekly demand zone and closed within top 33.3% of a candle range(Bullish Pin bar candlestick). Bullish pin bar with a good volume suggests the presence of demand. There's a gap to be filled. So our first target is at the upper bound of a gap around 373.44. I like to use anchored VWAP as a dynamic support/resistance and also as an additional confirmation for the target. In a downtrend, I drop anchored VWAP from a recent swing high to find dynamic resistance level which is currently at 386. There's a visible supply zone between 381 and 390. So if price is able to breach our first target then the next safe target would be at 381. Target levels are marked on the chart below.
Zooming into 45 minutes TF, it is visible that before price opened gap down, there was a supply zone forming. Our first target is actually a lower bound of a supply zone. Additionally, a bullish RSI divergence is also visible which is an additional confirmation for price reversal.
Similar confirmations are found in 15 minutes TF as well.
Remember, Overall market is still bearish so you have to be very nimble while trading against the trend. A good trader always find opportunity in any market conditions!
Do you agree with my analysis? Please let me know your thoughts by commenting below and follow me for more such ideas. Happy and safe trading! :)

What's next for USDCAD ?Friends what do u think where will Price move in Upcoming week ? Trade safely my Friends and let me know your views on this in comments.

ChoCHAUDCHF Next possible move wait for the price to return its original Demand for Safe entry after conformation.
Trade safely my Friends and let me know your views on this in comments.

Brent oil - Price Action Analysis Due to Ukraine-Russian war, CAPITALCOM:OIL_BRENT price was sharply accelerated But from Jun 2022 , price was making lower lows after unable to close the high and defeated.
So how far it can go, for that we need to understand price action in higher time frame.
Weekly TF (higher Timeframe) :
After Pandemic deep , Price clearly making higher- highs and also bounced from taking support of dynamic trend line. At the end of the week , Price may get support from the same dynamic line but still we didn't get confirmation whether it will continue the trend or it is a reversal?
That visibility is available in daily TF.
Daily TF :
After knowing from the higher TF (Weekly), we get a initial idea how's the price was reacted from dynamic trend line and also it is making falling wedge with structure of LH -LL.
There are two possibility we can get over here :
1. Either this bounced from the trend line will sustains and price will break this wedge structure and makes Higher - highs. (P -1)
2. Price will again reject from the mention levels and following the trend. (P -2)
In Conclusion , My observation still at the down side because there is no clear direction of structure breakout or change in price-action that supports any bullish price action.
Buyers can wait till price comes at demand zone or you can follow the price action.
Sellers can get opportunity when price reject from above mention levels and clear confirmation in terms of the volume and momentum.
If you have a different opinion, please share your thoughts in the comment section. If you like my ideas, please show some appreciation with a like and follow me for more such trade ideas. Happy and safe trading! :)

YEN DROPPED but worried about BOJSome news on the wire
source :(bloomberg)
Yen Falls After Hawkish Fed, Awaits BOJ Decision: Inside Japan
By Chikako Mogi
(Bloomberg) -- Yen falls after the Federal Reserve raised rates and provided a more hawkish outlook for its future rate path. Government bonds are likely to follow Treasuries higher ahead of the Bank of Japan’s decision.
USD/JPY up 0.2% at 144.31 after rising as much as 0.7% to 144.70 Wednesday
Short-term bullish flag forming and sets up for a breach of 145
USD is strengthening after hawkish FOMC and if BOJ stands pat, USD/JPY may rise toward upper 144 levels, says Yuta Suzuki, vice president at MUFG Bank in New York
If BOJ’s Kuroda changes his tone over the weak yen or suggests that the weak yen may impact monetary policy, USD/JPY could drop by 1 yen
Dot plot suggests Fed is determined to keep policy rate above 4% next year regardless of economic conditions
While intervention wariness remains, traders may need to raise their buying levels from around 140 if probability of monetary policy action from Japan is low
daily chart
4h
overall BULLISH

GBPJPY - StructureGBPJPY on the 1hourly chart at structure; any plans you have, traders?
Initially, it was the entry point to a Bearish Bat, but it is invalid now. Can anyone of you tell me why that is so?

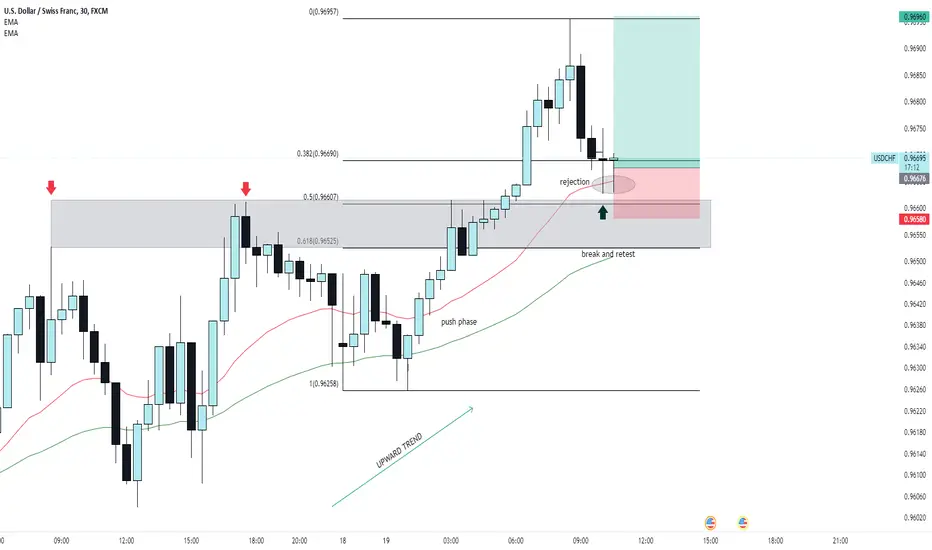
USD/CHF UPWARD TRENDThe US dollar continues to rise, the upward trend on the USD/CHF pair breaks the previous resistance of 0.9660 and retests the area, the rejection from the area means the continuation of the rise
Chfjpy Short positions Looking to take short positions upon the recently formed supply which confluence with the inner h1 supply...The market is still looking for liquidity,we can tell because price unturned prematurely.

BTC / USDT ( SHORT) hello traders
I have confirmation that sellers will enter. I think it is the right time to sell Bitcoin

US 100 LONG hello traders
There is a demand area that is overtaken by the price. The price is expected to rise above the area to execute unexecuted buy orders
There is an important support and resistance area
Accumulation occurs above the support and resistance level and below the consumed demand area
If the price breaks the consuming demand zone, I think it will be a buying opportunity to target supply zones

NZDUSD NEXT MOVEConsidering that the price reaches the demand area, we expect it to react after reaching our target area.

GBPUSD NEXT MOVEConsidering that the price reaches the demand area, we expect it to react after reaching our target area.

NASDAQ PRICE IS GOING TO DROPPrice is going to crap some liquidity while closing the imbalances for sufficient price distribution and providing a chance for buyers to close their loss cheaper and sell their buys.

GBPUSD-Weekly Market Analysis-Sep22,Wk2Aggressive Counter-Trend Traders, you might have an opportunity to engage GBPUSD on a buying opportunity.
Why is that an aggressive move?
That's because there is no structure or support looking left.
At the minimum, wait for a 3-bar reversal before engaging in the trade. Your first potential profit taking level will be at 1.1576.

DEMAND SUPPLY STRATEGY As we can see price is making correction and creating a Pull back, just wait for Price to react our zone for Short swing.
Trade safely my Friends and let me know your views on this in Comments.
