GBP/USD – Bearish Structure with Possible Short-Term Pullback📊 GBP/USD – Bearish Structure with Possible Short-Term Pullback
Timeframe: 30-Minute | Date: July 29, 2025
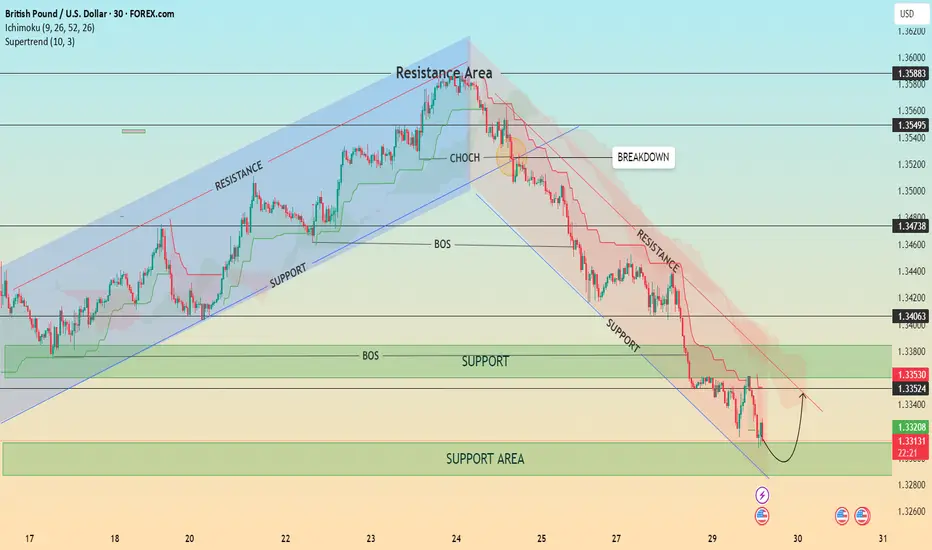
Price action recently broke down from a well-respected ascending channel, confirming a shift in market structure with a Change of Character (CHOCH) followed by a Break of Structure (BOS). Since then, GBP/USD has been respecting a descending trend channel, forming consistent lower highs and lower lows.
🔍 Current Setup:
Price is testing a major support area around 1.3300–1.3320.
A minor pullback is expected as indicated by the bullish wick rejections.
However, the overall bias remains bearish unless we break and hold above the 1.3353–1.3406 resistance zone and the descending trendline.
The Ichimoku Cloud and Supertrend both show bearish momentum.
📈 Potential Scenario:
Price may bounce from the support area and retest the upper boundary of the descending channel before resuming the bearish trend.
⚠️ Key Levels to Watch:
Resistance: 1.33530 / 1.34063 / 1.34738
Support: 1.33200 / 1.33000
💡 Structure Notes:
CHOCH = Trend Reversal Signal
BOS = Confirmation of Downtrend
Cloud = Dynamic Resistance
Demand Zone
EUR/USD 30-MIN ANALYSISThis EURUSD setup showcases a clean bullish continuation scenario following a confirmed Break of Structure (BOS) and a sharp rally driven by momentum and liquidity imbalance.
After sweeping a key low (XXX), price impulsively broke structure to the upside, confirming a potential shift in market intent. A retracement is now expected to mitigate the Buy-Side Imbalance (BISI) zone.
BOS & SSS (Short-Term Structural Shift): Confirmed bullish intent.
Imbalance (BISI): Price left behind an unfilled imbalance zone a likely magnet for a pullback.
Re-Entry Zone: (BISI) provides a high probability area for long re-entry.
Upside Targets:
Target 1: 1.15483 – intermediate structural level.
Target 2: 1.16158 – premium supply / liquidity target.
#EURUSD 30M Technical Analysis Expected Move.

NAS100 Supply and Demand Case StudyIt was a classic bullish week. If you have any questions lmk in the comments.

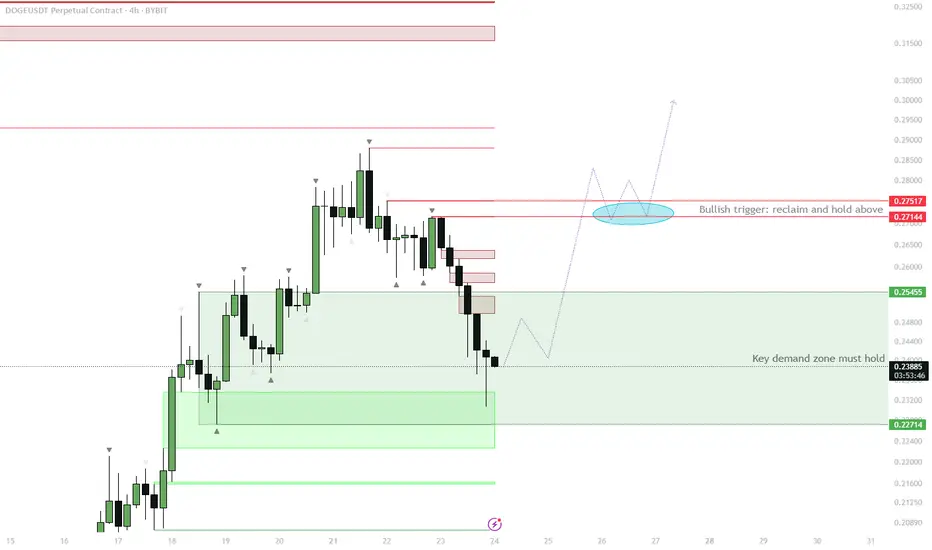
DOGE H4 – Demand Zone Reclaim as Bullish Trigger
Price is currently testing the H4 demand zone (~0.227–0.254).
Watch for price to reclaim the demand zone and close back above 0.254.
If confirmed, expect a move up toward the red resistance cluster at 0.271–0.275.
Consolidation above this area (highlighted in blue) would be a strong signal for continuation.
Invalidation: clean breakdown and acceptance below 0.227 signals failure of demand and deeper retrace.
This setup aims to capitalize on a classic liquidity sweep and demand reclaim. Typically, after taking out the flat open and collecting late shorts/stop losses, strong buying often steps in if demand is genuine. A successful reclaim and consolidation above the previous resistance will set the stage for bullish continuation. If this zone fails to hold, the move is invalidated and lower targets come into play. Waiting for confirmation reduces the risk of a failed bounce.
US100 Index – Potential Bearish Reversal in Key Resistance Zone🧠 US100 Index – Potential Bearish Reversal in Key Resistance Zone
Timeframe: 30-Minute | Chart Published: July 24, 2025
---
🔍 Overview
The US100 (NASDAQ) has been trading in a well-structured ascending channel, forming higher highs and higher lows. However, recent price action suggests that the index is testing a critical supply zone near 23,400, with signs of weakening bullish momentum. This may signal a potential corrective phase or bearish reversal.
---
📈 Technical Analysis Breakdown
🔵 Trend Structure:
Price is respecting a clear ascending trendline (blue), connecting multiple higher lows.
Multiple bullish flag/channel formations have been completed within the uptrend, showing healthy momentum until the current point.
🟥 Resistance Zone:
Strong supply zone marked between 23,250 – 23,450.
Price action shows stalling candles and rejection wicks within this zone, indicating buyer exhaustion.
⚠ Bearish Patterns:
The red path projection suggests a head and shoulders-like structure forming at the top of the channel.
This, along with divergence in wave strength and shrinking momentum, supports a potential reversal.
🔵 Key Support:
First support lies around 23,000 — aligning with the ascending trendline and previous consolidation.
If broken, next demand zone is around 22,835 – 22,900, where historical consolidation took place.
---
🔁 Projected Scenario (as per visual path)
1. Price may attempt one last push into the 23,400–23,450 zone (possible false breakout).
2. Rejection from this level could trigger a fall toward the ascending trendline support.
3. A confirmed break of the trendline can lead to a larger correction toward the 22,800 zone.
---
🧠 Unique Insight
This chart combines multi-timeframe structure recognition with a real-time reversal formation inside a long-standing bullish trend. The analysis doesn’t just rely on textbook patterns—it recognizes real-time price behavior shifts, which makes it valuable for proactive traders.
---
📌 Conclusion
While the trend remains bullish overall, caution is warranted as the US100 approaches a historically significant resistance zone. The setup offers a compelling risk-reward short opportunity for aggressive traders, especially if the price confirms a break below trendline support.
---
🔧 Next Steps for Viewers
> “Watch for a clean rejection candle or lower high at resistance before entering short. If trendline breaks cleanly, 22,835 could be the next target zone.”

Gold Market Update – Key Zones for the Next MoveHey gold lovers! As the NY session wraps up, the chart is a painting of tension: gold boxed tight between major structure — and the real action is only about to start.
Bias:
At this stage, gold remains in a short-term bullish structure as long as price holds above the 3421–3428 decision area. A break and hold below this zone would shift the bias to neutral or bearish for the next sessions.
🎨 What’s drawn on the chart?
🟥 3472–3478 Supply Zone:
The ceiling, still untouched — this is where every failed breakout has left a “scar” on the chart. If we finally reach this zone, watch for wicks, rejections, or that rare, clean breakout candle. Sellers and patient bulls are both watching for “the drawing” to be complete.
🟩 3383–3390 Demand Zone:
The real floor. On your chart, it’s the base built by strong bounces and those long wicks buyers left behind. If price falls here, it’s not just a line: it’s a zone where new rallies are born and the market might “paint” a major reversal.
🟦 The Middle is Just Noise
Price is coiling, painting confusion in the center — but the edge zones are where structure and opportunity live.
Don’t be the trader who gets erased in the chop. Let price draw the story at supply or demand before making your move.
💡 Plan for Tonight
Wait for price to reach 🟥 supply or 🟩 demand.
Watch the “drawing” — will you see a wick, a rejection, or a true breakout?
Only trade once the story is clear at the edges.
Drop your best chart art or scenario below!
like🚀🚀🚀and 🔔 Follow for real structure updates & daily market stories — let’s turn trading into a masterpiece, together.
GoldFxMinds

Gold (XAUUSD) – 17 July Analysis | Demand Zone in Play🟢 Gold (XAUUSD) – 17 July Analysis | Demand Zone in Play
Gold continues to follow the bullish structure we’ve been tracking in our recent posts. Yesterday's news-driven price action pushed the market to a new swing high near 3377.600 , confirming strength in higher timeframes. Now, price is currently in a retracement/pullback phase , pulling back toward a key intraday demand zone at 3326–3320 — offering potential opportunity for the next leg upward.
🔍 Where Are We Now?
The market is currently pulling back toward a key M15 demand zone: 3326–3320 . This level also aligns with a higher timeframe order block on the H4, making it a critical confluence area for structure-based traders.
This 3326–3320 zone is crucial because:
→ It’s a fresh M15 demand zone inside a higher timeframe bullish structure
→ It aligns with the H4 OB that previously acted as a launchpad
→ The overall trend remains bullish unless this zone is decisively broken
If the zone holds and we get LTF confirmation (such as M1 internal structure shift + micro-BoS), it may present a high-probability long setup.
⚙️ Structure Summary:
✅ H4: Bullish continuation structure with recent higher high
✅ M15: Pullback within bullish order flow
✅ M1 (for entry): Awaiting ChoCH + BoS as entry trigger inside POI
📌 Trade Setup Plan (upon confirmation):
→ Entry: From 3326–3320 demand zone
→ Stop Loss: 40 pips below entry
→ Take Profit: 120 pips (targeting new HH based on H4 projection)
→ Risk-to-Reward Ratio: 1:3
🧠 Key Trading Insight:
We never predict — we prepare .
We don’t chase price — we position with confirmation .
Discipline means waiting for price to invite us in , not entering just because a level looks attractive.
📈 Summary & Expectations:
➡️ Price is retracing into a structurally significant demand zone
➡️ Market bias remains bullish unless this zone fails
➡️ If the zone holds with valid M1 confirmation, we’ll consider a long setup targeting a new high
➡️ No confirmation = no trade. Patience > prediction.
📘 Shared by @ChartIsMirror
This analysis is part of our ongoing structure-based approach to trading Gold. All entries are derived from pure price action, multi-timeframe structure alignment, and trader discipline — as taught in our book:
“The Chart Is the Mirror: Mastering Gold with Structure, Stillness, and Price Action”

XRP: Ripple Ready to Unleash a Tsunami?Ripple (XRP) is coiling like a spring—ready to explode. After five clean re-tests of a powerful demand zone, buyers have repeatedly stepped in to defend key levels, launching 40–75% swings each time. Is this the moment it unleashes the wave?
🔍 Technical Breakdown:
✅ Demand Zone Strength
XRP is bouncing from a long-tested demand zone (5+ re-tests). Each bounce led to substantial upside momentum.
✅ Bull Flag Retest
XRP previously broke out of a large bull flag and has been holding the flag’s top trendline for over 40 days—acting as strong support.
✅ Higher Low Structure
Price formed a higher low (H/L) and has climbed steadily for two weeks—building bullish structure.
✅ Volume Profile
Price reclaimed ground above the high-volume node, signaling accumulation strength.
✅ Market Cipher B Divergence
A weekly hidden bullish divergence is present—not massive, but notable—hinting at momentum shift.
⚠️ What to Watch:
Volume is key: Current consolidation shows a decline in volume—a surge could ignite the breakout.
Confirmation for conservative traders: Wait for a break and hold above $2.33 with volume, or a retest of that level.
If past demand zone reactions repeat, a breakout could be imminent.
What do you think?
📈 As always—this is not financial advice. Do your own research.
🧭 Happy Hunting!

Gold buying levels Hello everyone today Monday 7 july gold
Support 3330 level the price support this level if you plan for gold buy wait confirmation candle like bullish engulfing etc tp - 3343 sl - 3325 try at least 1:2 trade 1% risk overall captial

#XAU/USD SELL TRADE SETUP [SHORT]In this analysis we're focusing on 2H timeframe. As we know, Gold is moving in a strong bearish trend. The best selling zone is 3295 - 3305 key levels area. If gold encounters rejection from this zone, we can anticipate a potential decline in price towards its targeted levels.
Target 1:3260
Target 2:3250
Target 3:3240
Wait for a retracement to sell with strong confirmation and proper risk management.
#GOLD 2H Technical Analysis Expected Move.

SOL — Liquidity Sweep & Demand Play1. Wait for price to sweep into demand
2. Enter long on SFP or strong bounce
3. Target: 240+
4. Stop: below demand zone
If no sweep, stay flat or wait for clear reclaim

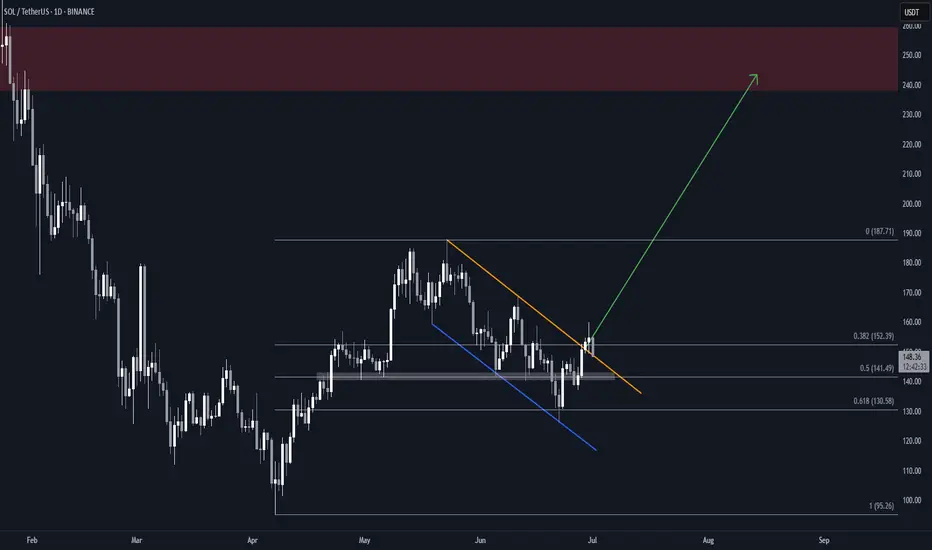
Solana (SOL) Flag & Pole Breakout (1D)BINANCE:SOLUSDT broke out of a textbook falling wedge two days ago, and is now retesting the former resistance as support.
Key Technicals
• Falling channel with clean structure and multiple touches
• Resistance trendline broken
• Price now retesting the breakout zone (~$148)
• Overhead supply zone at $238–$260
• Measured Target: $240, within supply
Why This Setup Matters
• Clear breakout followed by a retest, which can often precede the next leg up if support holds
• Falling channel retracement aligns with 0.618 Fib, a common reversal area
What to Watch
• Daily close above the previous resistance trendline
• Push above the local $160 high for full confirmation
Gold (XAUUSD) – July 1 Analysis📍 H4 Key LH Zone: 3348.500 – 3350.500
This is a major decision zone.
Current market structure:
🔸 M15 is in an uptrend with confirmed ChoCh + BoS
What to watch:
We’re approaching the H4 LH supply zone — now we observe how price behaves here.
🔹 If price breaks above this H4 LH zone:
→ HTF and LTF trends align to the upside
→ Potential continuation of the bullish move
🔹 If price respects and stays below this LH zone:
→ Then this recent up-move could be a pullback
→ We may see a new low forming — so be cautious
📍 M15 Zones for Long Setup (if confirmed):
• 3309.500 – 3312.500 (Order Block Zone)
• 3302.500 – 3304.600 (Demand Zone)
We will watch these levels closely.
If price respects these zones and gives M1 confirmation (ChoCh + BoS) — we’ll plan for long entries accordingly.
📖 Let structure guide your decisions. Let price speak first.
📘 Shared by @ChartIsMirror
Author of The Chart Is The Mirror — a structure-first, mindset-grounded book for traders

Positioning Buy idea on Sugar (SB1!)Based on :
- Cot at extremes potential reversal
- Seasonality and quantitative analysis
- 2 Demand zones

US30 looking for the short on Bearish PAI believe we can expect a pull back down to JuBias: Short-term Bearish (Contingent Setup)
Context: Price is currently trading just below a high-probability supply zone between 44,048 – 44,277. This area aligns with prior highs and liquidity, making it a prime zone to look for a short-term rejection if strong bearish price action (PA) appears on the 4H or Daily timeframes.
We are currently seeing strong bullish momentum on the Weekly, Daily, and H4 candles. Any short positions from this zone must be reactive — not anticipatory. A clear bearish signal (e.g., engulfing, structure break, supply confirmation) is required to consider entry.
Key Zone:
Seek bearish PA between 44,048 – 44,277
Contingency: If price breaks and closes above 44,250 (2024 highs), expect continuation toward 45,000
Short Targets if Rejection Occurs:
Target 1: 43,350
Target 2: 42,500
Extended Target: 41,734 (June Low)
Post-Rejection Bullish Scenario:
If we do get a rejection and targets are met, we will then look for bullish PA in the demand zones (42,500 or 41,700) to consider long setups back toward the 2024 highs and potentially beyond.
Breakout Scenario:
If price breaks and closes above the 44,277 zone early this week, we anticipate the next leg to 45,000 before any meaningful reversal.
At this stage, it’s a waiting game — let price action lead. We don’t predict, we react.ne lows before an

Eur/Jpy breaks the previous🔍 Key Observations:
Supply Zone (169.713):
Price is approaching a marked supply zone, where sellers previously stepped in with strong momentum. This zone could act as a resistance area, potentially rejecting price downward.
Previous Low Break:
The structure shows that price broke below a previous low, indicating bearish pressure and a possible shift in market sentiment.
Demand Zone Below (~168.700):
There's a strong demand zone marked below the current price, which may serve as a target for short sellers or an area for bullish entries if reached.
Projected Move (Orange Arrows):
The orange path suggests a potential move:
Price may first retest the supply zone around 169.713.
A rejection from that level could trigger a downward move, breaking recent support levels.
The price may bounce slightly midway before continuing the drop toward the demand zone.
RSI Indicator (Relative Strength Index):
Currently at 54.80 (blue line), the RSI is nearing overbought territory but not yet extreme. This leaves room for a bit more upside before a potential reversal, aligning with the idea of testing the supply zone first.

GOLD 30M ANALYSIS (LONG)In this analysis we're focusing on 30Min time frame. If we look in this 30Min chart, we have supply area and demand area. And we have also a minor resistance level. Now what I'm looking for that price move impulsively upside after sweeping all SSL. I'm expecting that price will come back and retest (3310 - 3305) area at least. So keep an eye on these level, confirmation is key.
Second Condition:
If price break above 3332 and close above 3332 with strong momentum than we will plan a buy trade on retracement.
Always use stoploss for your trade.
Always use proper money management and proper risk to reward ratio.
#XAUUSD 30M Technical Analysis Expected Move.

XAUUSD Bullish OutlookThis chart captures a highly strategic bullish setup on XAUUSD, rooted in Smart Money Concepts (SMC) and institutional trading principles. The market has performed a major liquidity sweep, dipping below previous lows to collect resting sell-side liquidity before reacting sharply from a key demand zone.
Why Bullish? The Confluences:
Liquidity Sweep:
Price manipulated below a significant structural low to trap late sellers and activate institutional orders. This move into deeper liquidity suggests the smart money is building long positions.
Extreme P.O.I. + Demand Zone:
The blue zone marks a high probability reversal area where demand outweighs supply. This zone is validated by historical reactions and refined to align with an Order Block (OB) a clear footprint of institutional accumulation.
Bullish Structure Anticipation:
After the reaction, price is expected to form a series of higher highs and higher lows, confirming bullish market structure. Multiple resistance levels are in sight, each one representing an objective for price to reach in its journey upward.
Entry Point: $3,343 – $3,330
Located inside the OB and demand zone, this is where price is likely to build a base for upward continuation.
Stop Loss: Below $3,324
TP1: $3,363 (first internal structure break)
TP2: $3,375 (mid range target)
TP3: $3,383 (structural high retest)
TP Final: $3,405 (liquidity target above EQH)
Remember confirmation is key before execution.
#GOLD 2H Technical Analysis Expected Move.

US30 - Intraday long scalp then short Looking for that intraday scalp on the long around 120 points can hold potentially further up to our higher supply level. If bearish PA is confirmed around the 43,000 level can look to take this short. All dependent on PA.

EURUSD M15 Forecast - Check related IdeaAs explained in previous post we are expecting a pull back down to our order block (H4) then a bullish reversal to retest last weeks highs (1.16) region. If price breaks and closes above the M15 supply zone will have to re-evaluate and potentially take a long position from a retest into a FVG.

HYPE/USDT Technical Analysis (4H Chart)🔍 HYPE/USDT Technical Analysis (4H Chart)
High Time Frame (Daily): Bullish
Despite recent pullbacks, the overall trend remains bullish on the daily timeframe. However, current price action suggests a potential fakeout or legitimate breakdown, as we test key structural and volume-based supports.
Short-Term Time Frame (4H): Bearish
The 4-hour chart displays clear bearish pressure, confirmed by the Three Black Crows candlestick pattern. This signals sustained selling interest and supports the current downward move.
🧱 Key Zones
Supply Zone: $41.7 – $45.9
Strong resistance marked by prior selling pressure and overlapping FVGs.
Demand Zone: $24.4 – $26.3
Historical area of buying support, aligned with a low-volume node and an unfilled FVG.
📏 Fair Value Gaps (FVGs)
Above Price:
Four 4H FVGs act as upside inefficiencies, offering targets in a bullish recovery:
~$34.9
~$36.6
~$37.8
~$40.0 (psychological level & POC cluster)
Below Price:
One major 4H FVG remains unfilled, directly above the demand zone.
📐 Fibonacci Analysis
Price is testing the Golden Pocket (0.618–0.65) from the recent swing low to high.
A clean break below this area (with confirmation) targets the unfilled FVG around $30, and potentially the demand zone ($24.4–$26.3).
📉 Volume Profile Insight
Volume is clustered around $34–$37, indicating strong past market participation.
Very low volume between $29–$30, creating a volume void — if price loses support at the FVG and golden pocket, it could rapidly drop into the demand zone.
🔻 OBV Analysis (Volume Momentum)
OBV has broken below a larger rising wedge, confirming bearish divergence.
A falling wedge is now forming within OBV.
Break below this wedge: Confirms further price breakdown.
Reclaim of the larger wedge trendline: Suggests potential bullish reversal.
✅ Trade Scenarios
🔺 Bullish Scenario
Trigger: Bullish reversal pattern at the golden pocket (e.g., double bottom, falling wedge, inverse H&S) + OBV recovery.
Entry: Upon confirmation around $32.5.
Targets:
$34.9 (FVG)
$36.6 (FVG)
$37.8 (FVG)
$40.0 (psychological)
Stop: Below $30 or recent swing low (tight below FVG).
🔻 Bearish Scenario
Trigger : Confirmed breakdown of golden pocket & 4H FVG with OBV falling wedge breakdown.
Entry : Below $32.5 with confirmation (e.g., retest or strong momentum candle).
Targets:
$30.0 (psychological level)
$28.5 (FVG zone)
$26.3 → $24.4 (Demand zone)
Stop : Above golden pocket resistance (~$33.8–$34.2).
📝 Conclusion: The market is at a pivotal point. A confirmed break below $32.5 could accelerate selling due to the volume gap, while a strong bullish reaction from the golden pocket could drive a recovery toward $40. Always wait for confirmation before entering either scenario.

ES - LONG @ London OpenBuyers from 6000 options level, floor. We've got weak liq. above to squeeze. After London open FIND on smaller timeframes the auction/finished business (risk) and test of pivot/poc (entry)

