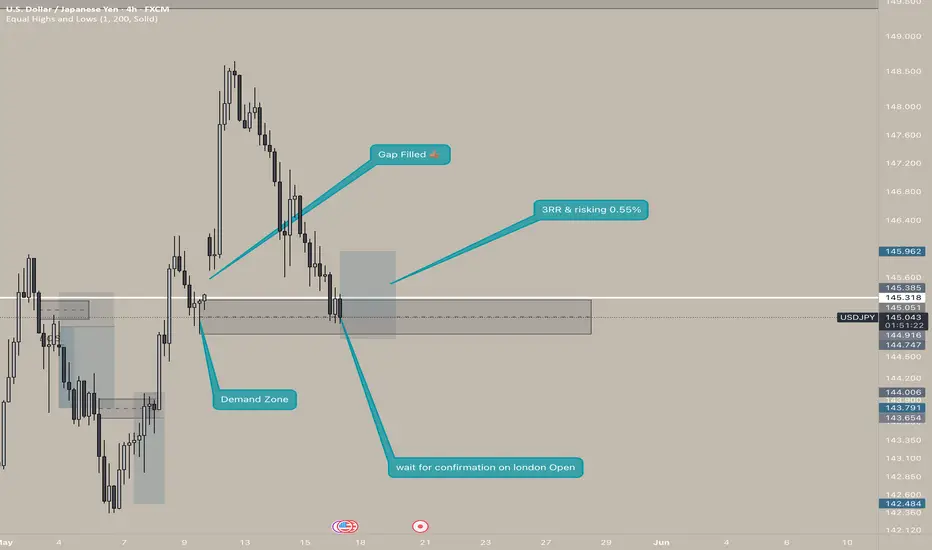
Demand Zone
Convex Finance (CVX) Rectangle (1W)BINANCE:CVXUSDT has been trading in a rectangle with well-defined boundaries since January 2023, and it has recently reclaimed the 1-year EMA, potentially shifting the bias to bullish.
Key Levels to Watch
• $1.5-$2.0: Main demand zone and invalidation point for any bullish TA if broken
• $3.0: 1-year EMA, successfully reclaimed and retested as support
• $4.4: Rectangle midline, previously relevant as a S/R
• $6.1-$7.2: Main supply zone and upper boundary of the rectangle
• $13.0: Previous swing high and rectangle breakout target, which would be confirmed by a weekly close above $7.2 with good volume

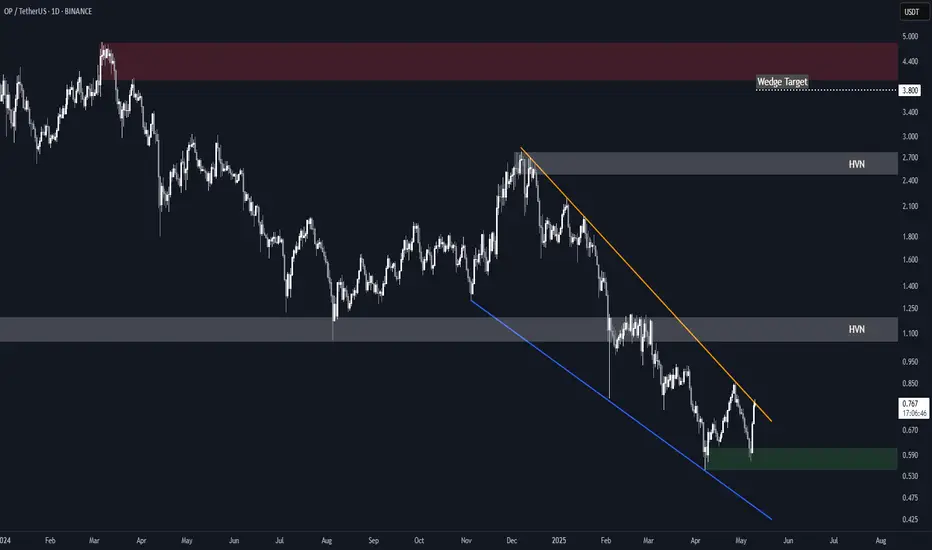
Optimism (OP) Falling WedgeBINANCE:OPUSDT is attempting a breakout from a 14 months long falling wedge.
A sustained break above the resistance in the near term would set the target at $3.80, just shy of the main $4.00-$4.80 supply zone.
Key Levels to Watch
• $0.55-$0.60: Main demand zone and invalidation point for the setup
• $1.00-$1.20: High Volume Node and key S/R dating back to June 2023.*
• $2.50-$2.80: High Volume Node and wedge high point.*
• $4.00-$4.80: Main supply zone.
* These could offer resistance and represent good levels for partial TPs.
#NEAR/USDT#NEAR
The price is moving within a descending channel on the 1-hour frame, adhering well to it, and is heading for a strong breakout and retest.
We are experiencing a rebound from the lower boundary of the descending channel, which is support at 2.90.
We are experiencing a downtrend on the RSI indicator, which is about to break and retest, supporting the upward trend.
We are looking for stability above the 100 Moving Average.
Entry price: 2.94
First target: 3.03
Second target: 3.14
Third target: 3.30

Axie (AXS) Structure Analysis (1W - Log)After retesting the ~$2.0 demand zone, BINANCE:AXSUSDT broke out of its recent downtrend and could be headed for an attempt to reclaim the ~$4.0 S/R.
Key Levels to Watch
• ~$2.0: Demand zone dating back to May 2021, and current support. Any sustained break below it would invalidate any bullish TA.
• ~$4.0: Previous multi-year key support, and likely a strong resistance. Reclaiming it would flip the bias to bullish. It also aligns with the 200-day EMA, which has been very relevant for AXS in the past.
• ~$13.0: Multi-year S/R, and a reasonable target if ~$4.0 is reclaimed.
Still in a No-Trade Zone for me, until ~$4.0 is successfully reclaimed.


$GRAB Long Term Trade IdeaTaxi and delivery service stocks all look bullish at the moment. Lyft and Grab are both a couple of my favorite longer term swing trade/investment plays just based off risk/reward and how beaten down both the stocks are.
If shown patience this trade could work wonders. I like it a lot because it gets me a little exposure to assets outside the U.S. and from a chart perspective its hard not to love a setup like this.
1. The buy side volume shown here is the highest its ever been for the stock by a long shot.
2. Price has been in a descending wedge type formation for several months now and is attempting to make a breakout, though this month's candle still has a lot of time left.
3. That hammer candle, especially considering it being printed on the 1M timeframe, is incredibly bullish in my eyes.
This chart reminds me a lot of NYSE:BABA but a bit earlier in its breakout stages. To me it is clear that accumulation has been taking place for over 2 years now and a big markup is upon us.
I have 3 take profit areas marked based off a few different Fibonacci levels I like that also have confluence with supply/demand dynamics present on the chart.
multiple daily/weekly candles below $4 could be a a good stop loss area as that would invalidate a lot of the bullish structure. Based off the current price this provides you with a minimum 2.75x RR trade and a maximum of 7x RR.
My average price is $4.25. Any pullbacks below $4.50 I will be looking at as great buying opportunities.
Will do my best to update this idea periodically over the next year or so.

CVX demand zone!OptionsMastery:
🔉Sound on!🔉
📣Make sure to watch fullscreen!📣
Thank you as always for watching my videos. I hope that you learned something very educational! Please feel free to like, share, and comment on this post. Remember only risk what you are willing to lose. Trading is very risky but it can change your life!

Looking long for ENPH a possible leap! OptionsMastery:
🔉Sound on!🔉
📣Make sure to watch fullscreen!📣
Thank you as always for watching my videos. I hope that you learned something very educational! Please feel free to like, share, and comment on this post. Remember only risk what you are willing to lose. Trading is very risky but it can change your life!

AAPL – Long Trade Setup (Support-Based Reversal Opportunity)Apple (AAPL) is pulling back toward a key support zone between $197–$198, aligning with both previous structural support and potential demand zone behavior. This setup offers a favorable risk-to-reward profile for a swing long entry.
🔹 Entry Zone:
$197 – $198
🎯 Take Profit Targets:
🥇 $210 – $215
🥈 $225 – $233
🛑 Stop Loss:
Just below $190

Double bottom and Demand on RIOT! OptionsMastery:
🔉Sound on!🔉
📣Make sure to watch fullscreen!📣
Thank you as always for watching my videos. I hope that you learned something very educational! Please feel free to like, share, and comment on this post. Remember only risk what you are willing to lose. Trading is very risky but it can change your life!

Sitting in Demand for PEP! OptionsMastery:
🔉Sound on!🔉
📣Make sure to watch fullscreen!📣
Thank you as always for watching my videos. I hope that you learned something very educational! Please feel free to like, share, and comment on this post. Remember only risk what you are willing to lose. Trading is very risky but it can change your life!

Stromm | GOLD Bullish Continuation in PlayIt’s good to see Gold OANDA:XAUUSD getting the attention it deserves again. But honestly, the performance it’s putting in right now is just insane.
If you zoom into the 4-hour chart, you’ll spot a clear Demand Continuation Pattern:
Rally → Base → Rally.
In simple terms: strong move up, sideways consolidation, strong move up again.
The first rally pushed Gold up 9.77% within a few days, followed by a sideways base, and then another 9.6% rally straight into the $3,500 mark.
With commodities like Gold, you really feel how powerful psychological levels are — $3,000, $3,500, $4,000 — all massive magnet zones where large investors naturally look to take profits.
Now, after tagging $3,500, we’ve pulled back.
If this Demand Continuation structure holds, here's how I see it playing out:
Inside the current base, there’s a 4-hour order block, and it’s the one I’m watching most closely.
Ideally, we get a push up into the 4h Balance Price Range between $3,336–$3,347, followed by a rejection that sweeps the Previous Weekly Low, tagging that 4h order block for a proper retest.
From there, a move toward the 8h Balance Price Range would be good.
Now, two possibilities:
Best case for bears: After retesting that 4h zone, we fall further — possibly targeting $3,050.
Sneaky scenario: We fake a drop to trigger stop-losses, push back up toward $3,510, then properly roll over.
On the monthly chart, it gets even more interesting:
Given the massive rejection off $3,500, I wouldn’t rule out a much deeper retracement toward $2,500–$2,000 before Gold makes another serious attempt at $4,000.
That would perfectly fit into a larger Elliott Wave structure, completing a Wave 3 or setting up a Wave 5 push later.
(And yes — catching a Wave 3 top is brutal — especially when it is an all-time high)
Unless geopolitical events massively change the landscape, it feels like $3,500 is a strong local top — for now.
But if the world starts burning again?
Gold might have other plans.

Potential buying opportunity on UNH!OptionsMastery:
🔉Sound on!🔉
📣Make sure to watch fullscreen!📣
Thank you as always for watching my videos. I hope that you learned something very educational! Please feel free to like, share, and comment on this post. Remember only risk what you are willing to lose. Trading is very risky but it can change your life!

Leap for AMD to the upside?OptionsMastery:
🔉Sound on!🔉
📣Make sure to watch fullscreen!📣
Thank you as always for watching my videos. I hope that you learned something very educational! Please feel free to like, share, and comment on this post. Remember only risk what you are willing to lose. Trading is very risky but it can change your life!

AAL in a massive Weekly Demand! OptionsMastery:
🔉Sound on!🔉
📣Make sure to watch fullscreen!📣
Thank you as always for watching my videos. I hope that you learned something very educational! Please feel free to like, share, and comment on this post. Remember only risk what you are willing to lose. Trading is very risky but it can change your life!

DXY (Dollar index) Shorts from 1hr supply zone My general outlook on the DXY this week leans bearish, as I expect price to continue trending lower. I’ve identified a nearby 1H supply zone, where we could see price react and begin pushing lower. There is also a larger supply zone further above, but it’s currently out of reach unless price pulls back significantly.
Looking back, the 2-day demand zone I marked over a week ago has played out well, with a strong bullish reaction from that level — price is still rising from that zone. During this move, a new 11H demand zone has formed, which also led to a change of character to the upside. If price revisits that zone, we may see another bullish continuation from there.
Key Points:
Overall bearish trend expected to continue in the short term.
1H supply zone nearby is a potential trigger point for a sell-off.
2D demand zone previously marked is still holding and influencing price.
11H demand zone has caused a bullish shift and could provide another long opportunity if price returns.
P.S. This is my general DXY outlook for the week. I don’t trade the dollar directly, but I use it as a key confluence when analysing and executing trades across other major pairs.

EUR/USD Short term longs to a supplyThis week, I’ll be watching to see how much downside momentum remains after price reacted from my 8H supply zone. Just below the current price action, there’s a clean 3H demand zone I’m expecting price to mitigate — which could spark a bullish reaction or a short-term bounce.
My next supply zones are further above on the 2H and 5H timeframes, so I’ll be waiting to see whether we get another break of structure from this move, which could create a new, tradable supply zone. Ideally, I’ll wait for a Wyckoff schematic to develop at one of these key POIs before committing to a trade.
Confluences for EUR/USD Buys (Short-Term):
- Multiple liquidity points to the upside that price may seek to take out.
- A clean, unmitigated 3H demand zone just below the current level.
- The DXY is still showing weakness, aligning with bullish short-term EU moves.
- This could be a counter-trend opportunity before a larger sell-off resumes.
P.S. While my bias leans more towards selling from higher up, I’ll be open to counter-trend longs if the lower POIs hold. Just remember to keep your risk management tight and only take trades with clear confluence and confirmation.

XAUUSD Potential for a drop in 15min chart!Hey Guys,
To keep this analysis short and being able to publish it fast, I've considered a good potential zone for sell and price reaches to this area.
So based on this analysis we can consider a drop soon.
This post will be updated based on recent market movements.
Good luck! :)

Monthly Demand on NKE!OptionsMastery:
🔉Sound on!🔉
📣Make sure to watch fullscreen!📣
Thank you as always for watching my videos. I hope that you learned something very educational! Please feel free to like, share, and comment on this post. Remember only risk what you are willing to lose. Trading is very risky but it can change your life!

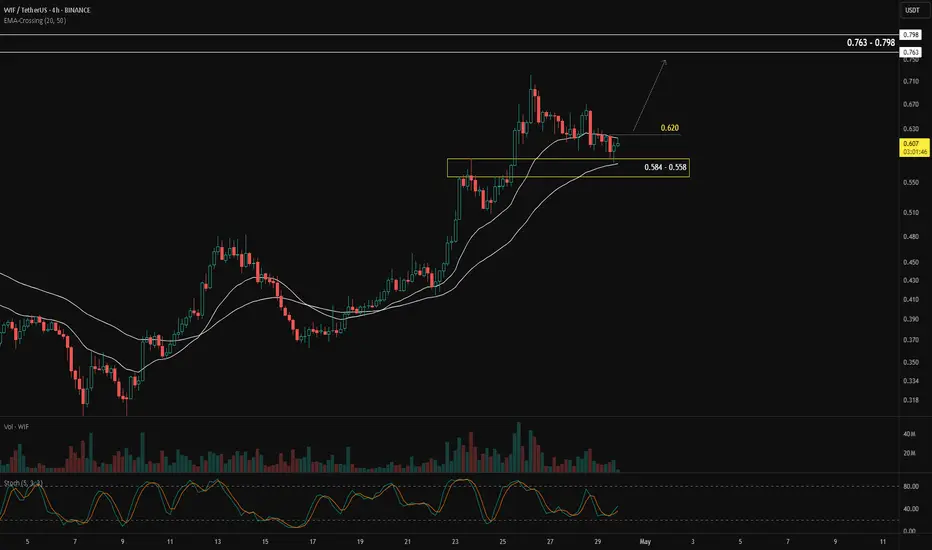
When Moving Averages Meet the Demand ZoneOne of the simplest ways to identify the market trend is by using the moving average (MA) indicator.
When price moves above the MA, it's generally considered an uptrend.
When price moves below the MA, it's seen as a downtrend.
Aside from showing the trend, moving averages can also act as dynamic support and resistance:
In an uptrend, the MA acts as support — meaning if price retraces into the MA, it often bounces back and continues upward.
In a downtrend, the MA acts as resistance — price tends to reject the MA and move lower.
In BINANCE:WIFUSDT , the moving average is currently acting as support, and price is pulling back into a confluence zone between 0.584 – 0.558, where the MA meets a demand zone. This setup increases the probability of the pullback ending and the uptrend continuing.
The confirmation for a bullish continuation would be a break and close above 0.620.
If that happens, the next target zone is between 0.763 – 0.789.
Keep a close eye when price approaches the previous high. The ideal scenario is a strong impulsive breakout. The worst-case scenario would be a rejection or false breakout from that level.
Alright, what's your take on BINANCE:WIFUSDT ?

Buy idea on Crude Oil (CL1!)Based on :
- US10Y Leading long spike
- Commercials and Non Commercials at Extremes
- Open Interest at Extremes
- Cycles and quantitative data
- Undervalued conditions
-Demand zone
