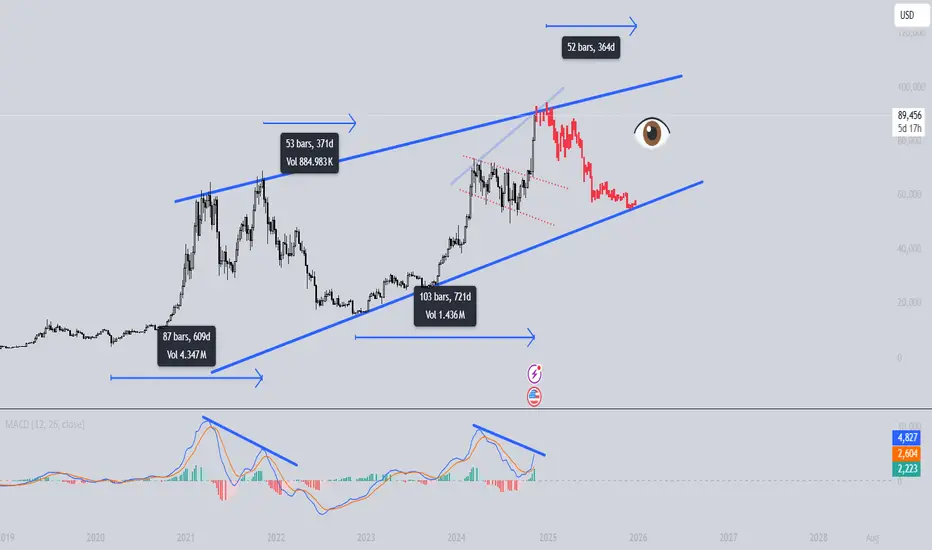
BITCOIN 2025 - THE LAST HOPECRYPTOCAP:BTC currently finds itself at the intersection of geopolitical tensions and broader macroeconomic uncertainty. Although traditionally viewed as a hedge against systemic risk, it is presently exhibiting characteristics more aligned with high-risk assets. The FED's forthcoming policy decisions will likely play a pivotal role in determining whether Bitcoin stabilizes or experiences further downward pressure.
The chart represents the most optimistic scenario for Bitcoin to date
Depression

had a dream market went down 80%...an anecdotal visual representation of what that might look like. we may enter another depression, but its weather dependent. entering a 90 year drought cycle aka gleissburg cycle. hopefully i'm wrong.

MARKETS NOT OVERSOLD CAUTION! UPDATE!This is a monthly chart and TV keeps forcing "Target reached" on my updates. As such i am reposting this chart I first issued back on April 1st, 2025, before our "LIBERATION DAY" FACEPALM!
We are still not oversold on a monthly chart!
WARNING!
Click Boost, follow, subscribe!

USOIL CAUTION! BREAK - TEST - GO!This is my new updated chart of Oil.
Trump's "Drill baby Drill" interfering with the free market is the absolute worst thing he could do. His ridiculous tariffs will put us in an economic depression!
Oil prices are driven by demand! As I have mentioned here on TV so many times before! Increasing supply while heading into a recession is the dumbest thing possible! You never want to consume your own oil when you can consume others first! Simultaneously, F your own nation's oil company's profit margins and gov tax revenue!
This is why we shouldn't put toddlers as POTUS!
Anyway!!! This is a break test go! setup!
If you haven't seen it before, here is an example I recently posted with AAPL.
Click Boost, follow, subscribe! Let's get to 5,000 followers so I can help them navigate these crazy markets too. ))

MAGS SUPER STRUCTURE FORMING CAUTION!We have MEGA superstructures forming everywhere. H&S Eiffel Towers, etc.. None will be more devastating to 401ks and people's portfolios than the MAGS breaking down from this mammoth structure.
Last chance to GTFO forming.
CAUTION is in order!
Click Boost, Follow, Subscribe. Let's get to 5,000 followers ))

AAPL About to CRACK!Without Question, AAPL is the best company in the world and the most valuable. However, it means little in this economic landscape.
AAPL is about to start cracking here. I usually do not post them ahead like this, but in this situation, I will break my own rules.
Take your money and RUN!!!
WARNING!! GTFO!

SPY CRACK! WARNING!We are in the "honey" phase in Stocks.
This is the part where they tell you:
-Don't panic
-Stocks are cheap forward EPS
-Nible on the way down
-Diversified portfolio wins..
-It's a stock picker's market
-There is a lot of cash on the sidelines
-It's just a reset
-It's a correction
-We needed this to shake out the weak hands
-Buy when there is blood in the streets, even if it's yours
-There is a lot of value in...
-This is your last chance to...
-This and that stock are going to $1,000
-Stocks are the best investment over the course of time
The list is endless to get you to buy or stay in and suck up the pain. They will "Future Fuke" you the world.
I will remind you that you cannot buy unless you first sell! No one has endless money, and your 1% addition monthly will not lower your cost basis.
All I can tell you is what this chart shows! A BIG CRACK!
WARNING!!!
Click like, follow, subscribe, and let me help you navigate these crazy markets.

"When the VIX is low, look out below!""When the VIX is low, look out below!"
+
FEDs motto "Higher for longer"
=
Fed rate hikes to go: 2-3 left
it is pivot time, change of market dynamic from "bad news is good news" to "bad news is bad news".
state of economy is not good and it will start sinking in to investors and public

DXY 1W Forecast until March 2025Consolidation below 106 will last until October 2024.
Breakout will happen in October peaking at 111-112 followed by a retest (mid November 2024 - January 2025).
Further upward movement + correction will happen in January-March 2025 between the top of 113-114 and the bottom of 105-ish.
Consecutive HH and HL will be followed by rapid increase in pace of changes: time will shrink and levels will expand.
This will mark the start of hard times of Greatest Depression in March 2025 sending all markets down and making USD the king.

2025 BITCOIN CRASH ?I saw the BTC chart it has been up for 700++ days from a low ($16K), or this will be a sign of an great economic crash in 2025 (winter 2024 or 2025).
89K - 95K will be the new ATH
The U.S. Markets are likely to have one last push before....The U.S. markets have been inflated to the point of near exhaustion, propped up by nothing more than a money printer that goes brrr... brrrr... brrrrrrrrrrr. However, this seemingly never-ending run is coming to an end.
Trump will most likely be elected president again. His first term (45) and his second term (47) will likely mark the greatest market crash of all time—the end of the everything bubble! 4 + 5 = 9; 4 + 7 = 11; 9 + 11 = 20. They will likely prop the market up until his administration takes power, then...
Shorting these markets will be the opportunity of a lifetime!
Good luck, and always use a stop loss!

Mortgage Delinquencies About to Skyrocket"Financial Advisors" tend to be clueless about the overall health of the market and the economy.
The "advisor" profession is laced with toxic narratives about "your goals" and "focusing on the long term" and "staying invested". They're clueless as to what is going on.
As the recession sets in and the market collapses, we will see mortgage delinquencies soar.
Remain patient, refrain from buying ANYTHING with a debt component (ie homes / cars). We will soon see a credit freeze, as banks and lenders dump their assets and borrowers fail to meet their loan covenants.
This is the real deal, folks.
Stay low and move fast!

Oil Collapse | WTICOUSD About to Give it Up!I called the oil top in June 2022 and I have been building / holding a massive leveraged short position ever since then.
This market will take YEARS to recover, after the current selloff is complete. I will continue to cover the devastation, along the way.
Don't listen to the media - they are lost.
Question your "advisors" - they are going to encourage you to "stay invested", it's what they do.
Ultimately, the decision to ride out this market will cost you dearly.
If you are able, GET OUT OF THE MARKETS.
There is nowhere to hide!

S&P 500 ($SPY) COLLAPSE | Recession Alert!!Behold, devastation just up ahead.
$2500 is probable in the S&P.
Retirements are about to be wiped out. As a friendly reminder, the "401K is free money" narrative is going to evaporate.
The media will soon be out in full force talking about:
"stay the course"
"remember your goals"
"stay invested"
"LFG"
"buy the dip"
So foolish.
If you are trapped in a retirement fund (401K), the best thing you can do right now is get defensive. Sell ALL "growth stocks" and shift all of your wealth into cash and / or bonds.
Be careful out there, everyone! Something major is happening on a global scale!

NASDAQ Collapse Underway | SHORT $QQQConsistent with my entire market thesis, I am looking for the NASDAQ to selloff back to the 2018 price level, with the additional likelihood that we will test the Covid bottom from 2020.
If you own NASDAQ:QQQ , I advise an immediate sell; if you are looking to increase profit, you can short the Nasdaq.
Folks, we are in a recession and the market-makers are not playing around.
This will go deep.

Bitcoin Collapse Underway -75% ProbableBitcoin is collapsing, it will go deep.
As of right now, I am looking for AT LEAST a -75% selloff, with the expectation that we will soon test the 2018 price level.
This thing might be wiped out entirely.
I really don't have much else to say.
Good luck everyone.

DJI Collapse Imminent | Caution All AssetsThis is how we hold the finance sector accountable.
Caution in all assets.
The world economy is grinding to a stand-still.
This selloff will be deep and obviously very painful.
There are a ton of hype stories and narratives out there - I have covered and poked fun at many of the ridiculous narratives in previous posts.
We knew this day would come.

The Unlikely But Possible Has Occurred!Yeah, it's bad. But is it really as bad as everyone thinks it will get? I don't think so. I'm going to explain why I think this is just a brief discount window before a bigger pump through the year-end.

Industrial Production, and how it can help us time larger cyclesIn this video I use Industrial Production, and more specifically, its Rate Of Change to show how we can approximate Booms and Busts in the "Business Cycle".
I also go over previous cycles, and what to look for in our current cycle.
As always, good luck, have fun, and practice solid risk management.

Does this scare anyone, or nah?Has this rally been the "complacency" rally? Jim Cramer recently tweeted how much BILLIONARES should be kicking themselves for not being part of this monster rally. Is this just a giant lower high/bull trap and are we already rolling over into the Great Depression 2.0 or ughem, a Great Rest?

City Lodge Symmetrical Triangle getting closer to the breakoutWhich way?
Symmetrical Triangles are generally known as Continuation patterns. This means, when the price breaks out it normally moves in the trend of the prior direction...
However, the trend has been sideways before this. It's been in the Twilight Zone for over a year.
And it gets worse.
When the price oscillates up and down in between the 200MA - You know it's in complete indecision.
Many lessons to learn from this chart and this market. Many technical analysis tips you can add to your acumen and arsenal.
And as City Lodge is in the Hospitality sector, things haven't gone up since Covid... The prices have become more expensive. The seasonal pricing are vastly different and most people just don't have the money like they used to.
It's what I call the slight depression. The rich are getting ridiculously richer and the poor are struggling to even afford Lotto tickets.
And this will get worse and worse. It's time to think above and beyond the system and mentality of the sheeple. And break away.
So there is not much we can do with CLH other than wait for a break up.
But if it breaks down, we can only watch it fall further.
My two targets are in place and my humility is intact because I have NO idea which direction it wants to break.

USCCI - Consumer Confidence Index - Recession is HereThe US Consumer Confidence Index (USCCI) does not look so good.
Consumers (normal people) are feeling anxious about their future, and they have good reasons for that.
The Bull Market did not last long after the Covid Pandemic and people don't feel optimistic about their future spending or wealth.
If you don't know what the CCI is, no worries, I will briefly explain, so that a 12 year old will know.
A very well-known university in Michigan started doing some surveys a long time ago.
They were asking people how they feel about their future, about their spending confidence, etc.
Basically, you can also ask yourself:
Can you afford a new car now?
Are you making more money now then you were 2 years ago?
Do you have financial stability? How do you feel about that?
Are you thinking of moving into a new, nicer home?
For me it's a NO for most questions above.
Not sure about you...
Now, if I may continue, I will tell you this: people are scared.
In fact, Covid shocked the world as we know it.
We got used to being bullied by the higher, running forces in the world.
Anyway, there are many factors for which Consumers are pessimistic at these times:
- War & Tensions: Ukraine vs. Russia
- Inflation Spike
- Energy Crisis
- Federal Reserve (FED) Interest Rate Hike
- Surging Prices
- Bear Market Fears
- Recession Talks
Remember this: WINTER IS COMING!
No joke, many will suffer.
The media plays a major role with inflicting sentiments in your mind.
As for me, I'm more of a technical guy, so I go with what my technical analysis tells me.
Until now I mentioned my personal fundamental analysis take.
I'm not optimistic about the markets.
The FED messed it all up. They overreacted with that Quantitative Easing (QE).
Artificial (fake & printed) money was injected, and of course it lost its value.
Because of that, Inflation skyrocketed, and of course they're surprised.
NO! It's the oldest trick in the book. They are controlling the global economy.
It's actually them who are causing inflation or stagflation, and also them who are switching bullish and bearish gears.
But enough about that. I'm gonna' switch to the Technical Side.
I just wanted to get that off my chest. LOL
So, I'm an Elliottician. That means I trade by using the Elliott Wave Theory.
It proven to me over the years that it works.
The Market's price movements are simply suman beings buy & sell emotions, as a herd.
Yeah, they're all sheep, and most indicators are based those herd emotions.
So, on this USCCI chart, which is coming from 1953, I'm labeling my Elliott Wave Count.
What I see is a Triple Three Complex Correction, in a very BIG degree.
TradingView calls it: Elliott Triple Combo Wave (WXYXZ).
Based on that Wave Count, I am suspecting more down-side to this chart.
In a nutshell, I'm anticipating a RECESSION.
How big it will be and how long it will last, that depends.
For what I know, the Bear Market has already started for Indices globally.
My VIX (Volatility Index) idea backs this up.
Short and simple: the USCCI would tag the 61.8% Fibonacci Retracement of Wave A (white).
That's a point of interest for bulls, because it reflects the Golden Ratio.
If it breaches and goes lower than that, then it's not just a Recession anymore, it's gonna' be more like a Depression.
1929 all over again. Funny how these Cycles come into play...
My chart has labels and infographic stuff.
Write a comment if you want, give a like if you give a :poop: :D
Good luck!

The Deflationary SpiralAll credit booms brought about by Central Bank-induced artificially low interest rates and loose lending standards end in busts. In the recessionary phase that follows the boom, credit becomes much harder to attain and many over-leveraged businesses end up going bankrupt. The recessionary phase reveals the malinvestments and unsound business decisions that were made during the economic boom. Businesses & Consumers deleverage their balance sheets either through paying down debt or through bankruptcy. As loan demand falls & credit conditions tighten, debt issuance falls, which reduces the supply of money into the economy because the vast majority of currency that enters the economy is loaned into existence. When credit growths slows and begins contracting alongside a falling money supply, inventory piles up and profits & margins fall while consumer spending falls. Businesses are then forced to sell at discounted rates to liquidate inventory in anticipation of weak future demand, which further reduces profits & margins and leads to increased unemployment and weaker levels of consumption. The “Deflationary Spiral” subsides and an economic recovery can take place once balance sheets are back to healthy levels which can support debt accumulation, capital investment recovers, and once large amounts of the “bad” debts taken on during the economic boom have been deleveraged.
US M2 Money Supply is currently down -4.2% YoY using March 2023 data, the largest monetary contraction in the USA since the Great Depression. Using data going back to 1870, every time the money supply contracted by over 1% YoY the stock market had a large correction and the economy fell into a severe & lengthy contraction with unemployment reaching at least 7%. A banking panic always accompanied those contractions as well. Commercial bank deposits are currently down around -5% YoY, the most since the Great Depression. Total commercial bank deposits didn’t even contract during the early 1990s Savings & Loan Crisis. With money supply shrinking and the majority of banks unable to pay competitive rates on deposits, deposits will continue falling and more bank failures will occur. The large amounts of unrealized losses on bank balance sheets represent another impediment to loan growth and banks have continued to raise reserves for multiple quarters in response to rising default rates.
Fed research from the Fed Bank of Saint Louis show bank lending conditions (measured by percentage of banks tightening lending conditions) are comparable to early 2008 & late 2000. Bank lending conditions are a leading indicator for unemployment. The unemployment rate currently is still below 4%, but with the Conference Board’s Leading Economic Indicators index currently at -7.2% and the bond yield curve still inverted, many reliable economic datapoints show that the economy is closer to the beginning of this business cycle downturn and debt deleveraging than the end. Yield curve inversions & Conference Board LEI’s have been some of the best leading indicators for a recession since the 1970s. Since 1968, any Conference Board LEI contraction of more than -2% YoY has never yielded a false positive in regards to a coming recession. The Credit Managers’ Index newly released data for April showed that the index for rejection of new credit applications (within the service sector) was 45.9, its lowest level since March 2009.
The US Consumer is beginning to run dry on savings. The majority of Americans are living paycheck to paycheck and consumer credit growth (which had been expanding rapidly in 2022) has slowed markedly. Total consumer credit growth has fallen about 50% YoY (using the 3 month average of data from December - February). After falling below 3.2% in the summer of 2022, the US savings rate is still low by historic standards, currently 5.1%. Announced job cuts for the month of March were 89.7K, higher than the first 3 months of the 2008 recession. US large corporate bankruptcy filings (Bankruptcies of companies with over $50M in liabilities) from Jan-April totaled 70, seven more than during the same length of time in 2008. Student loan debt payments are set to resume again this summer, which will further reduce consumer spending. US Consumer sentiment levels measured by University of Michigan hit the lowest levels ever (going back to 1952) in the summer of 2022, and they have been fluctuating around 2H 2008 & 1H 2009 levels ever since. Delinquency rates on things like automobiles, credit cards, and commercial real estate loans are soaring. Cox Automotive found 1.89% of auto loans in January were "severely delinquent" and at least 60 days behind payment, the highest rate since the data series began in 2006. In March, the percentage of subprime auto borrowers who were at least 60 days late on their bills was 5.3%, up from a seven-year low of 2.58% in May 2021 and higher than in 2009, the peak of the financial crisis, according to data from Fitch Ratings.
Retail sales are an economic metric that track consumer demand for finished goods. US real retail sales down -2.1% and EU real retail sales are -9.9%. German real retail sales for the month of march just came in at -15.8% YoY! According to Bloomberg, Global PC shipments are down close to 30% YoY & Apple computer shipments are down about 40% YoY. In the past 50 years, US Gross fixed capital formation has only gone negative in the US before and during recessions. It is now negative and there has never been a false positive. Data from the Mortgage bankers association showed a -39% YoY decline in Mortgage purchase applications, a decline to its lowest levels in over 26 years. US Building Permits are down -24% YoY. Housing Starts YoY are down -17% YoY. Existing Home Sales are down -22%. Every national housing downturn in the past 45 years has taken at least 4 years from peak to trough prices, indicating that the current housing downturn is likely to continue for at least 2-3 years.
Every FED Regional bank report on manufacturing (using a 3 month average of the data) is in a contraction. The April Philadelphia FED Manufacturing index came in at -31.3. Since 1969, Every reading under -30 was either in a recession or a few months away from one. April Richmond FED Service Sector Index registered a -23, the same number as in Nov 2008 & Feb 2009 & worse than Jan 2009 which was -20 (August and September 2008 were -10 for reference). US manufacturing production is down -.5% YoY. March 2023 ISM PMI data was also very insightful. USA ISM Manufacturing PMI (March) was 46.3, its lowest level since June 2009 (excl. H1 2020). For reference, in the 08 recession, it wasn’t until October 2008 that the ISM manufacturing PMI fell under 46.3, over 9 months into that recession. USA ISM Manufacturing New Orders (March) was 44.3, its lowest level since March 2009 (excl. January 2023 & H1 2020), USA ISM Non-Manufacturing PMI (March) came in at 51.2, its lowest level since Jan. 2010 (excl. H1 2020).
The US Stock market is trading at one of the highest Shiller PE ratios & stock market capitalization to GDP ratios in history. Present day stock market valuations are rivaled only by the Roaring 20s Bubble (1929), The Nifty-Fifty Bubble (late 1960s/early 1970s) & the 1999/2000 Dot-com Bubble. All 3 of those examples were followed by the most negative 10 year real returns in USA stock market history going back to 1913. Over 40% of businesses in the Russell2000 are unprofitable and over 1/5 of the S&P500 are zombie companies. Clearly, the stock markets as of April 2023 are still in bubble levels of overvaluation.
Looking at the data in aggregate, I believe that a recession is currently occurring. Assuming earnings fall by about 30% peak to trough, using a conservative average from the past 4 US recessions, I assume S&P annualized earnings will fall to around 155. Using a conservative valuation multiple of 14, that gives a target price of about 2,200 for the S&P500 that is likely to be hit in Q4 2023 or 2024.
Thank you for reading,
Alexander Charles Lambert
