FLOWBTC - Sat in the Middle of a Channel, Still 20% Gains to GetLook at Flow on the 2d chart, there's been some really profitable trades in the last 8 or 9 months. In comparison the potential 20% gain we could be looking at here doesn't seem like all that much - but 20% is still huge!
Even though we're half way through this channel before getting a Long signal from Crypto Tipster v2 there's still plenty to be made in this trade, we're sat a healthy amount above a recent SR level so the price may sink down to touch this one more time before making it's way up the test the descending trend line once more..
Will it break through this time?
Maybe get a limit Buy in on that recent SR level @ 461 to really boost your gains on this one!
If you enjoyed or agree with this idea - drop us a comment, like & follow! :)
Descending Channel

ETHEREUM retest of the descending channel 📖💡Hello 🐋
as I mentioned,
in my previous analysis, the price hit the target
and now
Based on the chart, the price is close to the green trend line and the support zone ✔️📖
we can see more gain 🚀🚀
otherwise
we can see more correction to lower support level ❌🧨
👌 Notice: pay attention to the price on shortcut chart (located above the main chart with black colour) 📖💡
Please, feel free to share your point of view, write it in the comments below, thanks 🐋

Will gala break up from its current bear flag?We can see here on the weekly char that Gala is in a bear flag with a very long pole. We can also see that the flag is the shape of a descending channel, a pattern that tends to break upward. When we see a descending channel as a bearish flag it is usually an indication that bears are starting to lose steam.,,,how much steam they are losing will determine whether or not the descending channel wins the dominance battle and it breaks upward or the bearish flag maintains dominance and the pattern breaks downward. If this flag were to break upward instead of downward, the question then becomes will it break upward and then head the entire measured move of the flag but in the bullish direction? Or will it simply just head to the smaller target of the descending channel itself. It’s hard to say but just in case I have put both potential bullish targets on the chart. One other thing it could do is reach the bullish breakout target of the channel and then pull a 180 and still break down below the flag and head to the bearish breakdown measured move target of the flag even after reaching the channels bullish breakout target. Seeing as how the rest of the crypto market recently has begun to see bearish momentum dwindling, I think the bullish outcome has slightly more probability at the moment. Also the measured move for the bear flag breakdown would be negative 20 cents….typical negative targets are a clue that the bullish direction is more likely….always possible for a breakdown to happen at the end of bearish momentum that doesnt hit 100% of its target though. If we take a look at the current volume candle, it is the highest weekly volume candle on this charts history and it happened during a bullish impulse…which is yet more bullish confluence here to suggest a break up from this bear flag is very feasible. *not financial advice*

Gold heading to descending channel breakout trgtOn its way to the breakout target from the descending purple channel, Gold has now also formed an inverse head and shoulders which has an even higher breakout target. Price action is currently above the neckline of the inverse head and shoulders (in yellow). It could easily dip back below the neckline momentarily, but can also just as easily trigger the inverse head and shoulders breakout without going back below the neckline first. If it triggers the breakout for the head and shoulders the breakout target for it is notated here with the yellow price tag. I have included a link below to my previous idea on gold where I first spotted the breakout potential for the descending purple channel for posterity. *not financial advice*

SPX: This Could Change Everything. 👀• The SPX successfully rejected the Below the Stomach candlestick pattern from yesterday, and it failed in breaking the support at 4,015;
• This is a sign of strength, and makes a correction to the 21 ema less likely;
• The trend is still bullish, as it is still doing higher highs/lows, above the 21 ema (D), and there’s no clear reversal sign on it yet;
• Although the SPX rejected the Below the Stomach from yesterday, it has yet to break the resistance at 4,100;
• The 4,100 is a bullish pivot point, as seen in the weekly chart, and would be the first one since the bear market started in January 2022 - this could change everything and put an end on this bear market. The index already did an upwards breakout from the Descending Channel seen in the W chart;
• For now, the key points are 4,100 and 4,015. I’ll keep you updated on this.
Remember to follow me to keep in touch with my daily analyses!

Shiba Inu - 191% extreme profit! (unbelievable)
It's absolutely unbelievable for Shiba Inu coin because the technical analysis shows an extreme pump is likely in the immediate short term!
If you like Shiba Inu, you must hit the like button right now to support the future of this coin!
There is no doubt that Shiba Inu knows how to pump drastically, and what can happen to you is that you wake up in the morning and you will see a huge green dildo, so I think you want to fill your bags before it happens!
From the technical perspective, we can see a descending parallel channel on the daily chart that is very close to a bullish breakout. Also inside this descending channel, we can see an ABC ZigZag corrective pattern. With this confluence, we are pretty confident about an explosion to the upside.
This analysis is not a trade setup; there is no stop-loss, entry point, profit target, expected duration of the trade, risk-to-reward ratio, or timing. I post trade setups privately.
We have had a 92% correction from the all-time high. There was a massive bear market from 2021 to 2022. The bear market has been completed as an ABC zigzag pattern from the Elliott Wave perspective.
What is the next strong resistance on the way up? 0.00002514 and 0.00003384 without a doubt. They are both strong resistances, where we can definitely experience some selling pressure.
I am telling you that this is going to be massive, so make sure your bags are full with the Shiba Inu coin. You can buy on the spot or go long on futures with leverage.
Thank you, and for more ideas, hit "Like" and "Follow"!

Ethereum - New all-time high soon!
Ethereum is currently breaking out of the bearish descending channel after 418 days! The profits are already massive, but the good news is that we are just starting the new bull market, not ending it!
A new all-time high on ETH is closer than everyone is expecting, so I hope your bags are full of crypto. The bull market is always the most profitable session, because the risk-to-reward ratio of trades is much higher than in the bear market.
From the Elliott Wave perspective, the downtrend has been completed with a classic ABC zigzag corrective pattern. We have already begun a new impulse wave in June 2022!
This analysis is not a trade setup; there is no stop-loss, entry point, profit target, expected duration of the trade, risk-to-reward ratio, or timing. I post trade setups privately.
The trend is your friend until the end, but the trend has changed from bearish to bullish, so for swing and intraday trades, you should look mostly for longs, not shorts!
I expect this bull market to end in September 2025, so we have plenty of time! Be greedy until the whales dump again for the next bearish cycle.
This is a long-term technical analysis on the weekly / 3D chart. Pullbacks on lower timeframes are possible, so follow me for more updates!
Every bullish cycle looks different, but I look forward to this bullish price action!
Thank you, and for more ideas, hit "Like" and "Follow"!

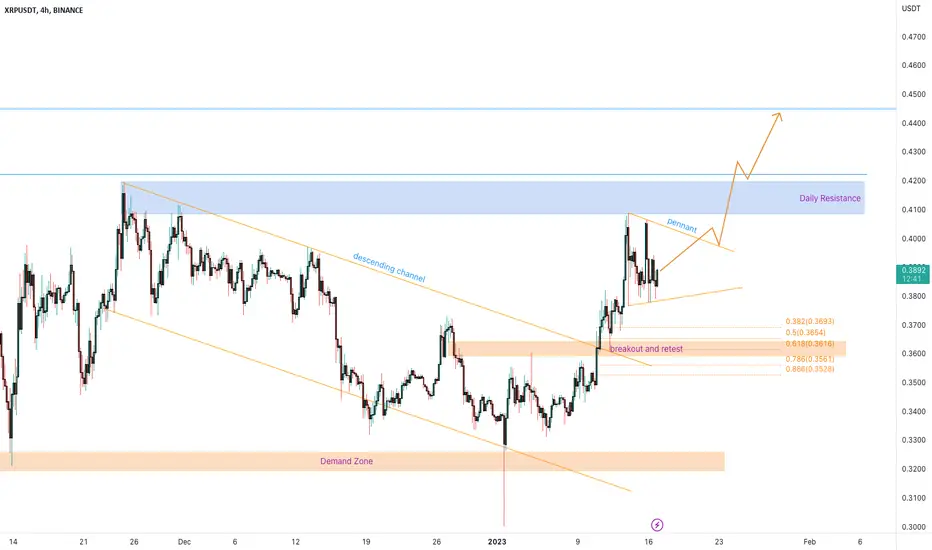
XRPUSDT wants the breakout from the key level?The price had a clear breakout from the descending channel and retest it as new support on 0.36$ area on 0.618 Fibonacci level.
XRP got the liquidity from the false breakout from the 0.33$ area, where the market created the local demand zone
At the moment the price is going to create a pennant just below the daily resistance and key level
How to approach it?
the price needs to create a new breakout from 0.41$ area, it's a clear and strong resistance for the price. For that reason, we could see an accumulation phase below this structure.
–––––
Follow the Shrimp 🦐
Keep in mind.
🟣 Purple structure -> Monthly structure.
🔴 Red structure -> Weekly structure.
🔵 Blue structure -> Daily structure.
🟡 Yellow structure -> 4h structure.
⚫️ Black structure -> <= 1h structure.
Follow the Shrimp 🦐
USDJPY - Descending Channel w/ Possible Bull Activity Later As we can see USDJPY is currently in a descending channel. And heading towards a major support level near 126.00 and 125.00. To further confirm the bearish sentiment the pair seems to be in formation of wave 5 of the Elliott Wave Theory. For the short portion of this trade I look to take profit around 126.500. After heading down for a short term sell we may see some bullish activity, but will have to wait for it to break out of the descending channel for more confirmation.
Upgrade your trading with me
For FREE SIGNALS and if you would like to see updates on this idea and many more please follow:
@wrightwayinvestments
@wrightwayinvestments
@wrightwayinvestments
✅ Hit the like button, and share for more!

USDCHF - DESCENDING CHANNEL 📉The USDCHF price is in Descending Channel🧐
The Last Lower Low is broken & retested🔥
so, i predict a bearish move 📉
TARGET: 0.89899🎯
...
if you agreed with this IDEA, please leave a LIKE, FOLLOW or COMMENT!

BUY GBPAUD- Descending channel that was broken and retested, given us the signal of a trend chage.
- Bullish flag pattern formed as well giving us the signal for an up trend continuation.

BTC and ETH are being pumped by Bogdanoff !
The Bogdanoff twins claim they participated in helping Satoshi Nakamoto build Bitcoin. Igor and Grichka Bogdanoff claim to have helped Satoshi elaborate on Bitcoin’s ‘predictive code’.
Bofdanoff twins died in 2022. They were both at the same hospital, Grichka died six days earlier than Igor. The twins also claim to have known Satoshi Nakamoto, the creator of Bitcoin.
There are rumors and conspiracy theories that the Bogdanoff twins can manipulate cryptocurrency prices from the afterlife. Do you think it's true? Let me know in the comment section right now!
Ethereum and Bitcoin are now unstappable, and the FOMO hasn't even started. The fear is still extremely high, and a lot of people believe in lower prices, such as 10k for Bitcoin.
From the technical perspective, you can clearly see a parallel channel on the daily chart that is currently breaking out! This is huge. This channel is also a ZigZag corrective pattern from the Elliott Wave perspective, which is even better!
This analysis is not a trade setup; there is no stop-loss, entry point, profit target, expected duration of the trade, risk-to-reward ratio, or timing. I post trade setups privately.
There is some resistance on the way up, of course. All of them are pretty significant, and I believe we will reach 4,080 USDT pretty quickly. This seems to be the strongest resistance, but we will see! I want to see the developing market structure and waves to determine the profit target first.
It's absolutely a pleasure to see that the bulls are back, and I wish you massive profits!
Look at my previous idea about ETH, where I told you to buy it almost at the bottom. Check out the related section down below!
Thank you, and for more ideas, hit "Like" and "Follow"!
Who thinks that this January is the best month ever? Let me know in the comment section!

NVDA: This is what it needs to EXPLODE. 🚀• NVDA is incredibly bullish, however, it is trading at a critical key point;
• NVDA just hit a trend line that connects all its previous top levels since Nov 2021;
• What’s more, NVDA is inside a Descending Channel;
• However, if it breaks this resistance level, NVDA might trigger a long-term bullish reversal structure;
• It would not only break free from a Descending Channel, but would trigger an Inverted Head and Shoulders chart pattern, in the weekly chart;
• This would be the confirmation sign of a bullish reversal on NVDA – however, this pattern wasn’t triggered yet;
• Any top sign under this resistance could easily frustrate the bullish thesis, therefore, we must keep our eyes open;
• I’ll keep you updated on this.
Remember to follow me to keep in touch with my daily analyses!

HDFCLIFEHdfclife broke out of falling channel on 30 min TF with decent volumes.
Could be bought with mentioned stoploss & targets,.

Bitcoin - Please be greedy and FOMO in!
Bitcoin is absolutely pumping heavily right now, and there is not too much time for you to jump in, so you need to FOMO in ASAP and be greedy!
The pump is real, and if you think this is a scam pump and we are going to go soon to 14k, then ...........
The next target for Bitcoin is around 29k! In one of my next analyses, you will see why this is a very important level, so make sure you follow me!
Bitcoin is currently approaching a significant resistance level, which is the 0.618 FIB + start of the FTX dump + start of the GAP. It's possible that the bears will step in temporarily, so keep that in mind!
There is of course a possibility of a retest of the rectangle pattern, which is at 18,400. Also, it's a breakout level of the major trendline from August.
If you haven't seen my idea from January 5, where I told you bitcoin was going to exponentially pump, check out the related section down below. Everyone was bearish back in the day!
There is absolutely no bearish divergence on the higher timeframes, and the uptrend looks extremely healthy and powerful!
This analysis is not a trade setup; there is no stop-loss, entry point, profit target, expected duration of the trade, risk-to-reward ratio, or timing. I post trade setups privately. I share my trades privately.
If we take a look at the end of the downtrend, we can spot a SFP (swing failure pattern), or someone can also call it a double bottom pattern. The neckline of this pattern is currently breaking out. A trendline from August is breaking out as well.
From the Elliott Wave perspective, we are in the third wave of the third wave, which is the most impulsive phase. Also, you can see my Elliott Wave count on the chart, so check it out.
Thank you, and for more ideas, hit "Like" and "Follow"!

Gold has broken up from the descending channel.Hard to say whether or not it will reach its full target, but seeing as how it is already pretty close to that target, the risk to reward ratio of trying to jump into the trade now in hopes that it will is not worth the risk imo. As a long term hold I still see gold as a wise investment though so it wouldn’t be the worst thing to buy some here and maybe wait for a correction after this breakout move to accumulate more. *not financial advice*

Ethereumm just hit the white descending channel target!Target Hit! You can see here the measured move (dotted white line) taken from the point of the breakout from the white descending channel. Been watching it since November, but it finally hit its target with exact precision! Hard to tell if it will cool off much now or continue to climb…the pink rising channel has a measured move slightly higher than this and it looks like it has broken up from the rising channel too which is never a good signal for bears if a bearish pattern breaks upward. *not financial advice*

NIO: The Most Important Support is Here! 👇• NIO is still in a long-term bear trend, however, it is doing an important reaction this week;
• It is confirming a bottom sign, just above the support at $9.40 (Support in Oct 2022, and Gap from Jul 2020);
• Only if it loses the $9.40 I see NIO seeking the purple line below the price, maybe even the $5.70 (Jan 2020 top level);
• However, the recent reaction might jeopardize a bearish sentiment, at least for now. It all depends on how it’ll react in the daily chart:
• Yes, NIO triggered a Bearish Flag, and as far as I know, it is just doing a pullback to the lower purple line again, before another drop;
• If NIO enters the Flag area again, and does a clear bullish structure, it’ll most likely frustrate this bearish pattern, and seek the next resistance in the weekly chart, which could be either the 21 ema or the upper trend line;
• Either way, NIO looks promising. I’ll keep you updated on this.
Remember to follow me to keep in touch with my daily analyses!

ApeCoin (NFT) is pumping thanks to Donald Trump! (massive)
APE coin looks very strong at this moment, also thanks to President Donald Trump and his NFT collection. That is also great news and an important catalyst for the NFT coins, such as the APE coin.
APE coin is currently breaking out of the falling wedge pattern on the daily chart! The main downtrend wave has been completed, and now we are looking for a bullish retracement.
How far could the APE coin go? Well, I am personally selling APE coin at the strong resistance, which is the 0.618 FIB or monthly resistance + GAP (10.5 - 11.3). My entry price is 4.112.
I share my trades privately. This analysis is not a trade setup; there is no stop-loss, entry point, profit target, expected duration of the trade, risk-to-reward ratio, or timing.
From the Elliott Wave perspective, unfortunately, this coin still looks pretty weak. We can spot two corrections: wave 2 and wave 4. This appears to be an impulse wave, implying significant selling pressure and the possibility of another major crash in the future.
APE is a great coin to trade on the futures market because it's highly liquid and there are a lot of opportunities. You can short APE at the 0.618 FIB, and this is exactly what I am going to do later!
The crypto market is very bullish at this moment, so I am not shorting anything and am only going long.
Thank you, and for more ideas, hit "Like" and "Follow"!

GOLD NATURE PREDICITON | 8-JAN-2023By looking at the week TF chart I analyzed the following things that I want to share:
1. Duration of the first double top was 567 days
2. Duration of descending channel was 238 days
3. Formed a bullish rally (approx 76% up) of 21 months by breaking a major resistance level
4. Duration of the second double top was 574 days
5. Duration of descending channel was 238 days again
So the market manipulators (Big Boys) hopefully will move the market upside
Let's see what happens

Shiba Inu is breaking out! Take a huge profit here.
Shiba Inu is absolutely prepared for a massive uptrend on the daily chart! We can see that the price is breaking out of the falling wedge pattern.
This falling wedge pattern is not a standard wedge because it is also an ending diagonal from the Elliott Wave perspective, which is a powerful combo.
Also, on the RSI indicator, we can spot a bullish divergence between the swings. It's also a strong indication that the bears are losing steam.
It's a great time to open a long position on the futures market, as I already did!
This analysis is not a trade setup; there is no stop-loss, entry point, profit target, expected duration of the trade, risk-to-reward ratio, or timing. I post trade setups privately.
Now the most important question is: where is the profit target? On the way up, you obviously want to target strong resistance.
Strong resistance is undoubtedly the start of the previous GAP + top of the parallel channel, and if the bulls break this level, the previous consolidation structure's POC will be reached. You can see these levels on the chart!
If you haven't seen my analysis about Bitcoin's exponential pump, then you must, so check out my related section down below.
December was an extremely good month when it came to opportunities in the crypto market, and January is starting very positively as well.
Thank you, and for more ideas, hit "Like" and "Follow"!

Ethereum - Big overview of the bear market.
The bears are in full control because ETH is below the two major trendlines and also below the 200-day moving average.
We have a FTX GAP between 1545 and 1352. This gap was caused by a huge panic sell-off of traders due to the collapse of the FTX exchange and by CZ Binance, who tweeted that he was not going to buy FTX as he wanted. This gap can be filled, but of course it doesn't have to.
Also, there is a 0.618 FIB at 1415 + the top of the yellow trendline + the 200-day moving average, which is another strong resistance. The bulls need a lot of strength to break this zone, and even if they are able to do it, there is another white trendline, which is the top of the parallel channel at around 1800. It's hard to say if the bulls will be motivated enough to break it.
I don't want to be bullish about this strong resistance, but we can definitely touch it, no problem. At this moment, my trades are only short-term swing and intraday trades, so I am not thinking about buying any coins for the long term.
I still think the bear market will continue in 2023 because other coins look extremely bearish, including Bitcoin.
This analysis is not a trade setup; there is no stop-loss, entry point, profit target, expected duration of the trade, risk-to-reward ratio, or timing. I post trade setups privately.
As you can see on the chart, the price is moving in two parallel descending channels. The top trendline of the first white parallel channel has only two touches, so the third touch should be rejected strongly.
This is a bearish Elliott Wave count, and we are currently at the 3rd wave of the 5th wave. I suggest continuing lower to complete this impulse wave.
I would love to buy ETH for around 250 - 300. I believe it is possible to get there, based on other assets such as stocks. TSLA, META, NTFLX, etc. are experiencing the biggest crash in history. And ETH is also, basically, in the IT sector.
If ETH drops below the key resistance of 1073, I expect a huge flash crash to the bottom of the descending channel.
Overall, I am bearish, and we may definitely see some relief rally. But don't get rekt by the main resistance I mentioned earlier.
Look at my idea about SOLANA (exponencial growth) in the related section down below.
Thank you, and for more ideas, hit "Like" and "Follow"!

Solana - Buy here for a 452% PROFIT! (Best level)
You are wondering why SOL is falling drastically and maybe where the best level to buy is. In this analysis, I will show you!
Technically, this coin is very weak. The downtrend is steep and very impulsive, no doubt about it.
But it is also a great opportunity for buyers to speculate on the midterm long position. But first of all, we need to find the best level for it.
Fibonacci is a very powerful tool, and we can use the confluence of the FIB retracement and FIB extension to look for a level where there is likely to be a trend reversal point.
We need to take a FIB retracement (LOG FIB) from the previous huge uptrend from 2020–2021. We can see that 0.618 FIB is at 8.52 USDT. 0.618 FIB is, of course, the strongest FIB level.
Also, we need to take a FIB extension from wave 3 => 4 to predict a fifth wave. There is a pretty good chance that the trend reversal point can occur at the 1:1 FIB extension, which is around 8.74 USDT.
Because we have a very strong fibonacci support between 8.52 and 8.74 USDT, we can place a buy order here and wait for the price to reach this level!
Sounds pretty easy, doesn't it? I think we should see a lot of buyers here, and we can expect a major rally with a potential profit of 452%!
If you bought SOL at a higher price and you want to get out, then it's good news for you! I don't have any SOL at this moment, so I am waiting for the price to come to me!
The price is moving in the descending parallel channel, and this is also a great opportunity to buy SOL at the bottom of the channel, so we have another confluence to buy SOL!
This analysis is not a trade setup; there is no stop-loss, entry point, profit target, expected duration of the trade, risk-to-reward ratio, or timing. I post trade setups privately.
I hope you guys will take this trade! Take care.
For more ideas, hit "Like" and "Follow", right now!
