DOGE → Retest of the panic zone. One step away from a downtrendBINANCE:DOGEUSDT.P is facing selling pressure. After distribution (pump), the price enters a correction phase (dump) and storms the panic zone, a breakout of which could intensify an uncontrolled decline.
DOGEUSDT squandered all the potential accumulated in late April and early May. The distribution ended in the 0.2600 zone, after which the coin entered a correction phase. At the moment, the coin is testing the panic zone of 0.21400
All attention is on the base of the triangle at 0.21400. This is the panic zone. When the support breaks, buyers will be liquidated, and sellers may increase sales, which could trigger a bearish momentum.
Resistance levels: 0.222, 0.2307
Support levels: 0.2145, 0.2135
The main idea is a continuation of the decline. The trigger is a breakdown of support at 0.2135 and consolidation of the price below this zone, only in this case will the price continue to fall.
!!! The structure will be broken if the price reverses and consolidates above 0.222 and confirms the bullish sentiment with price consolidation above 0.23, in which case we will again consider growth.
Best regards, R. Linda!
Descending Channel

PEPE/USDT is Nearing an Important ResistanceHey Traders, in today's trading session we are monitoring PEPE/USDT for a selling opportunity around 0.00001330 zone, PEPE/USDT is trading in a downtrend and currently is in a correction phase in which it is approaching the trend at 0.00001330 support and resistance area.
Trade safe, Joe.

GOLD consolidated below a key level on FridayGold is in a downtrend forming a counter-trend correction. Friday's trading session closes below the key level of 3203-3205. Buyers are weaker than sellers.
But, before the continuation of the fall MM is quite likely to test the resistance to provoke ordinary buyers before the fall
Scenario: the growth attempt may turn out to be false. A retest of 3203 resistance, a false breakout and price consolidation below 3203 is a sell signal.
Additional scenario: MM trap to provoke buyers to buy. A retest of the far resistance 3230, a false breakout and a price fixing below 3223 could start a decline

USDCHF 30M | Fair Value Gap Sell Setup Inside Bearish Channel📊 USD/CHF Smart Money Breakdown — May 16, 2025
Here’s a clean SMC-driven setup where price respects the bearish order flow, taps a Fair Value Gap (FVG) and rejects right at liquidity inducement levels.
Let’s break it down 👇
🔍 1. Context
Price is respecting a descending channel structure
Clean internal liquidity run up into:
✅ FVG zone from prior imbalance
✅ Top of bearish channel trendline
This is a classic liquidity sweep before expansion lower
🎯 2. Entry Plan
Entry zone: 0.8375–0.8391 (FVG zone shaded in red)
Stop loss: Just above 0.8391 (invalidates FVG zone)
Target zone:
🟢 TP1 → 0.8340 (minor inefficiency fill)
🟢 TP2 → 0.8327 (liquidity resting at the low)
➡️ RR ratio is about 1:3 on full target — clean sniper range!
📉 3. Smart Money Logic
Retail likely triggered buy orders into that FVG zone
Institutions tap FVG for premium entry
Price already printing rejection wicks — early signs of displacement
Watch for confirmation via:
Bearish engulfing candle close
Break of minor bullish structure on 5m
⚠️ Risk Notes:
Watch out for USD fundamental news that might cause a fakeout spike
Let price confirm breakdown before stacking entries
💬 Do you trust the FVG? Or think price will smash through?
🧠 Drop your confluence in the comments below and follow @ChartNinjas88 for precision setups like this every day.

GOLD → The fight for 3,200 continuesFX:XAUUSD has recovered after a bearish distribution. The price has returned to the range but continues to test the fundamental threshold of 3200.
The fundamental background has been gradually improving recently, which is putting pressure on the gold market, increasing the profit-taking ratio and the level of sales. After the resolution of the tariff war, all attention has shifted to the negotiations between Russia and Ukraine, and de-escalation could also reduce economic risks. As well as the escalation of the conflict in the Middle East...
Technically, the price is returning to the range after a deep false breakout but is facing strong resistance and pressure from sellers. Further developments depend on the 3200 level, which is of fundamental importance.
Resistance levels: 3225, 3236, 3257
Support levels: 3204 - 3200, 3194
The battle for the 3200 area continues, with bulls likely to try to keep the price above 3200, in which case the market may test the 0.5-0.7 Fibonacci zone. However, given the recent improvement in fundamentals, the price may return from these zones of interest to 3200 with the aim of continuing the assault to break through and continue the downtrend.
Best regards, R. Linda!

GBPJPY → Return to range. Possible price decline.FX:GBPJPY is forming a local bearish trend amid a correction in the dollar. The price is returning to the range and entering strong resistance.
Amid a correction in the dollar, the Japanese yen is strengthening, putting pressure on the currency pair.
GBPJPY is returning below a strong level (within the range) and consolidating in the selling zone, which could trigger a continuation of the decline towards areas of interest. Technically, the global trend is neutral and the currency pair is forming a rebound from strong downward resistance. If the bears keep the price below 193.45 - 193.74, the local downward trend may continue.
Resistance levels: 193.45, 193.74, 194.22
Support levels: 193.04, 192.35, 191.65
Price consolidation below 193.74 - 193.45 will confirm that bears are holding the range resistance. The sell-off may continue, and in this case, the price will head towards the indicated zones of interest and liquidity.
Best regards, R. Linda!

NZDJPY may end its rally with a correctionNZDJPY almost without pullbacks, with one impulse forms a strong fall. The potential is starting to run out and the market will need a breather. The current wave may test the zone of interest at 85.268 and move into the correction phase
The price is ready to test the strong support at 85.268, the limit level is most likely still in the market and may hold the support area and thus trigger a correction and pullback to 0.5 fibo
Scenario: fall to 85.268, false breakdown and rebound to the first zone of interest (imbalance) 86.500

GOLD → Correction ahead of news. Will the decline resume?FX:XAUUSD has been buying back all the losses from the Asian and Pacific sessions since the opening of the European session, but this looks more like a catapult being loaded...
GOLD broke through the global consolidation base of 3200, which only confirmed the bearish market structure. Investors are waiting for PPI and retail sales data in the US, as well as Fed Chair Powell's speech.
Expectations of fewer Fed rate cuts and optimism surrounding trade talks with China and South Korea continue to weigh on gold. However, weak macro data and a growing US budget deficit could revive interest in this safe-haven asset.
GOLD is in a correction phase and is heading towards the zone of interest: the liquidity zone and previously broken support of global consolidation.
Resistance levels: 3187-3190, 3200
Support levels: 3123, 3100
Gold may test the indicated resistance, but based on the nature of the market, this situation may end in a false breakout and a fall. Target 3123 - 3100.
However, unpredictable data may temporarily change the market, which could lead to momentum towards 3220-3230.
Best regards, R. Linda!

History repeats itselfOANDA:EURUSD
Here’s a technical analysis of the higher timeframes, specifically the monthly chart for EUR/USD.
As clearly visible, price action is currently moving within a respected descending channel. The saying "history repeats itself" seems particularly relevant here, especially in the context of Trump’s presidency. While this topic has been discussed frequently, I wanted to highlight the striking similarities once again.
The current market cycle closely mirrors the previous one from 2016-2017 — in terms of structure, timing, and volume. At present, we appear to be in the distribution phase, which is far from complete.
It’s quite plausible that we may see further downside before another significant move to the upside begins. If we take the 2017 distribution phase as a reference (lasting approximately 300 days), the current phase has only been unfolding for around 80-100 days.
Of course, there is no guarantee that price will rise again — but I consider it very likely that this market cycle has not yet fully played out. Technical analysis on higher timeframes often provides stronger probabilities and a clearer picture of the overall trend.
On the right-hand side of the chart, I’ve marked a weekly imbalance (not directly visible on the monthly chart), which aligns with the 50% retracement level of the Fibonacci tool. I view this confluence as a strong potential entry for a swing trade targeting the upper boundary of the descending channel.
This outlines my current trading outlook.

GOLD → One step away from a bullish trend reversalFX:XAUUSD is emerging from the local corrective channel “flag.” Pre-breakdown consolidation relative to the base of the reversal pattern continues. All eyes are on 3200...
Gold is losing ground amid trade optimism and a strong dollar. The price is falling at the start of Wednesday as traders take profits after a rise from weekly lows. Weaker-than-expected US inflation has not justified expectations, but the Fed's refusal to cut rates soon is weighing on the metal. Optimism surrounding new trade agreements between the US and China, the UK, and other countries, as well as hopes for peace talks between Russia and Ukraine, are reducing demand for gold as a safe-haven asset.
Technically, the overall situation looks bearish. There is no deep pullback from support, which means pressure from sellers in the market. Consolidation is forming before an attempt to break through the 3200 level.
Resistance levels: 3243, 3257, 3269
Support levels: 3222, 3200
If the price continues to consolidate in the current local range and continues to attack support at 3222-3200, then in the short and medium term, we can expect the decline to continue. However, knowing the tricks of MM, the price may form a short squeeze relative to local resistance zones before falling further.
Best regards, R. Linda!

NZDJPY → Countertrend correction and false breakoutFX:NZDJPY is testing resistance within a global downtrend. The currency pair is not yet ready to continue its growth and is forming a local reversal pattern.
Within the global downtrend, the currency pair is forming a countertrend correction and testing resistance at 87.400. The liquidity pool formed above this level is not yet ready to let the price move further. Without the possibility of continuing growth, the price returns to the range and forms a false breakout of resistance. However, since we are in the range and the price has returned inside it, if the bears hold the line (the upper limit of the trading range) at 87.400, this could trigger a further decline, thereby continuing the global downtrend.
Resistance levels: 87.400
Support levels: 86.5, 85.26
Consolidation of the price below 87.400 will confirm that the price is not yet ready to continue the trend. The falling dollar index is provoking a rise in the Japanese yen, which may also put pressure on the currency pair.
Best regards, R. Linda!

GOLD → Retest resistance before fallingFX:XAUUSD is forming a correction and retesting a strong resistance and liquidity zone within a downtrend. The global trend is one step away from a reversal...
Gold stabilized ahead of the release of US inflation data. After falling 3%, gold is holding steady at around $3,200, consolidating against a weaker dollar. Investors are awaiting US CPI data, which could set a new direction.
Optimism about the US-China trade agreement, geopolitical détente, and profit-taking on the dollar are holding back the price decline. The market is assessing how inflation data will affect Fed policy and demand for safe-haven assets.
Globally, the market doubts that the upward trend will continue, and there are reasons to look for points from which the price could start to fall sharply...
Resistance levels: 3269, 3284
Support levels: 3246, 3200, 3167
The news may cause a shake-up, but if there are no surprises, a false breakout of 3260-3270 and consolidation of prices in the selling zone could trigger a decline to 3200-3150.
Best regards, R. Linda!

NZDUSD is preparing for a reversal and a fallNZDUSD is in consolidation and preparing to exit it. Ahead is possible breakout of trend support and fall to 0.5757
The reason is as follows: change of fundamentals background (positive signals on tariff war), dollar growth and market reversal.
Scenario: break of consolidation support at 0.5885, price consolidation below this level - this will be a signal ready to start distribution, i.e. downward movement.
Primary target 0.5 fibo, secondary target 0.7 fibo

GJ ANALYSISGJ has been in a bearish channel for months. Currently price is bullish but it could still flip bearish based off where price is currently at. Also, I wouldn't be surprised if price retraces towards 195.600 area then flip bearish.

USDCAD → Storming the support level to break throughFX:USDCAD continues to storm support within the trading range amid a global downtrend
The currency pair is within the range, but the battle for support continues. The reaction to false breakouts is weakening and the price continues to attack the 1.378 level, which only increases the chances of a further decline
The dollar is rebounding from resistance and beginning to fall, which is having a corresponding effect on USDCAD. If the currency pair breaks 1.378 and consolidates below the level, this could trigger a continuation of the trend after consolidation...
Resistance levels: 1.381, 1.383
Support levels: 1.378, 1.374
Focus on the lower boundary of the trading range at 1.378. The role of the range is consolidation against the backdrop of a downtrend. Thus, a breakout of support will activate the distribution phase
Best regards, R. Linda!

NZDUSD Potential DownsidesHey Traders, in today's trading session we are monitoring NZDUSD for a selling opportunity around 0.59650 zone, NZDUSD is trading in a downtrend and currently is in a correction phase in which it is approaching the trend at 0.59650 support and resistance area.
Trade safe, Joe.

EURUSD is Trading Under the Pressure of a Strong DollarHey traders, in today's trading session we are monitoring EURUSD for a selling opportunity around 1.13500 zone, EURUSD is trading in a downtrend and currently is in a correction phase in which it is approaching the trend at 1.13500 support and resistance area.
Trade safe, Joe.

AUDNZD long time berish,- time for changes?
OANDA:AUDNZD we are have fall last 2 months, price is break DESCENDING CHANNEL, based on technicals here expectations are strong bullish.
SUP zone: 1.07300
RES zone: 1.09200, 1.09700

GOLD → Trend reversal, downward distribution, and new targetsFX:XAUUSD breaks through 3270 and enters a distribution phase amid a rising dollar. We are most likely at the beginning of a trend reversal...
On Thursday, gold remains under pressure, trading at a two-week low, as the market reacts to Trump's statements about potential trade agreements with a number of countries, including China. Optimism surrounding the negotiations is boosting risk appetite, reducing interest in gold as a safe-haven asset. Even weak US GDP and inflation data failed to halt the rise in gold prices, as traders' attention is focused on the trade agenda and upcoming labour market statistics.
Gold is changing its trend due to the rise of the dollar and a shift in the fundamental background. A breakout of the local low could reinforce the decline. The first target is 3190. There is a possibility of a retest of the previously broken consolidation support at 3268 before the decline continues.
Resistance levels: 3245, 3270
Support levels: 3190, 3186, 3167
A breakout of the local low of 3221 could trigger a further decline. The first stop could be around 3190. From this level, a small correction or consolidation may follow before the decline continues.
I do not rule out the possibility of a retest of 3245-3270 before the decline continues.
Best regards, R. Linda!

NVDA - BullishForecast a break-out up as the price increased by 3.3% in the after hours.
- The price area in a falling wedge, almost a descending channel.
- The MACD indicator in the Weekly frame shows an uptrend after a rare day of oversold (04.04.2025).
The price today (04.30.2025): $108.92.
Price target: $135.00.
Stop loss: $95.00.
IMO, amateur trader.

GOLD → Consolidation. Traders are waiting for news...FX:XAUUSD remains in consolidation at 3370-3270. Traders are in no hurry to take any action, as there is a lot of important news ahead. Let's take a closer look at the situation...
On Wednesday, gold is trading lower, remaining in a sideways range as traders await the release of US GDP data for the first quarter. A sharp slowdown in growth is expected, and a possible contraction in the economy could increase bets on a Fed rate cut and support gold. Meanwhile, the dollar is holding steady amid tariff news and expectations for key employment and inflation data.
A retest of the range support is forming. The approach is quite sharp, and the pre-breakout potential has been exhausted. A false breakout of support could trigger an upward correction.
Support levels: 3270, 3245
Resistance levels: 3314, 3329, 3352
If the dollar continues to fall after the news, this could support gold and the price could continue to trade between 3370 and 3270. Unpredictable news could trigger a breakout and a fall.
Best regards, R. Linda!

NZDUSD Continues to Trade Under the Pressure of a Strong DollarHey Traders, in today's trading session we are monitoring NZDUSD for a selling opportunity around 0.59400 zone, NZDUSD is trading in a downtrend and currently is in a correction phase in which it is approaching the trend at 0.59400 support and resistance area.
Trade safe, Joe.

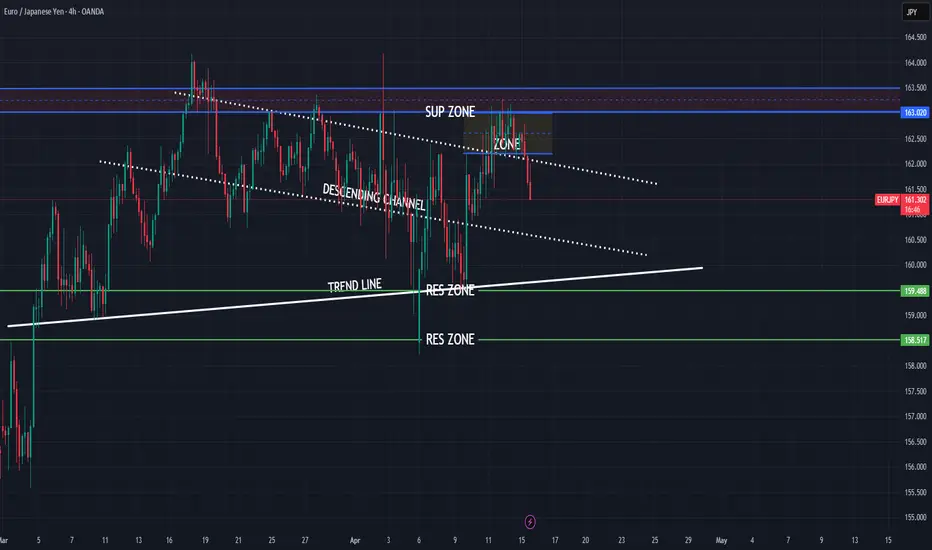
EURJPY strong bearish expectations
OANDA:EURJPY strong bullish expectations i am have, but things will not go like expected..
Currently price in DESCENDING CHANNEL, in moment we are have break of same, but price is make revers in zone and pushing now bearish.
Here now exepcting fall till trend line.
SUP zone: 163.000
RES ozne: 159.500, 158.500