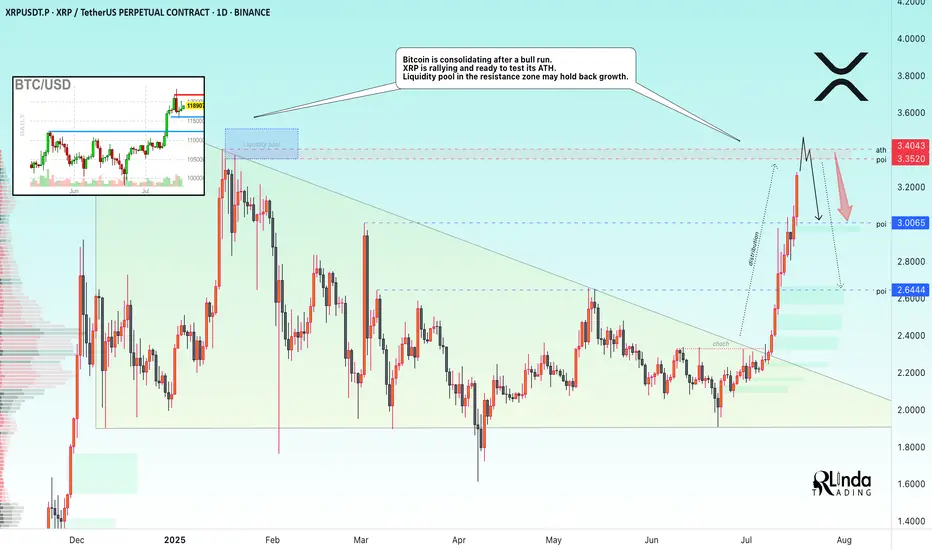
XRP → ATH retest. Reversal or continued growth?BINANCE:XRPUSDT.P is rallying and ready to test the resistance zone - ATH. Against this backdrop, Bitcoin is consolidating after a bull run. The liquidity pool may hold back growth.
Fundamentally, there is excitement across the entire cryptocurrency market. Altcoins are rallying after Bitcoin hit a new high and entered consolidation. The BTC.D index is declining, which generally provides a good opportunity for altcoins to grow. However, the index is approaching technical support, which may affect market sentiment overall...
As for XRP, there is a fairly strong liquidity pool ahead — the ATH resistance zone. The price is in a distribution phase after a change in character and a breakout of the downtrend resistance in the 2.33 zone. The momentum may exhaust its potential to break through the 3.35-3.34 zone, and growth may be halted for correction or reversal (in correlation with Bitcoin's dominance in the market).
Resistance levels: 3.35-3.40
Support levels: 3.0, 2.64
A breakout of resistance without the possibility of further growth, a return of the price below the level (i.e., inside the global flat) will confirm the fact of a false breakout of resistance, which may trigger a correction or even a reversal.
Best regards, R. Linda!
Descending Triangle
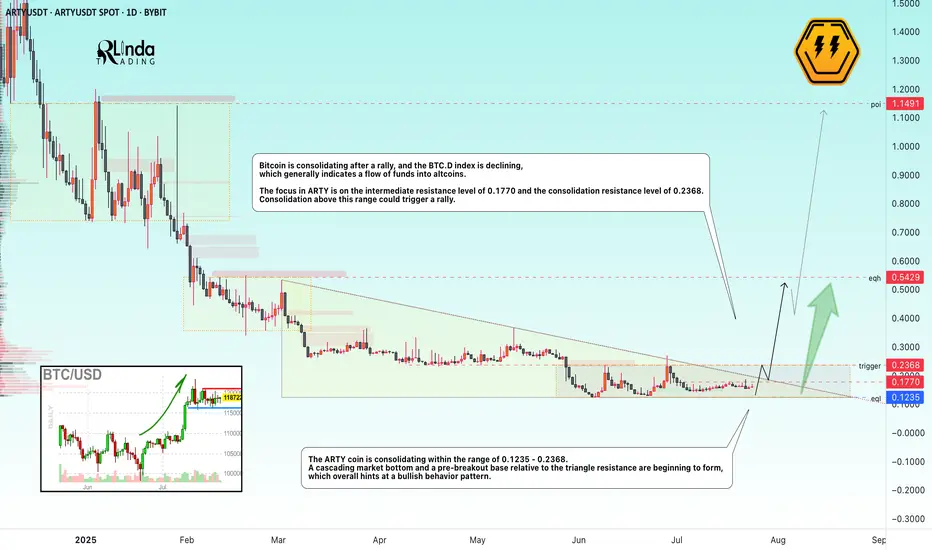
ARTYUSDT → A breakout of resistance could trigger another rallyBYBIT:ARTYUSDT is forming a cascading bottom as part of consolidation before a possible breakout of resistance. The decline in Bitcoin's market dominance gives altcoins a chance.
( (Idea from September 29, 2024!) We previously discussed this coin before its 300% rally. The root causes of its emergence from accumulation and readiness for strong growth were correctly identified).
The dump phase is coming to an end, a cascading market bottom is beginning to form, and a pre-breakout base relative to the triangle resistance is forming, which overall hints at a bullish behavior pattern.
Bitcoin is currently consolidating after the rally, and the Bitcoin dominance index is declining, which generally indicates a flow of funds into altcoins. The situation is such that the altcoin market has another chance for the season. The correction across the entire market may end in the near future, and under favorable conditions (the fundamental background is strengthening, Trump has announced another important event for cryptocurrencies), the market may return to strong movements...
The focus in ARTY is on the intermediate resistance at 0.1770 and the consolidation resistance at 0.2368. Consolidation above this range could trigger a rally.
Resistance levels: 0.2368
Support levels: 0.1235
Technically, a few days ago, the coin tested the consolidation resistance, but the decline did not continue, which generally indicates that buyers are showing interest and holding the market. Consolidation in the near term may end with a retest of 0.1770, 0.2368, a breakout, and further growth.
Best regards, R. Linda!
BITCOIN → Consolidation and compression to 116K. Correction?BINANCE:BTCUSDT.P continues to consolidate, with the price testing support at 116K, leaving behind the zone of interest at 120K-121K. Are there any chances for further growth?
(Alternative scenario (if growth to 120K does not occur))
Fundamentally, there is nothing particularly new, and the hype surrounding Bitcoin is stagnating. Technically, on D1, consolidation is underway with pressure from bears against the backdrop of an outflow of funds into altcoins. However, the dominance index is starting to rise, which could trigger some correction in the market. The price on the working timeframe, without updating local highs, is testing lows, and the latest retest of the liquidity zone is provoking a fairly aggressive reaction that could bring the price to retest the zone of interest at 120K-121K.
But! If the price is squeezed between 116K and 0.5 Fib with a gradual squeeze towards support, the chances of a breakdown and a premature fall will increase.
Support levels: 116370, 115860
Resistance levels: 119650, 120100
Technically, the market needs a breather or correction, which is generally a sign of health. The nuance with Bitcoin is that below 115860 there is no support until 112K, and if the market breaks the current consolidation boundary, the further correction could be quite deep. In the current situation, I do not yet see any drivers or reasons for another rally.
Best regards, R. Linda!

USDJPY → Hunting for liquidity before the fallFX:USDJPY is changing its local trend and succumbing to global pressure. The market is seeing a change in price movement following the decline in the dollar index...
The trend has broken and the price movement has turned bearish. The fall in the dollar index is allowing the Japanese yen to strengthen, which is generally negative for the currency pair. The decline may continue after a slight correction.
Fundamentally, the dollar is correcting amid uncertainty due to the tariff war, as well as expectations of interest rate cuts.
Resistance levels: 147.20, 147.89
Support levels: 145.85, 145.23
As part of the correction, the price may test the liquidity zone of 147.7 or 0.7f. A false breakout and consolidation of the price in the selling zone may trigger a further decline in both the short and medium term.
Best regards, R. Linda!

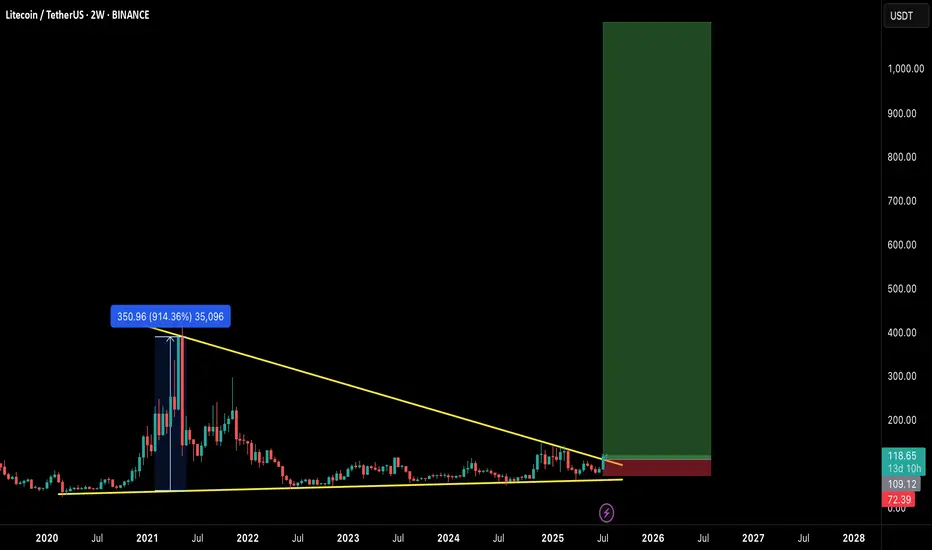
$LTC READY FOR EXPLOSION! THE COMEBACK OF THE OG?Litecoin has quietly formed one of the most massive macro structures in the market — a multi-year falling wedge on the 2-week timeframe, now breaking out with early confirmation.
This could be the start of a generational move, similar to the 2020 breakout. Let's break it down:
🧠 Technical Breakdown:
✅ Falling wedge forming since 2021 — 4 years of compression
✅ Volume and structure support breakout
✅ LTC already gave a 914% rally last time it broke a similar level
📏 Target zone extends above $900–$1000
🛒 Entry Zone:
Current Price: $118
🟢 Buy on breakout or dips near $105–$110 for safer entries
🎯 Target Zones:
TP1: $280
TP2: $400
TP3: $650
TP4: $950+
🛑 Stop-loss:
Breakdown below $72 (last higher low & wedge base)
⚖️ Risk-to-Reward:
High timeframe structure = High conviction play.
Potential R:R > 8x — Rare macro opportunities like this don’t come often.
🧩 Final Thoughts:
LTC may not be the flashiest alt anymore, but this setup is technically undeniable. If BTC enters full bull cycle, LTC could ride the wave explosively.
🔥 This could be a "buy and forget" macro play for 6–12 months.
💬 Let me know your thoughts in the comments & hit that ❤️ if you like macro setups like these!
NZDCHF → Pre-breakdown consolidation on a downtrendFX:NZDCHF is forming a pre-breakout consolidation amid a downtrend. Focus on support at 0.4759. Global and local trends are down...
On July 10-11, the currency pair attempted to break out of the trend. In the chart, it looks like a resistance breakout, but technically it was a short squeeze aimed at accumulating liquidity before the fall. We can see that the price quickly returned back and the market is testing the low from which the trap formation began. The risk zone for the market is 0.4759 - 0.475. In simple terms, this is a bull trap against the backdrop of a downtrend. The NZD has passed through the risk zone. At this time, the currency pair is forming a pre-breakout consolidation relative to the support level of 0.4759 with the aim of continuing its decline.
Support levels: 0.4759, 0.4753
Resistance levels: 0.477, 0.4782
A breakout of the 0.4759 level and consolidation in the sell zone could trigger a continuation of the decline within the main and local trends.
Best regards, R. Linda!

GBPCAD bearish for expect
OANDA:GBPCAD last 4 ideas on this pair attached, we are have one strong fall, price is make few pushes on sup zone (violet doted), which taking for legal zone, currently price in ASCENDING TRIANGL better visible on 15TF (will make in note), expecting break of same and higher bearish continuation.
SUP zone: 1.85750
RES zone: 1.84500

EURAUD higher bearish for expect
OANDA:EURAUD bullish trend nearly last two months.
Good structure visible, we have breaked trend line, sup zone (1.79100) breaked and DESCENDINGING TRIANGL is breaked, we are have and RBA and RBNZ in last days.
EUR looks like is start losing power and like cant more pushing, from here expectations are for more bearish.
SUP zone: 1.79500
RES zone: 177500, 177000

SOLANA → Pre-breakdown consolidation may lead to distributionBINANCE:SOLUSDT is declining and testing the support of the trading range as Bitcoin pauses after strong growth and enters a correction phase...
SOL looks a bit weaker than Bitcoin technically, but SOLANA has some positive fundamentals, though that might not be enough.
After forming a false breakout of key daily resistance, Bitcoin is moving into a correction phase. An update of local lows on the chart could trigger a drop across the entire cryptocurrency market.
In SOL, the focus is on the two nearest levels of 148.75 and 145.64. A breakdown of support could trigger the distribution of accumulated energy within the specified range as part of a downward momentum.
Resistance levels: 148.75, 151.2, 153.88
Support levels: 145.64, 138.59
The ideal scenario would be a false breakout of 148.75 (liquidity capture) and a retest of 145.64, followed by a break of support. Consolidation below 145.65 could trigger a drop to the zone of interest at 138.59.
Best regards, R. Linda!

DOGE Ready for PUMP or what ?The price is within a descending triangle, which is discouraging, but this market often behaves contrary to these patterns, and it could be the start of a new price increase. I won’t fall for these patterns anymore.
Best regards CobraVanguard.💚

AUDCHF AUDCHF is preparing to break through support and fallWeak market structure. Gradually declining lows and no reaction to support at 0.5211. Buyers are trying to keep the price above 0.5211, but under market pressure their strength is weakening.
Relative to 0.5211, we see the formation of consolidation, which is of a “pre-breakdown” nature.
Accordingly, a break below the 0.5211 support level could trigger the activation of buyers' SL orders, leading to liquidation and a downward price distribution.
Potential targets include 0.518 and 0.5164.

GOLD → Recovery and retest of resistance. DowntrendFX:XAUUSD has been recovering since the start of the session thanks to a weak dollar, but further growth is uncertain. However, the price is still below the key range and important levels.
At the beginning of the week, gold rebounded from monthly lows amid a weakening US dollar, which remains under pressure due to trade disputes with Japan, uncertainty surrounding the budget, and expectations of a Fed rate cut in September.
However, the technical picture for gold remains bearish, and further dynamics will depend on new statements from Fed officials, labor market data, and Jerome Powell's speech on Tuesday.
Technically, after breaking through the global range support, the price is forming a correction and testing 3294. Before a possible rise to 3320 or to the 0.7 Fibonacci zone, a correction to 3271 may form, which will determine the further development of the situation.
Support levels: 3271, 3255, 3245
Resistance levels: 3294, 3320, 3347
A retest of 3295 (0.5) Fibonacci is forming. There is a possibility of a false breakout with a possible correction. If, during the correction, buyers keep the price above 3271 and return to retest 3294, we will have a chance to attempt growth to 3320 - 3347
Best regards, R. Linda!

Short + Medium Term. Trader + InvestorSunpharma Fut broke above descending triangle pattern on daily/hourly charts with decent OI & other indicators also suggesting BUY.
Risk:Reward very much in favour of bulls.
Trader's stoploss 1675 & targe 1750
Investor's stoploss 1650 target 1850
Time: 20-40 trading sessions

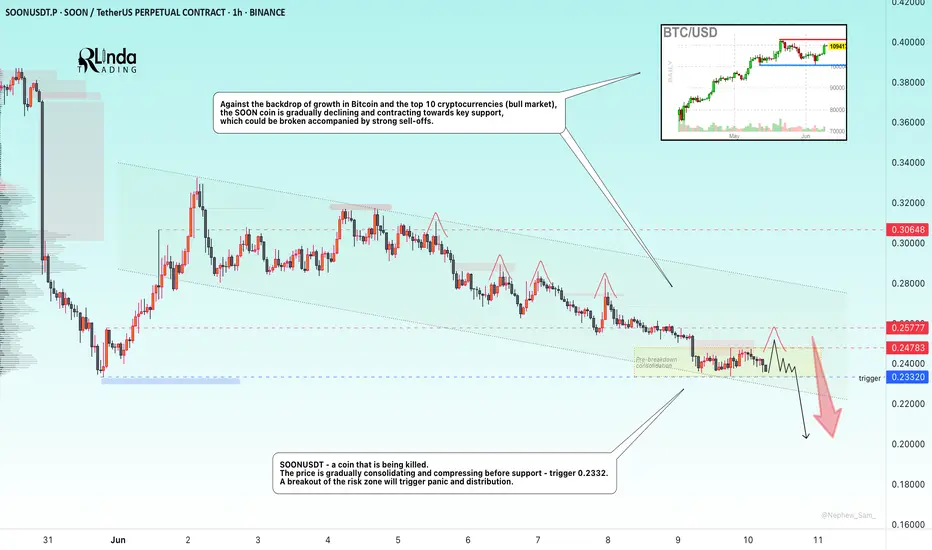
SOONUSDT → The coin that gets killed...BINANCE:SOONUSDT.P is under pressure. The coin looks extremely weak against the backdrop of a bullish market, with key support ahead, separating traders from the panic zone and a sharp decline
This coin is being killed. The price is gradually consolidating and compressing before support - the trigger is 0.2332. Against the backdrop of the overall decline that the market has experienced after a slight impulse from 0.2332, shocks are forming with the aim of capturing liquidity (red check marks). This generally indicates that large players are gathering a bearish position. A breakout of the risk zone will trigger panic and distribution.
Against the backdrop of growth in Bitcoin and the top 10 cryptocurrencies (bull market), the SOON coin is gradually declining and contracting towards key support, which could be broken accompanied by strong sell-offs.
Resistance levels: 0.2478, 0.25777
Support levels: 0.2332
If the coin continues to contract towards the 0.2332 support and form a pre-breakdown consolidation, there will be little chance of survival. In the short and medium term, I expect prices to fall.
Best regards, R. Linda!
ETHUSD selling momentum head and shoulder 📉 ETH/USD Technical Breakdown Alert 📉
🚨 Pattern Formation: Head & Shoulders + Descending Triangle 🚨
On the 4H time frame, ETH/USD has confirmed a Head and Shoulders pattern, with a strong descending triangle breakdown from the neckline at $2,450.
🔻 Bearish Momentum Building
The market structure is signaling further downside pressure. A clean break below the neckline has triggered a strong sell signal.
🎯 Technical Target
1st Support Zone: $1,765
(Watch this level for potential bounce or further continuation)
💡 This setup aligns with classic bearish continuation patterns — risk management is key as always.
📊 Stay sharp, trade smart.
👉 Like, Follow, Comment & Join our community for more real-time updates and technical setups.
— Livia 😜

EURUSD Bullish trend breakdown ahead selling possible shortEUR/USD Technical Breakdown 🚨
The bullish trendline has been broken, along with the descending triangle support — signaling a potential shift in momentum. 📉
🔍 Entry Level: 1.14800 (Previous Resistance)
🎯 Target Zones: 1️⃣ 1.14300 – Key Demand Zone
2️⃣ 1.14000 – Next Demand Area
3️⃣ 1.13800 – Bullish Order Block (OB)
📊 Timeframe: 1H
We're watching price action closely as it approaches these zones — expect reactions! ⚠️
💬 Drop your thoughts in the

GOLD → Bear pressure. Area of interest: 3340–3306FX:XAUUSD continues to decline under pressure from sell-offs. However, the situation is interesting overall, as there is conflicting data and unexpected price behavior is surprising the market...
On Tuesday, gold is trying to regain the $3,400 level after pulling back from highs, but it is still facing selling pressure and returning to $3,377. The market reaction to the $3,377 level is quite weak, and if the price starts to stick to support, this will lead to a further decline. The dollar is strengthening as a safe-haven currency, holding back gold's growth. The markets are focused on the outcome of the Fed and Bank of Japan meetings, as well as US retail sales data. Any dovish signals from the Fed could support gold and weaken the dollar.
Technically, on D1, gold is returning below the 3382 level (selling zone) and testing 3377. The reaction to the false breakout of support is weak, and the price is forming a pre-breakdown consolidation relative to 3377. There are clear areas of interest that could lure the price before the news. For example, 3343, 3306, 3245.
Resistance levels: 3382, 3403.
Support levels: 3377, 3339, 3320
The bearish structure will be broken if the price strengthens to 3403 and consolidates above that level. This will reinforce buyers' expectations, which could lead to growth. At the moment, I would expect two scenarios: price consolidation within 3377-3403. But technically, the chart shows that there is bearish pressure in the market. The price continues to storm the support level of 3377, which may not hold up against another retest. A break 3377 could lead to a fall to the areas of interest at 3339-3306.
Best regards, R. Linda!

INDUSTOWER at Best Support Zone !!This is the 4 hour chart of INDUSTOWER .
INDUSTOWER having good Law of Polarity at 360-370 range.
The stock is forming a Descending Triangle pattern on th L.O.P at 375 range .
If this level is sustain , then we may see higher prices in INDUSTOWER.
Thank You !!

BTC: Decision Time Ahead! A Quick Update!!Hey Traders!
If you’re finding value in this analysis, smash that 👍 and hit Follow for high-accuracy trade setups that actually deliver!
Bitcoin is once again testing the descending trendline resistance on the 4H chart.
We're currently at a make-or-break level:
A clear breakout above the trendline could trigger a bullish move toward $110K+
A rejection here might push BTC back to the $100K–$98K support zone
📍The green zone remains key — last time, it held as strong support.
But without a breakout above $106.5K, bulls are on the defensive.
Watch price action closely here — the next big move could start from this very point.
What’s your take? Bullish breakout or another dump loading?

NZDJPY → Pre-breakdown consolidation. Readiness for a declineFX:NZDJPY is under pressure from a global downtrend. Locally, a flat (range) and pre-breakdown consolidation relative to support are forming on the chart...
After a false breakdown of support on May 16, the price failed to reverse and grow. Instead, the currency pair entered a consolidation phase, during which it continues to test support. Each subsequent retest of 85.25-85.30 only increases the chances of a breakout with the aim of continuing the decline. Another important nuance is the elimination (short squeeze) of local resistance at 85.95.
Pressure on the price is also being exerted by the falling dollar index, which is strengthening the Japanese yen, which is generally reflected in the price of NZDJPY...
Support levels: 85.300, 85.25, 84.195
Resistance levels: 85.7, 85.95
The continuation of the current consolidation and the compression of the price towards support only increases the chances of a breakdown of the 85.30 support level. A break and consolidation of the price below 85.25 could trigger a further decline.
Best regards, R. Linda!

NZDJPY will continue to fall after false breakout NZDJPY is correcting after the support breakout. The purpose of such correction is to provoke bullish liquidity before the fall. There is a magnet on the market - liquidity in the zone 85.08 - 85.27. False breakout will return the market to the downward phase
Scenario: growth to local resistance, retest of the zone 85.08 - 85.27, false breakout, consolidation below 85.08 and continuation of the fall. Target - support and order-block 84.2

EURGBP new fall expecting
OANDA:EURGBP whats next, we are have break of DESCENDING TRIANGL, then its be created DESCENDING CHANNEL, which also is be breaked, now we have breaked and trend line.
Price currently is in zone. Expectations are to see break of zone and higher bearish fall.
SUP zone: 0.84600
RES zone: 0.83500, 0.83200

BTC/USD - Bull Market/Bear Market CycleApart from a few deviations, BTC/USD is still following its 731/730 day Bull Market/Bear Market Cycle.
After the next 6 Month Candle which starts July 2025, we may see an even crazier new ATH or we may start early into the inevitable 1 1/2 to 2 year downtrend before the next major BTC Bull-run, which according to this chart, should start around July 2027.
Be on the lookout for a new Descending Triangle Pattern on this one Month chart, this normally leads to a 48% breakdown drop from the bottom of the Descending Triangle Pattern as can be seen previously on this chart.
The 6 Month Chart:
