NZDUSD DESCENDING TRIANGLE NSDUSD is trading a descending triangle near the BREAKOUT: 0.60479.
Targets:
38%: 0.60147
62%: 0.59980
79%: 0.59868
Descending Triangle

Ford Motor Company (F) - Multi Pattern AnalysisCompany: Ford Motor Company
Ticker: F
Exchange: NYSE
Sector: Consumer Discretionary
Introduction:
Today's technical analysis takes a look at Ford Motor Company (F), a prominent player in the Consumer Discretionary sector, listed on the NYSE. A complex formation is unfolding on the weekly chart where a long-term Head and Shoulders pattern encounters a shorter-term Descending Triangle. This unusual setup, featuring a recent breakaway gap, may suggest a bullish trend reversal.
Head and Shoulders & Descending Triangle Pattern:
A Head and Shoulders pattern typically signals a trend reversal from bullish to bearish, while a Descending Triangle is usually seen as a bearish continuation pattern. However, in this unique scenario, the right shoulder of the Head and Shoulders pattern, which is longer than the left, has morphed into a Descending Triangle, creating a complex setup.
Analysis:
Ford's chart shows a clear Head and Shoulders pattern, with the Descending Triangle making up the right shoulder. The triangle has five touch points on the upper boundary and three on the lower. The support of the descending triangle coincides with the support of the head and shoulders.
We've noticed a breakaway gap which indicates a bullish breakout from the descending triangle. Currently, the price appears to be attempting a break above the 200 EMA. If we witness a weekly candlestick close above the 200 EMA, we could interpret this as a transition into a bullish environment, presenting a potential long position entry.
The price target is set at $18.65, representing an approximately 49% rise from the breakout level. Notably, a minor resistance might be encountered at $16.69. A breakout above this level could also signify a failure of the Head and Shoulders pattern, warranting a recalculation of the price target.
Conclusion:
Ford's weekly chart offers an intriguing setup for classical price pattern traders. The unusual combination of a Head and Shoulders pattern and a Descending Triangle, alongside a recent breakaway gap, might indicate a potential bullish reversal.
This analysis should form part of a comprehensive market research and risk management strategy. Please remember, this is not financial advice, and investing always involves risk.
If you found this analysis helpful, please consider liking, sharing, and following for more insights. Wishing you profitable trading!
Best regards,
Karim Subhieh

XLMUSD 🔥 Breakout or Breakdown 🔥After hitting supply zone around 0.11 - 0.10 it started to decline up to the point that we are currently at a demand zone. From this zone I think 3 things could happen:
We get a bounce off this level to continue the descending triangle pattern up until TARGET: 0.09 and then it could actually breakout from the entire triangle instead of declining again but we'll have to see how price reacts once it hits the triangle resistance.
Price breaks down then the next target would the nearest demand zone at around: 0.07 - 0.08 so we'll see how this plays out.
As always, manage risk accordingly. Never risk entire portfolio and study by yourself before you commit to an investment.
Regards,
Kina 🔥

Bitcoin - Plan for the next week (this is going to happen)
Bitcoin is bearish, and the next support is around 25k, which is a strong horizontal line from August 2022 to February 2023. I expect a small bounce from this zone, and we should see bullish price action back to 27k.
Precisely, 25224 is the 0.618 FIB extension support on the LOG scale, and previous wave 1 resistances are 26942 and 27235.
It's the gameplay for the next week or two, and this is what I am expecting from Bitcoin. This time this is a short-term analysis, as I do analyses on Bitcoin on all timeframes.
We can clearly see that the price action on Bitcoin is pretty choppy, and I expect this to continue. Of course, a big red dildo is possible, but in my opinion, a green one is not. I am bearish, and I expect 15k this year.
This analysis is not a trade setup; there is no stop-loss, entry point, profit target, expected duration of the trade, risk-to-reward ratio, or timing. I post trade setups privately.
From the Elliott Wave perspective, I am missing a final wave (5) to complete wave 3 of the higher degree. This is, of course, a bearish version of my Elliott Wave count.
There are tons of opportunities on altcoins, so I trade mainly them. For example, ARPA is a good coin to trade on an intraday or swing basis because the volatility is pretty huge, and volatility = opportunity.
After Bitcoin reaches 25224, which will be hit sooner or later, I expect a pullback to 26942 - 27325.
The next FOMC meeting is on Wed, Jun 14 where will be released a decision for the interest rates in the USA. Big volatility is ahead.
Thank you, and for more ideas, hit "Like" and "Follow"!

ATOMUSD DESCENDING TRIANGLE On the chart we can see a descending triangle pattern.
We expect that the price will increase and break out of the pattern.
Enter the long position only when the price breaks out of the pattern.
Target is shown on the chart.

Trade Setup for 19 May 2023This will be my pre-market analysis of nifty for 19-may-2023:
Today bears took hold of price and moved price down to 18120 level. On 15 min and 45 min chart from price action we can see Head & Shoulders pattern and if this pattern succeed then it nifty may fall to 18000 level. My view is bearish but patterns can fail so will trade according to price action on tomorrow. Following will be my trade setup.
With Head & Shoulder pattern there descending triangle pattern on 15 min TF
1. If market opens flat and break the triangle on upside after retest of descending trend line i will look for buying opportunity for the targets of 18200, 18250 and 18270.
2. if market gap down then will look for nearby support from levels 18100 or 18000 .
3. if market opens gap up i will look for rejections as nifty have lot of hurdles on upside and it's still sell on rise.
This will be my setup for tomorrow. This is not an advice of any kind. Always follow your own setups and learn from mistakes.
I started publishing these setups as my lack many things like keeping trading journal and i hope with this i can get better.

BTC unbeatable bullish chart patterns Hi dear community members and my loyal followers. I hope you are fine.
I would like to bring your attention to this macro analysis with innumerable and beautiful bullish chart patterns.
As you remember 6-8 months ago when BTC bottomed at 17.5K/a real bottom/ in June 2022 and 15.5K/spring/ in November 2022 with double bottom I publish a lot analyses and told you BTC bottomed and we are going to 28-30K.
Back that time I published weekly Megaphone bullish chart pattern with 85K target/link below this analyis/, also I posted weekly falling wedge chart pattern with targets as well. Today I want to add 3 more chart patterns to those 2. BTC fromed daily bullish megaphone chart pattern, Inverse Head and shoulder chart pattern and reverse descending chart pattern.
I'm bullish on BTC in 2023-2024 and expect min 48-52K in 2023 maybe 60-62K.
BTW if you check all my previous analyses you we'll see how I nailed all major moves from 15.5K till now.
If you ckeck my previous analyses you will understand besides these chart patterns what are other factors that make me think so and stay bullish. For short term as I posted in my previous analyses I don't expect BTC to drop below 25K, that is my worst case scenario, I even think BTC bottomed at 26.6K maybe could drop to 26K with wick taking out liquidity below 26.5K.
I expect BTC to pump to 35-37K zone and fill weekly FVG.
Below this analysis I will post targets for the above mentioned chart patterns.
If you like my analyses don't forget to like, retweet, comment, follow me for further updates.
I will appreciate any single like, comment and follow. Have a good day, I wish you good trades and huge profits.

ATOM BEARISH IF BREAKS DAILY SUPPORTATOM/USDT on 1D is testing the support zone of descending triangle.
BEARISH IF WE BREAK BELOW THE ONE.

BIG FOOT TRIANGLEafter a bearish break of my symmetrical triangle BTTC has form a big foot descending triangle to indicate a buy zone, we wait for the breakout of the triangle...but this the time to BUY and HODL

USDT Dominance analysisAt the moment, USDT.D seems to be trapped within a descending triangle. The value of USDT Dominance seems to be consolidating. We seemed to have rejected the resistance of the consolidation. The current value is a strong weekly level of support. If price breaks above this descending triangle then we can see shorts being built.

AUDCHF - NEW BREAKOUT !HELLO TRADERS !
On The Daily Time Frame The AUDCHF Price Reached a Support Level !
Currently, The Support Level is Broken and becomes a New Resistance Level 🔥
The Price Formed a Descending Triangle Pattern !
so, I Expect a Bearish Move 📉
i'm waiting for a retest...
-----------
TARGET: 0.58800🎯
___________
if you agreed with this IDEA, please leave a LIKE, SUBSCRIBE or COMMENT!

TSLA: Trading at a Critical Support Line.• TSLA crashed after earnings, but it seems it wants to stabilize around the 163 support line;
• So far, TSLA has been moving with technical precision, as we already discussed this bearish scenario in our previous analysis (link below this post, as usual);
• Now, in the daily chart, TSLA just hit its technical support at 163. So far, there’s no bullish reaction indicating that it is doing a bottom sign – but this could change very soon;
• If TSLA loses the 163, then it’ll probably try to fill the gap at 146 in sequence.
• In the weekly chart, the situation is critical, as TSLA is on the verge of triggering a Descending Triangle chart pattern downwards;
• What’s more, the last two candlesticks hit the 21 ema as a resistance as well. This reinforces our idea that it could hit 146;
• In order to avoid this bearish scenario, TSLA would need to react as soon as possible, and trigger an extremely powerful bullish reversal pattern – so far, there’s no such sign;
• I’ll keep you guys updated on this, as usual.
I’ll keep you updated on this. Remember to follow me to keep in touch with my daily analysis.

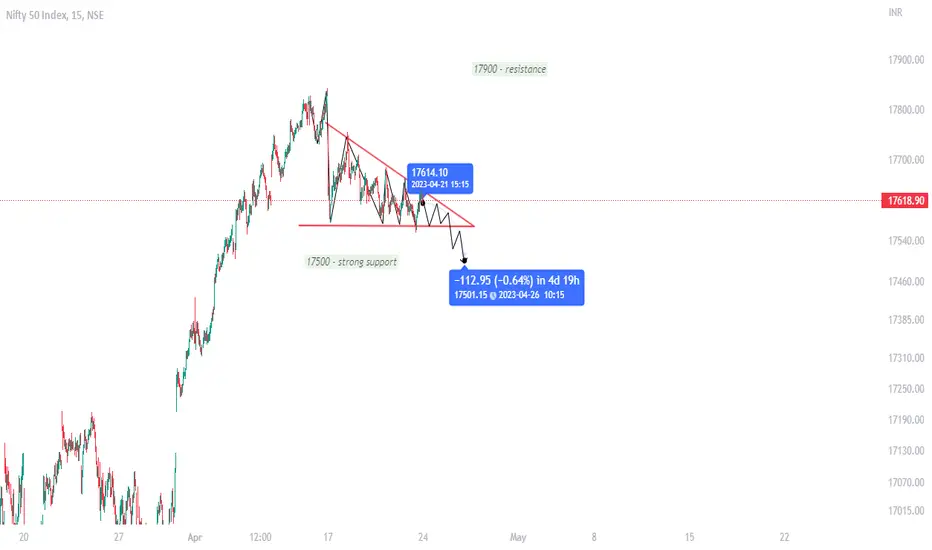
Chart pattern IdentificationShort position as per descending triangle, bearish move on Nifty 50, short target of 17500. waiting for breakout.
PERLUSDT Potential 64% swing upwardPotential breakout from point E of this descending triangle. PERLUSDT can growth easily more of 64% by the week, but a first swing in a break-out wave can be expected to start tomorrow. This impulsive projected from an ABCDE triangle can rise wild after the actual D-E decrease. The Fibonacci retracement is beautifully confluent in 14.6% key level with trend-line.

Mini Altseason2023 has started)). Hi dear community and my loyal followers.
Are you waiting for your altcoins to burst and explode?
Do you want to know when mini altseason2023 starts?
Let me update some ideas. As you see BTCD reached to the key weekly resistance zone 48.5-49% and rejected strongly with potential weekly shooting start or bearish pinbar.
At the same time daily BTCD broke down rising wedge with bearish divergence and more likely will retest 44-45K support zone giving room altcoins to explode after long term accumulation phase.
At the same time Total 2 broke weekly descending triangle, retested it successfully, and broke also main diagonal and horizontal resistance.
Weekly candle close above 620 billion is super bullish for altcoins with target 1 and target 2 mentioned on the charts. But Target 2 will be reached only if price clears target 1 and holds it as a support.
If you like my ideas and analyses, don't forget to like and follow. I will appreciate a lot.

USDCHF - NEW BREAKOUT !HELLO TRADERS !
On The Daily Time Frame The USDCHF Price Reached a Support Level !
Currently, The Support Level is Broken and becomes a New Resistance Level 🔥
The Price Formed a Descending Triangle Pattern !
so, I Expect a Bearish Move 📉
i'm waiting for a retest...
-----------
TARGET: 0.88650🎯
___________
if you agreed with this IDEA, please leave a LIKE, SUBSCRIBE or COMMENT!

bitcoin local targets to $27,510 short scalp (#nfa)bitcoin local targets to $27,510 short scalp (#nfa)
broken from descending triangle, I see targets to about 27,510 for a scalp short.

HOOK/USDT TRADE SETUP! LOW RISK, HIGH REWARD!!Hello everyone, if you like the idea, do not forget to support it with a like and follow.
Welcome to this HOOK/USDT trade setup.
HOOK looks good here. Forming a descending triangle in a 4hr time frame and currently bouncing from the lower trendline of the triangle. Open a long position here and add more in the dip.
Entry range:- $1.68-$1.74
Target1:- $1.84
Target2:- $2.02
Target3:- $2.20
Target4:- $2.35
SL;- $2.64
Leverage:- 5x-10x
If you like this idea then do support it with like and follow.
Also, share your views in the comment section.
Thank You!

Bitcoin to 1 USD - Whales plan revealed! it's over! (99% CRASH)
It's over for Bitcoin because the whales started to manipulate the price. But fortunately, I know their plan, which is why I have to share it with you as soon as possible!
First of all, whales. They want as low a price as possible because why should they buy at the current expensive price when they can send Bitcoin back and buy it cheaper?
This is an analysis of the monthly chart with full history. We need to take the FIB retracement for the whole uptrend and look for the 0.618 value. Whales love to buy Bitcoin at the 0.618 FIB retracement, and in this case, it's 0.80 USDT.
FAIR VALUE GAP BETWEEN 0.97 - 1.99 USDT (UNFILLED GAP) is another confluence why we should go down. All gaps tend to be filled sooner or later.
The impulse wave from 2009 to 2021 has finished, and we are looking for an ABC correction. No doubt about it at all.
The MACD indicator is absolutely terrible. We can see that the histogram was at the lowest level in history, this is not good.
What's more, if we take a look at the volume indicator, we can see absolutely low volume. The whales are not buying at all.
The whales will send Bitcoin temporarily to zero until there are no orders in the orderbook from retail traders. (It happened with OIL before, so why not?)
I hope you like this secret gameplan from whales; do not tell anyone, because it should be only for my followers.
Today is April 1, so happy Easter and April Fools' Day! If you think this analysis is for real, then you have been pranked!
Thank you, and for more ideas, hit "Like" and "Follow"!

USDCAD : Possible Pull back from major support levelOANDA:USDCAD
Hi trader's .. Market breakout downside from descending Triangle
Market reached major support level , as market now in over sold area
so possible pull back from support level expected
Price Can make double bottom at 1.3556 area and from there buyer's can push market toward's 1.3645 area

Bitcoin - Bullish Falling Wedge #Bitcoin 4hr #TA at #KuCoin
At Present #BTC moves as per #Bullish #FallingWedge Pattern to complete it's cycle around 31st March to 3rd April, if it follows pattern properly, then next target is going towards $30k, but if any news arrives in market then signals will be change fast as per market panic #FUD.

EURGBP Bearish Continuetion-EUR vs GBP
-Bearish Continuation
-Descending Triangle
-No divergence
-Short Position
-Risk/Reward - 1%

Almost Boom Time!Over 2 years to form this bullish descending wedge! I don't know which moon we're aiming for but I don't think it's in this galaxy!
