Bearish Descending TriangleLooks like we could have a possible breakout to the downside! Let's see where this goes!
Descending Triangle

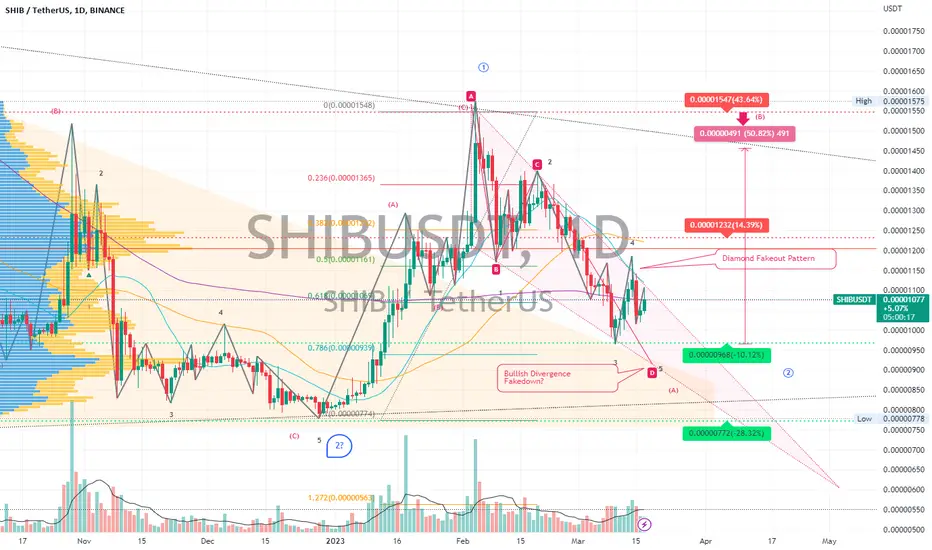
SHIBUSDT | Wave Analysis | Bull Wedge Diamond Breakout Position?Wave Analysis combined with price action and chart pattern trading:
> A potential minor 1-wave descending triangle breakout scenario with ABC falling wedge retraced 0.786 fibonacci level
> After recent uptrend diamond breakout above SMA200, now assuming a possible upcoming bullish divergence FAKE BREAKDOWN minor 5-wave to complete the reversal pattern for downtrend A wave correction.
> If breakout +50% upside falling wedge target at downtrend triangle resistance.
> 2nd fakeout is always the 4 - wave correction position
> Long Entry after bullish divergence confirmation at the Wedge
Always trade with affordable risk and respect your stoploss,
Good Luck
Bitcoin at Descending Channal Pattern#Bitcoin 1 hr. #TA at #Binance
At Present #BTC moves hourly on #Descending #ChannelPattern and as per that, it's next Downtrend Divergence break out point will be create upto next 48 hrs...
Just be Ready for next Break Out Soon...

BTC: BOUNCE OR MORE DUMP??Hello everyone, if you like the idea, do not forget to support it with a like and follow.
Welcome to this BTC update. If you are following me and reading my updates then definitely you are safe. In my previous BTC update, I clearly told you that BTC is not looking good, forming a bear flag pattern and we see a dump soon.
Currently, BTC is trading around the $21.7k level so what's the next possible scenario from here? Let's discuss this.
According to this 8hr chart, BTC is forming a descending triangle in 8hr time frame and currently hovering at the lower trendline of the triangle which is our last hope of any bounce. If BTC held this support and bounce from here then we see a pump up to the $22.5k level but for more bounce, BTC needs to break out from the triangle and close above the resistance line.
And according to the second scenario which is highly likely, once BTC breaks down the triangle and close below the $21.5k level then be ready for the $18k-$18.5k level.
IMO you should be ready to short any bounce from here with an invalidation of close above $22.5k
What do you think about this?
Do you think we might see a bounce from here or do you think that $18k is on the board?
Share your views in the comment section.
If you like this idea then do support it with like and follow.
Thank You!

hisand33 - triangle formingHisand33 is one of the amazing movers in recent times, so we assumed it could do it again... Started moving. Details on the chart
Good luck traders


📉 4 Common Bearish PatternsIn trading, a bearish pattern is a technical chart pattern that indicates a potential trend reversal from an uptrend to a downtrend. These patterns are characterized by a series of price movements that signal a bearish sentiment among traders.
📍Bear Flag
🔸 A small rectangular pattern that slopes against the preceding trend
🔸 Forms after a rapid price decline (flagpole)
🔸 The pattern is completed when the price breaks below the lower trend line of the flag
📍Descending Triangle
🔸 A bearish continuation pattern that forms with a horizontal support line and a descending trendline
🔸 Forms as the price reaches lower highs, while the lows remain at the same level
🔸 The pattern is completed when the price breaks below the horizontal support line
📍Rising Wedge
🔸 A bearish reversal pattern that forms with a series of higher highs and higher lows
🔸 The pattern forms as the price moves up in a narrowing range
🔸 The pattern is completed when the price breaks below the lower trendline
📍Triple Top
🔸 A bearish reversal pattern that forms with three peaks at the same price level
🔸 The pattern forms as the price reaches resistance at the same level multiple times
🔸 The pattern is completed when the price breaks below the support level, which connects the lows between the peaks
👤 @AlgoBuddy
📅 Daily Ideas about market update, psychology & indicators
❤️ If you appreciate our work, please like, comment and follow ❤️

BNB can fall to 240$BNB has created a Descending Triangle which means the price is about to drop pretty soon. no break out has happened yet so there is no confirmation. we shall wait and see what happens. the price will end up around 240$ if our prediction comes true.
_ _ _ _ _ _ _ _ _ _ _ _ _ _ _ _ _ _ _ _ _ _ _ _ _ _ _ _ _ _ _ _ _
🌍Thank you for seeing idea .
Have a nice day and Good luck

USD/CAD: a potential build-up for a 100-pip dropLooking at the 2D timeframe chart of USD/CAD, we may observe that a descending triangle pattern has been formed and that the price has successfully broken the upper boundary (the descending trendline) of it. Using the Fibonacci retracement tool, we might identify that the 38.2% key Fibonacci level nicely lines up with a crucial area of previous resistance that now acts as support that is identified on the graph.
We are expecting for the price to continue its short-term bearish movements and reach the price level highlighted on the graphic. From there, due to the fact that our bias remains bullish, we will possibly look into executing long positions and riding the next up-trending wave.

Following the trend In short, with the knowledge of the bias that follows a descending triangle pattern which requires one to short the market when such a pattern is seen in the chart
In both high and lower time frames, I was able to confirm that the pattern is formed in conjunction with the ATR and MA indicator used as confluence to verify my bias.
Basically, I couldn't obtain such a result without knowing the trend in the market.
In addition, waiting for a retest has always been paramount for me, so if you can notice in the chart there was a retest to the support level marked out which happened to be my entry point

XRP gonna be bearish!Ripple is in a Descending Triangle Pattern which means the price is going to Be a Bit Bearish in the Coming Days! It's Expected that the price would Decrease as much as the measured Price movement (AB=CD) The Expected movement and Support level is shown on the chart.
_ _ _ _ _ _ _ _ _ _ _ _ _ _ _ _ _ _ _ _ _ _ _ _ _ _ _ _ _ _ _ _ _
🌍Thank you for seeing idea .
Have a nice day and Good luck

ETHUSDT - Descending Triangle - Pointing to DownsideFibs drawn from swing high to low, resistance at 0.618. From 0.618 to low next resistance. Again from 0.618 resistance to low until breakdown of descending triangle. Interesting. One to note considering downside.
I am going to stop posting. Trading is to real time.

descending triangleBINANCE:MANAUSDT has formed a descending triangle and now at the support trendline, lets watch out for a breakout or a retest and a rally to the up trendline, find entry at 15min TF .

SOL PERSONAL ANALYSIS IN THE LONG TERM (UPDATED) HELLFIRE!What is up guys? I have been off for a decent while since I have been very busy with life however I am back. Please be reminded that a high probable trade is among us with SOLANA and other assets which will begin to go down this day up to a maximum of 19.6$ with an expected pullback up to 22.2$. As you can see in the chart, the Relative Strength Index has clearly given an image of consistent long-term (daily chart btw) losses of buyer interest which could only mean one thing -- an impending doom of a massive sell.
How does the Relative Strength Index help confirm the foreseen downtrend? It is mainly a tool that shows the strength of a particular movement whether if it may be bearish or bullish. In this scenario, the RSI shows that each pump is considerably weaker in momentum than the previous one and the price action demonstrates no further upside action and is now entering a slow-downtrend or a consolidation period. Buyers are uncertain if they can keep up with the positive sentiment and bears are now preparing their moneybags.
If you have any more questions, please feel free to chat, comment, react and share!
---------------------------------

BNB/USDT ShortFirst of all BNB broke that Descending Triangle and then tested that resistance level 3 times and made a pin candle at resistance/demand zone. The volume is also in the favor of bearish trend.
Entry: 303.1$
SL: 309$
TP1: 300.8$
TP2: 298.1$
TP3: 294.2$
TP4: 292.6$
TP5: 291$
TP6: 284.6$

BTCUSDT - Descending Triangle After loosing a key Weekly on a move to the downside, next question is where to next right? Spent the morning trying to second guess the market and in essence try predict the price. Garbage. Trade the moment and whats in front of you. Knowledge is power.
Well respected in my opinion backed by some decent fibs is a descending triangle. Fibs drawn from highs to lows, where 0.618 resistance levels within the triangle seem to be well respected. The 3rd of which is an estimate.
Breakouts, I suspect are outside the triangle, with each of the previous Fibs at 0.618 acting again as resistance. Target low should the price break down, be the fib extensions 1:1, in red. 1 particular of interest is the nPoc at 22,500.
Note: 4 consecutive days where the price hasnt broken higher then the day (or previous day close). Ill consider bullish momentum should we break above yesterdays close price, especially a closing a day.

TSLA TriangeDescending triangle on TSLA 4H forming. MACD on D rolled over to negative w/ declining RSI. looking for quick end-of-week call credit.
NASDAQ:TSLA

FTMUSDT is testing the new breakout Currently, the price of FTMUSDT is attempting to break out of a descending channel after a clear retest of the 0.5 Fibonacci level.
A descending channel is a technical pattern in which the price of an asset moves downwards between two parallel trend lines. The upper trend line acts as a resistance level, while the lower trend line acts as a support level. The descending channel is a bearish pattern that indicates that the price of the asset is in a downtrend.
In the case of FTMUSDT, the descending channel is a long-term pattern that has been in place for several weeks. The upper trend line has acted as a strong resistance level, with the price repeatedly being rejected at this level. The lower trend line has acted as a support level, with the price bouncing off this level multiple times.
After a clear retest of the 0.5 Fibonacci level, which is a key support level, the price of FTMUSDT is now attempting to break out of the descending channel. A breakout is a technical pattern in which the price of an asset moves above a resistance level, indicating that the bullish momentum has taken over the bearish momentum.
If the price of FTMUSDT is able to break out of the descending channel and create a higher high, this would be a signal to apply Plancton's rules and consider taking a new long position.
–––––
Follow the Shrimp 🦐
Keep in mind.
🟣 Purple structure -> Monthly structure.
🔴 Red structure -> Weekly structure.
🔵 Blue structure -> Daily structure.
🟡 Yellow structure -> 4h structure.
⚫️ Black structure -> <= 1h structure.
Follow the Shrimp 🦐

pattern trading (Descending triangle)Hi! Let me share my first idea!
Acquired when the falling triangle pattern is completed and the support line is retested after the falling triangle is broken.

AUDCAD - New Breakout !The AUDCAD price is in Descending Triangle Pattern🧐
The Resistance Line is broken 🔥
so, i predict a bullish move 📉i'm Waiting for a retest 🧐
...
if you agreed with this IDEA, please leave a LIKE, FOLLOW or COMMENT!

LTC Coiling up for a move. Waiting to break the levelWait for level breaks and retest.
Just for education...

SunPharmaSUNPHARMA broke above descending triangle pattern on 30 min TF with good volumes.
Could be bought with mentioned stoploss & target.

VERTEXCHARTS | EURAUD ANALYSISEURAUD has formed a descending triangle on the daily timeframe.
We expect a breakout for for a continued downtrend move.
Trade only at confirmed setup
