Bitcoin trying to break the descending triangle.
With 3 hours and 20 minutes to go before the daily candle ends,
we have a sell bar right at the resistance point of the descending triangle.
The next bar on the daily if it opens short confirms the failure to break out there we go for the 35 thousand dollars.
On the daily RSI we will reach an oversold area and possible reversal and retest of the breakout of the ascending triangle.
Descending Triangle

ETH USD IS STILL BEARISH - CHANNEL + LEVELSIt does not look good for now. Bulls are not here. The bearish channel seems perfectly clear, and we need to wait to step out to open a LONG position. I prefer to place SHORT positions at the upper side of the descending channel. You can swing a LONG position at the bottom of the channel, but it is risky.

Dogecoin Long (Daily Chart Pattern)Daily Chart
Descending Triangle Pattern:
-First Breakout was on Jan 10th
-Retest of support line was successful ->
(Jan 22nd- Jan 25th)
Multiple levels of resistance must be broken,
First Major Area of Resistance:
- Between $0.198 and $0.275
Next Major Area of Resistance:
- Between $0.35 and $0.43
Strong Support Area (as of Jan 26):
- Between $0.095 and $0.16
Price Target #1: around $0.55
Price Target #2: Between $0.69 and $0.80
Previous All Time High: $0.74

Swipe SXPUSDT - Bearish descending triangle + lower prices!- Swipe looks terrible on the daily / weekly timeframe.
- We have a descending triangle that is currently breaking down.
- I do not see any bullishness on this chart.
- Another 57% DROP is expected, then we can retest the triangle.

AUDCAD Descending Triangle PatternHey Gays, I just saw a bearish descending triangle chart pattern at H4.
Trade at your own RISK. I am not liable for any loss.
Best of luck ;)

Albemarle (ALB) Is Currently At 205; Wait For Retracement At 215Last week I suggested shorting Albemarle (ALB) if it pushed through the many levels of support and closed below 215 in price.
Technical analysis in the form of chart patterns like descending triangles, double tops, multiple downward spikes, an increase in volume on the uptrend, and the Fibonacci retracement along with a close below a long-term upward trendline suggested that it was poised to fall.
We couldn’t for sure confirm that it was in a downtrend because it had not yet been established with the 1-2-3 method.
There was also a large head and shoulders pattern that was not confirmed. However, closing at 211 (price) on the 24th of January confirmed this pattern.
Your profits would have been massive if you had jumped in short 215 as I suggested and placed a tight stop just above one of my resistance levels (between 216 and 219). A bailout when the price reached its floor of 196, anything between 4.5 and a 9 to 1.
Take into consideration that all the confluence pointed to a massive drop, and in these situations, I like to keep my stop-loss tight to maximize profit-taking. It is risky, and there is a chance you may get stopped out, but that occurs with every trade. I was spot on in this scenario, and a 9 to 1 win is a pretty sweet deal.
Now, if you missed the trade and are kicking yourself (and you should be), don’t worry because the retracement is in progress. Using the Fibonacci retracement again, we can see that the 38% level is at 215, exactly right up against all those resistance (former support levels) levels.
It is highly unlikely that Albemarle (ALB) is going to recover from this price drop in the next couple of days.
We can now be on the lookout for a symmetrical triangle (created by the new low at 196) and a possible channel establishing the downtrend further.
If you are brave enough, you can put in a limit at 215 and place your stop-loss at 216. If prices drops to 196, your profits will be 19 to 1. Remember that besides having all the resistance at 215, 215 is a round number where many traders are possibly holding their position. This means that price will most likely find it difficult to move higher.
This also means that the price may not hit 215 because of the number of traders who have shorted there, so it's better to get in at 214.
A healthier (and smarter) trade would be to put your limit in at the Fibonacci retracement level of 38% (price 215) and put your stop-loss above the 50% Fibonacci level (price 221). This will give you ample stoppage room and space for the trade to breathe when it attempts to retrace to its highs.
This will prove difficult because of all the resistance in its way, though. Take into consideration that price may push to the Fibonacci 50% or 62% levels because of the channel forming before the drop continues.

Zilliqa ZILUSDT - Descending triangle + Another 40% drop coming!- On the weekly chart we can spot a descending triangle, the most bearish technical pattern.
- Currently, the triangle is breaking down with strong bullish momentum.
- Another 40% drop is very likely at this moment.
- Next support is bottom of the blue trendline and horizontal line from 2019.

BTC local Short to next minor support level @ 32k areaBTC local Short to next minor support level @ 32k area BTC local Short to next minor support level @ 32k area BTC local Short to next minor support level @ 32k area

Cardano ADAUSDT - Entered bearish territory + Head and Shoulders- Cardano is not looking good at this moment.
- We have the lowest new weekly candle with low at 0.917, which is the lowest value since 22 February 2021.
- Head and Shoulders pattern just broke down with strong momentum!
- Also the impulse Elliott Wave finished with 5 waves successfuly.
- The price is below the main trendline established in March 2020.
- Next support is 0.39 USD, which is another drop about 63%.

ZIL USDT double bottomSimilar to BAT chart I posted recently, but this one didn't break above the resistance trendline yet. Indicators high so watch for pull-back or retest entry. Support is tested more times in the past so we may assume that this will be bottom. (If king do not throw some more s..t at us by dumping more). Set alarms. Good luck traders

A bearish triangle A bearish triangle is formed in a downtrend which was confirmed on higher Timeframes indicating that it's a strng bearish signal for shorting ETCUSDT.
The green marked out lines are my area of target, i'm open to any correction from anyone.
thank you.

Massive Move Incoming for Altcoins!Hello traders,
The Bitcoin Dominance has been on a large downtrend for years and is looking like it will continue. It is currently in a descending pattern (Lower highs and equal lows.) The current dominance comfortably sits at 39.83%, while the target out of this downtrend is 29-30%. This may look bearish for Bitcoin but this may be a sign that Altcoins may surge! 9% loss in Bitcoin Dominance is $180B USD. More currently we have received a weekly close below the important support level, unfortunately, this reveals BTC may go lower possibly dragging down other coins. One last thing, the MACD of the Weekly BTC.D is foreshadowing a divergence to the bearish side.
Safe trading,
-Pulkanator

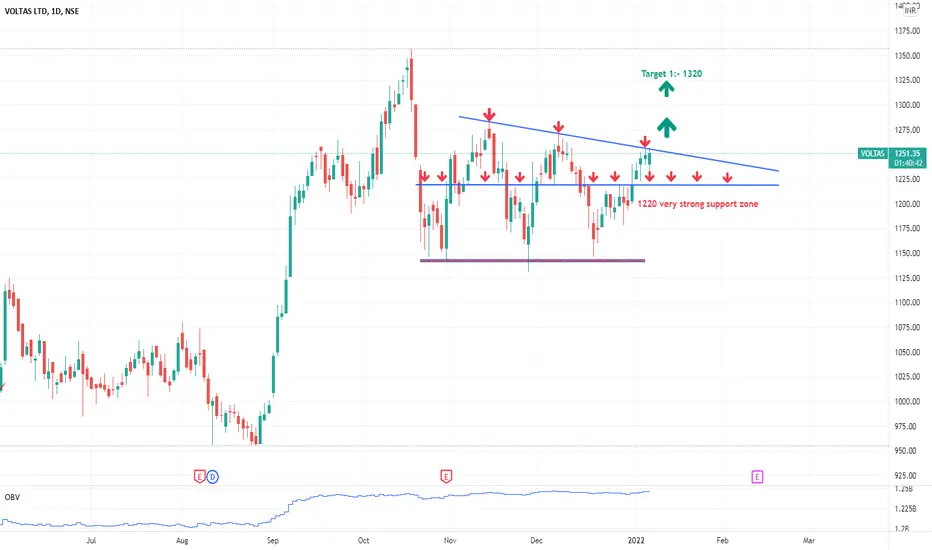
VoltasVoltas about to breakout of descending triangle with decent volumes & on daily charts.
Voltas buy above 1257 with mentioned stop-loss & targets. Not to be missed this breakout.
MKR - Massive triangle and Head & ShoulderThe analysis is showing
A massive descending triangle breakout and retest
Head and Shoulder pattern breakout and retest the neckline
An unused order block around 1400 to 1100
Action Plan
First we ride the short trade to the weekly zone and keep moving the stop loss
We can start long from the order block and go as per take profits given

Elrond EGLDBTC - Huge Falling Wedge + Elliott Wave Diagonal- Elrond - EGLD - Rank #42
- We have a huge falling wedge on the weekly chart which is currently breaking down!
- The Elliott wave completed successfuly with 5 impulse waves (ending diagonal wedge).
- Bearish target is 0.618 FIB or bottom of the wedge!

CRO Crypto.com Coin in a Descending Triangle on the DailyBITTREX:CROBTC is on a descending triangle on the daily taking us down to 700 Satoshi. We haven't broken the triangle downward yet, so the trade is not confirmed. We might still bounce off the top of the triangle in the next two days before breaking it downwards.

Double Sided Play on NIOOn the Daily Chart of NYSE:NIO , we can see that it has been creating lower highs (starting from 11th January 2021 @66.99) and consistent lows in the 31-32.5 region. This is a macro descending triangle formation which indicates a potential bearish trend. However, on the RSI Indicator, we can see that NIO is currently at 30.03, which indicates that it is underbought . Also if we take a look at Nasdaq's Daily Chart NASDAQ:IXIC , we can notice it has been trending upwards in a parallel range and is currently at the bottom support line which indicates upwards movement for the next few weeks.
If NYSE:NIO follows the trend of the entire Nasdaq NASDAQ:IXIC market then it can move upwards significantly but on the other hand there is a chance it behaves in accordance to the descending triangle pattern and plummets.
If watches carefully NYSE:NIO can be played on both sides profitably, I am currently long on NYSE:NIO on a swing trade with a stop loss at 28 and a take profit of 38+ which might change based on price action.

doge is ready to fly !!!Hello dear friends,in the weekly time frame, a large descending triangle can be seen in the dogecoin chart and i published this chart 25 days ago .Big descending triangle for dogecoin is broken upwards.If the weekly candle above the EMA 21,price growth will accelerate.We have seen bear traps in the last two weeks.
Due to the high mobility of whales and increase in trading volume, as well as the acceptance of doge for the sale of Tesla products,the probability of price increase is high.

Theta THETAUSDT - Bearish descending triangle on the weekly!- Theta was one of the most bullish altcoins in 2020-2021, but now the situation has changed.
- As always i checked all altcoins on Binance and 95% of them are turning bearish, the situation is not looking good.
- The price broke out of the ascending channel on the weekly scale.
- Also we can see a huge descending triangle, which is very close to break down in the near future.

How To Trade The Descending TriangleDraw line touching the lower highs which is the negative slope trend line. Draw horizontal level connecting equal highs. The horizontal level is a zero slope line.
Wait for a convincing close below the horizontal level.
This is a convincing close below the horizontal level. Draw the fib from the previous lower high touching the diagonal trend line. In this case, it is the the third lower high. The result is the 50% Fibonacci Retracement Level overlaps the Horizontal Level a little bit. That overlap is a confluence factor. Now wait for price to pull back to the 50% Retracement Level.
Price pulled back to the 50% Fibonacci Retracement Level, Horizontal Level, EMA 10 Level, and EMA 20 Level.
Set Measured Objective Target Using the Height of the Pattern.
Enter when the bear candles closes near 50% Fibonacci Retracement Level, Horizontal Level, EMA 10 Level, and EMA 20 Level. I would like to see a bearish price action signal at this level like a pin bar, rejection candlestick, or engulfing bar. This candlestick is not a engulfing bar on the 4H time frame, but it is still good enough for me to trade it. Price pulled back to the levels and produced a wick through the horizontal level. Price never closed above the horizontal level. If price closed above the horizontal level, then discard the trade idea.

$BCRX retrospective lookRetrospective look at $BCRX:
1. Gap down to lower low aligning with oversold signal on RSI (Blue Circle).
2. Continued downtrend forming Descending Triangle (Pink Dashed) following hypotenuse resistance line and flat support line.
3. Double bottom then forms (Green Box & Dotted Line and Orange Arrow) within the converging trendlines.
4. Simultaneous bullish signal on the RSI indicator (Blue Dotted Line).
5. Breakout over resistance trendline with large volume (Blue Volume Circle)
6. RR 1.2:1 take profit could have captured initial move (Long position).
Easier to spot now it's happened!
Hope this will add to my (and potentially others) knowledge/experience.
Any comments appreciated
*Not financial advice*

$BEKE Descending TriangleAfternoon all, I'm trying to get into trading and would love some opinions.
I have been looking at the daily chart for $BEKE and believe we could be looking at a descending triangle (in Orange) for a potential short position.
Guess I would be looking for a breakout to the downside, either below the pattern support zone (orange) or potentially the LL (in Pink).
Not sure what take profit target would be or the potential effects of earnings, suppose you would use a risk-reward target?
Reservations on the trade would be the lack of correlation/support from other major indicators such as MACD/RSI/EMA.

The Time Has Come # Bitcoin #Bullishreversal #PatternBitcoin price is forming a right-angled descending broadening wedge at 4h timeframe, a bullish reversal pattern. Wait for the upside breakout and aim at 45k target.
