AUDIO descending channelLooks like AUDIO found a local bottom at 2.318, tested it twice and it bounced up from it. there is more room left in this big descending triangle formed some 10 days ago. The descending channel inside of it will be out of space in 2 days, so AUDIO will either break up or lose that support. MACD looks like it's time for some upside movement. If entering long, watch for confirmation like a break from this descending trendline RSI has formed and increased volume. Set alarms because this could take some time. Good luck traders.
Descending Triangle

Tata motors As you see in the chart
TATA MOTORS was forming a DESCENDING TRIANGLE pattern.
And it got BREAKOUT from the pattern.
So we can expect a GOOD MOVE from here.
TARGETS are given in the chart.

Food for thoughts 01-09Allthough on-chain data gives a way more bullish perspective, the chart looks kinda crappy to me.. We left the bullish trendline a couple of days ago, and with the forming of a descending triangle, I don't like the odds. 43K would be a logical place. But, when everybody screams (up/)down.. Wouldn't be the first time..

ICP descending triangleLooks like ICP broke out from 3 weeks long descending triangle, now between triangle resistance line and resistance level that was rejected from multiple times... Broken from RSI descending trendline, but MACD looks like PA could do some more correction. So it might not push up in immediate short term... Set alarms for this one

Here it is The Blockbuster of crypto universe in these days Now we have a true perspestive of what just actually happend, Cardano now is navigating the success of what actually crypto world must do while the Alonzo upgrade on the way ... but technically in Daily time frame RSI setting up a descending triangle that is obvious we have seroius movement in a week !
so this is just an idea and not financial advise !
cheerrs !

Streamr DATAUSDT - Symmetrical triangle / bull flag +1000%- DATA is currently consolidating in the symmetrical triangle.
- After that, explosive move will folow.
- Bullish volume is higher and RSI is prepared.
- Profit target is 1.618 FIB extension.
- For expected duration of the trade, probability, stop loss, profit target, entry price and risk to reward ratio (RRR) - please check my signature below ↓
- If you want to see more of these ideas, hit "Like" & "Follow"!

$NAKDNice break of descending on the daily chart. We could see a possible continuation run here.
Keep your eyes on this one.

Descending Triangle Patternhe descending triangle pattern is one of the top continuation patterns that appear in the middle of a trend. Traders anticipate the market to continue in the direction of the bigger trend and accordingly develop trading setups.

TKAT breaking triangleThe descending triangle was broken yesterday. It seems the volume could push the price even higher.
I marked the levels where you should watch and may decrease the risk.

ADAUSD Fighting to Break Out-RejectedADA has been in a very tight consolidation pattern and refuses to fall to the 2.4 or even 2.5 levels. And now, it looks like that probably will not happen. Well, at least the 2.4 price point likely won't happen. The reason for this is the 1hr 200MA line is creeping up and is at about 2.5 right now. ADA has been pretty good at staying above or riding the 200MA line. It very rarely seeps below it, and when it does, it's not for very long. If by any chance ADA manages to retest the bottom of the descending triangle, it really won't have very much room to fall. There is a ton of volume for support at 2.5 not to mention the 200MA is at 2.5. If it doesn't test and fall, even better. The slope of the upward trend is something that everyone should also take note of. It is not very steep. What that means for day traders is they likely will not have much action pricewise. The steeper the slope the higher the gains and losses in a short amount of time. The wide base slope has far more support and is like to grow, just a bit more slowly. That tells me people are buying this as a long term investment, and not just ADA, all crypto. However, ADA is outperforming most other coins at the moment in terms of gains over time.
What is also interesting is the fact that on Monday the market cap for ADA was $93,729,022,478 on Tuesday it was $87,464,149,417 and today it is $88,011,861,282. That tells me there was a large money rotation out of crypto on Tuesday. This was most like due to large asset management firms that transitioned a giant chunk of money back into the stock market after the announcement of the US infrastructure deal coming to fruition. What is interesting to note is that today ADA's market cap is still moving forward. Hence the weird patterning and almost constant consolidation.
So what's the point? The bad news is ADA will likely retest the bottom of the descending triangle and the price will likely fall to find support. The good news is, it really cant fall too far. The market cap is increasing, the support volume is large, the 200MA is right below, and people are buying. Interestingly, it looks like they are holding on to it as a future investment. That is great news for ADA.
Now lets talk about why ADA has so much strength. Cardano is about to release smart contract September 12 with the Alonzo release. This addition makes it a viable competitor to ETH as an open source platform. Right now, it is just a glorified ledger. As a person who plans to be a Cadano Developer once Alonzo is released, it makes me wonder how far ADA can go. I have heard people say it cannot go to 100 dollars because it will need around a 3T market cap. But considering in the past 2 weeks ADA has added 31B to its market cap, it's definitely not out of the realm of possibility. Also, considering Grayscale Investments has picked it up, I think it has a LOT more room to grow.
Tell me what you think?
This is not financial advice. DYODD.


Wait for a buy setup at 1795 with XAUUSDH1 time frame.
Structure: Uptrend.
The price broke out of the descending triangle pattern and continued to rise.
The price broke the 1795 resistance zone, now can wait for the price to a retracement to this zone, retest, and appear the Price Action setup to buy with XAUUSD.
The profit target is the old resistance at 1834.
-----------------------------------------------------------------------------------------------
Wish you all have a good trading day!

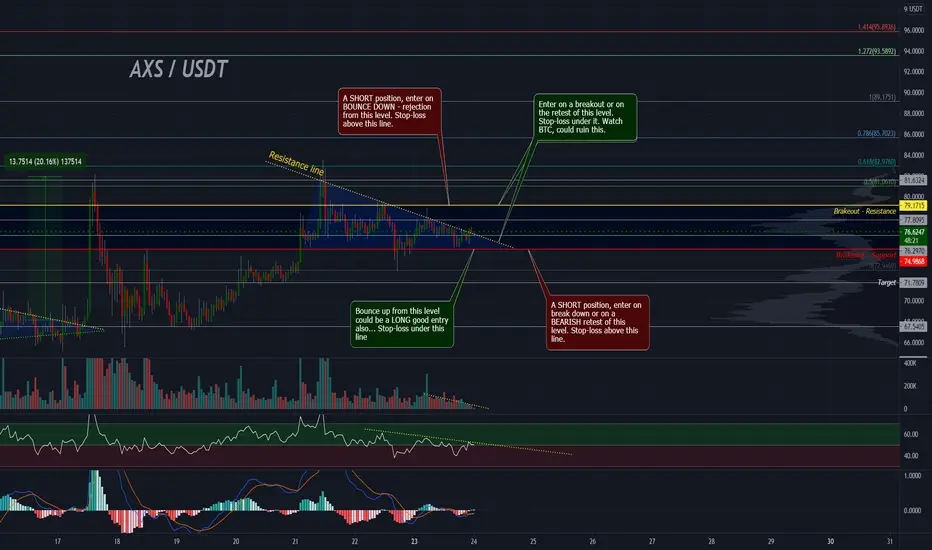
AXS descending triangleAXS could have another move soon, descending triangle, volume decreasing, could this be double bottom formed? I have set my alarms and won't be missing this one...
UniSwap UNIUSD - Road to 350 USD + 1000% gains!- UniSwap looks very strong on the daily timeframe.
- On the chart we can spot an ABCDE triangle, that is currently breaking out!
- Due to my Elliott wave count, i am expecting next Impulse wave to the upside, which will be huge!
- Next profit target is 1:1 FIB trend-based fib extension.
- For expected duration of the trade, probability, stop loss, profit target, entry price and risk to reward ratio ( RRR ) - please check my signature below ↓
- If you want to see more of these ideas, hit "Like" & "Follow"!

Cardano ADAUSD - Road to 30 USD! Elliott Wave + 1000% gains!- Cardano is currently breaking out to new ALL TIME HIGHS!
- On the chart we can spot a Symmetrical triangle - The price is creating higher lows and lower highs.
- Also, the price is above the ALL TIME HIGH level from 2018, which is very bullish.
- We will experience an acceleration to the upside in a few days!
- Profit target is 0.618 FIB extension, which is around 30 USD - 1000%.
- Cardano made a huge rounding bottom or cup and handle on the weekly time frame.
- For expected duration of the trade, probability, stop loss, profit target, entry price and risk to reward ratio ( RRR ) - please check my signature below ↓
- Due to my Elliott wave count, we are currently at the 5th impulse elliott wave!
- If you want to see more of these ideas, hit "Like" & "Follow"!

SelfKey KEYUSDT - Triangle formation +1000% Next Wave!- SelfKey (Rank #536) is breaking out of the triangle formation, which is very bullish.
- Volume is low for now, but i am expecting bulls to step in.
- Bullish volume is higher anyways.
- Next profit target is 1:1 fib extension around 0.1 USD, which is 1000%.
- For expected duration of the trade, probability, stop loss, profit target, entry price and risk to reward ratio (RRR) - please check my signature below ↓
- If you want to see more of these ideas, hit "Like" & "Follow"!

VERTEXCHARTS | EURUSD TRADE IDEAEURSUD on the 4Hr timeframe has broken the descending triangle.
The pair is now falling from the breakout toward 1.6036 support line
Like and Comment to support this idea.

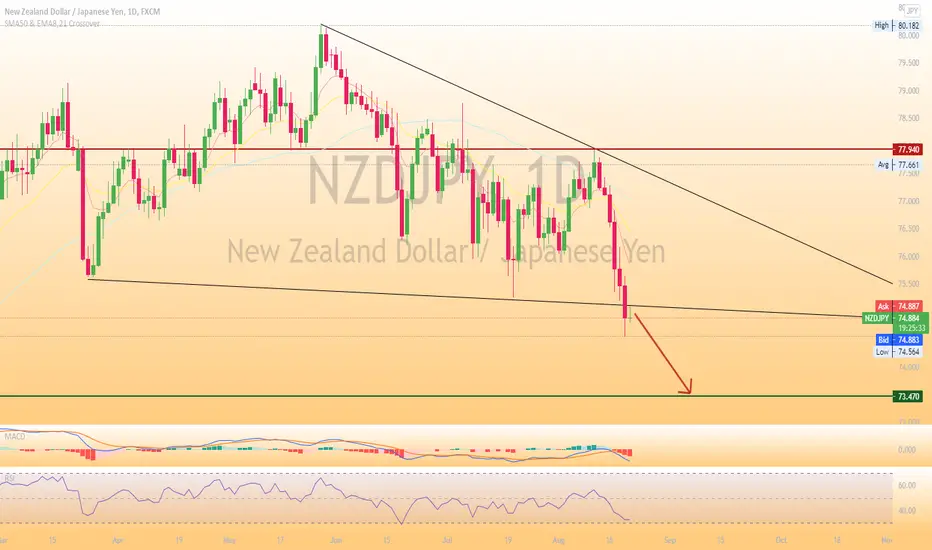
NZDJPY bearish scenario:In this pair, technical analysis shows a technical figure Descending Triangle. The Descending Triangle has broken through the support line on 20/08/2021. NZDJPY forming a bearish formation on a daily chart . If the price holds below this level we will have a possible bearish price movement with a forecast for the next 42 days with a target of 73.47. If you decide to enter this position, experts say your stop-loss order should be placed at 77.94.
Risk Disclosure: Trading Foreign Exchange (Forex) and Contracts of Difference (CFD's) carries a high level of risk. By registering and signing up, any client affirms their understanding of their own personal accountability for all transactions performed within their account and recognizes the risks associated with trading on such markets and on such sites. Furthermore, one understands that the company carries zero influence over transactions, markets, and trading signals, therefore, cannot be held liable nor guarantee any profits or losses.
GBP/USD Technical AnalysisFollowing the payroll news on 06.08.2021 the US currency has gone bullish. Descending triangle formed on GU and broke and retested the neckline. Expect price to fall minimum to the 1.37700 area.

Cardano analysis in 2H time frame * Cardano in 2H time frame forms Descending triangle pattern, with it's resistance as above trend-line and it's support near $2.0550.
* Descending triangle is considered to be either trend continuation or trend reversal pattern depend on the breakout.
* If the price breaks the either side of the pattern it will give a good momentum till the given targets.

QTUM in descending triangleLooks like QTUM is forming a big descending triangle last few days... Big figure = BIG MOVE, so it can be worth watching it... COULD BE GOOD FOR SOME IN-RANGE TRADING ALSO...

Descending Triangle on ADAUSDTPERP BinanceThere a descending triangle pattern on 1H TF ADAUSDT, still waiting for break to confirm the pattern.

VERTEXCHARTS | AUDNZD TRADE IDEAAUDNZD hits the exact support of the descending triangle in the daily timeframe chart.
The pair is growing to the minor resistance at 1.055 and the resistance line of the descending triangle.
Like and Comment to Support this idea.
