DGB

DGBSUDT ANALYSISIt is below the down trend line
Buy this coin at the support line ($ 0,02067) sell at the resistance line ( $ 0,03690) or sell with the EngineeringRobo ' s sell signal
It is not good time to hold this coin no hope for a while.
However, EngineeringRobo gave Sell 1 & Sell 2, Bear and Sell 3 to Bitcoin, I am not strongly recommending to buy any altcoins at the moment.
If you want to use EngineeringRobo please dm me.

DigiByte (DGB) Uptrend Intact (80%+ Mapped Short-Term)We just saw another shakeout take place while DigiByte (DGBBTC) retraced after a new peak was hit.
Let me tell you that the uptrend is still intact.
Today we ended up with a higher low for DGBBTC compared to 21-May.
Right now we have early signals developing in favor of the bulls.
We have above-average volume coming in.
A strong bounce taking place just above EMA200.
Higher low (just mentioned).
The MACD starting to curve.
Strong RSI.
For your convenience, I marked the next target short-term... That is within 1-4 weeks.
This target can also be hit mid-term, which goes from 1-3 months.
Of course, the charts are always changing and can always change and that's why you need a plan before you trade.
If you have any questions feel free to leave a comment.
This is Alan Masters.
Thanks a lot for your continued and amazing support... I love you! 🤗
Namaste.


DigiByte (DGB) Another Wave To The Upside Is ExpectedHi friends hope you are doing good and welcome to the new update on Digibyte coin. In my previous article I showed you that the price action of Digibyte coin was at the support of an up channel. The price line of DGB is moving within this channel since April 2020. This time I was expecting that the price action will breakout the resistance. Finally the priceline started the bullish move but failed to breakout the resistance and now moving down at the support again. This was almost 50% rally.
The strong support of SMAs at the support of channel:
This time there are more strong chances that the price action will be bounced to the up side from the support of this channel and it will make another attempt to breakout the resistance. Because after placing the simple moving averages with the time period of 100 and 200 we can observe that the 100 simple moving average is almost at the same level where we have the support of the channel as well. The 200 simple moving average is also below the support of this up channel.
A bullish Butterfly move:
At the support of this channel the price action has also completed the formation of the bullish Butterfly pattern on the small-time period 6-hour chart. Let's dig this pattern deeper to see how perfect this pattern is driven.
After initial leg the A to B leg is retraced between 0.618 to 0.786 Fibonacci then B to C leg is projected between 0.382 to 0.886 Fibonacci projection of A to B leg then C to D leg is retraced between 1.27 upto 1.618 Fibonacci and here we have all legs driven as required for perfect bullish butterfly.
Now the priceline is entered in potential reversal zone of this pattern and from here the priceline can move up at any time.
The priceline is geared up from the PRZ level as predicted last year:
Now I would like to recall my previous post that I shared over a year ago in June 2019 when I predicted that the price action of DGB is forming a bearish Shark pattern and soon it will start the formation of C to D leg. I also showed the pivot support in the potential reversal zone of this bearish Shark pattern. And using this support the price action could start a powerful long term rally to the upside.
This idea had potential to produce up to 1400% big bullish move. Now it can be easily observed that as predicted the price action has geared up from the pivot support and the potential reversal zone of this bearish Shark pattern and so far it has produced more than 396% profit.
I am sharing the sell targets again that I have defined as per Fibonacci sequence of beraish Shark as below:
Sell targets:
Secure sell targets:
Sell between: 0.00000338 to 0.00000694
Aggressive targets:
Sell between: 0.00000808 to 0.00000969
Conclusion:
On the long term the price action is in bullish momentum but if we move to the daily chart then the price action is at the support of channel. Even though we have very strong supports of the channel and the moving averages as well therefore this report can be critical as well because if this strong support will be broken down then a short time rally can be started to the downside.

DigiByte (DGB) Strongly Bullish, Out Of Consolidation TriangleDigiByte (DGBBTC) is out of the consolidation triangle and is looking strongly bullish.
After prices peaked 6-May, DigiByte remained really strong.
The classic retrace hit a low 21-May and after this date, we've only seen higher lows.
Printing slow but steady growth, which is a signal of strength, DGBBTC moved back above all EMAs and is now aiming to break the last high.
With a very strong RSI... The next move can be equally strong... The next target is marked on the chart.
Namaste.

DGB AT SUPPORT ON BULLISH DIVERGENCEprice action has been bullish with continuation signals for many weeks
seems like a great spot to bet on another leg up
not financial advice

EXPLOSIVE MOVE AHEAD FOR DGBsome visually stunning divergence for dgb
hard to imagine how this does not translate to a massive move up in the days ahead

DGB Breakout from Trendline. Next Target 0.09DGB beakout from trendline.
Bullish bias.
Next Target 0.09.

DGB 25 WEEKS OF LONG TAIL WICKSprice has not been able to go below a long tail wick in 25 weeks
not enough sellers to get the price back into those areas
the trend looks strong

DGB DigiByte Bonfire Gann from squareI know this is an unusual way to Gann but after finding square using Bonfire, I found a starting point that and intersections that align with certainty with each other. I will post a pic below. These lines are trends to follow or break and should be used as confluence. Often vertical lines drawn from intersections provide minor and major pivots. Long term I'm bullish but awaiting to see how DGB walks along these important Gann lines in collaboration with other indicators and will adjust my position accordingly.


DGB/BTCHi Members!
This is our new strategy for accumulate BTC,
Coin : DGB/BTC
Exchange: Binance
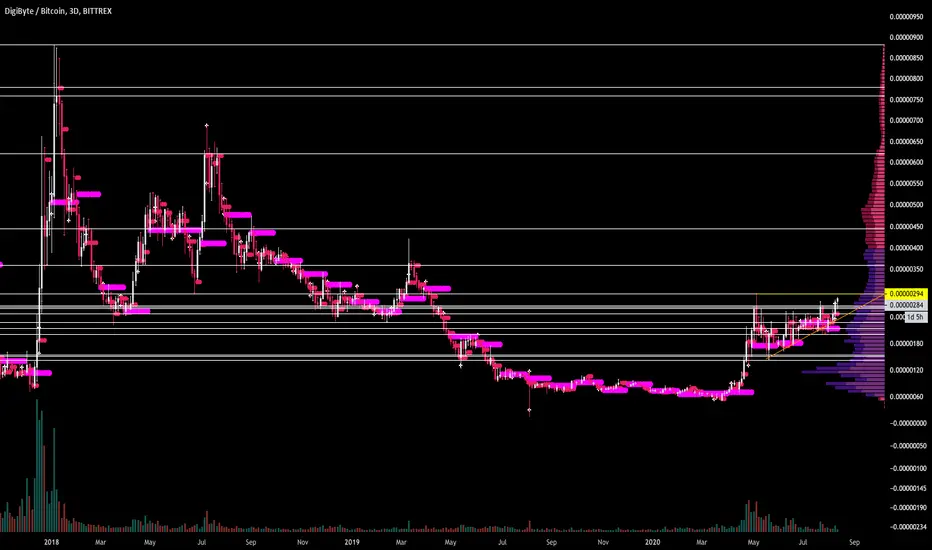
OCO Entry Zone: 0.00000284 - 0.0000030
Target 1 : 0.00000325 (10%)
Target 2 : 0.00000357 (20%)
Target 3 : 0.00000409 (37%)
Target 4 : Raise your personal stop lost
OCO Stop Loss : 0.00000234
Comments: This is our new strategy for accumulate BTC, we use Binance exchange for this strategy, because we need to set a OCO

DGB-BTC: Ascending triangle breakoutHello,
I posted this ascending triangle on DGB some days back, today we see DGB moving nicely after breaking out of this pattern.
My first target remains at 355 sat, after that 420 Sat is good level for Take profit.
Happy and safe trading...
Chao...


DGB SET TO SURGE We have one of the oldest alts here and it's already on a 800% rally from the bottom and it is not done yet. We are showing great upwards momentum and currently sitting in an ascending triangle (best seen on the 4 hr time frame). If the ascending triangle breaks to the upside then the first target can easily be the 2.618 extension. This thing is already on a rampage so lets see if it continues. FOLLOWS, COMMENTS, LIKES, and DONATIONS appreciated.


Testing Auto Fibonacci Ring Indicator - Low Source
See image for original with indicator (rings) included. DGB is in a good spot right now if it can avoid major drops at or near each intersect (price meets Fib rings). At this early stage I thinks its safe to safe there will at least be a major action at each ring. The levels may very well be the best data here as they are drawn from squared Fib tangents. This indicator will be available "pay for use" after testing is complete.

DGBBTCDGBBTC
Growth possible
1 - 0.00000347
2 - 0.00000400
3 - 0.00000466
f you like what I do, put 👍 and subscribe
Waiting for your comment, what do you think about this?

DGB RALLY IN PROGRESSall fueled up and rested for another drive higher
dgb confirmed at the .618 and is currently breaking out for another push higher
