Heavy resistance at 0.012c - expect a short term reset to 0.0083I saw heavy sell orders in Binance around 0.012 mark. Though the sell orders aren't that massive - around 50 million LINA
BTC, SPX RSI shows overbought conditions, a correction is due, this will reset LINA too.
Though RSI shows bottoming process in LINA, the Huobi one is most accurate, because it was listed first over there. Actual price of LINA was 0.001 during listing but we went to
0.021 on listing day then 0.005, this isn't listed anywhere on TradingView.
The supply was three to four times less around 2021 Q1. at 40 M market cap we were around 0.04 price range, now at 40M cap we are around 0.01.
APY fluctuated between 80% at 0.10 and 160% at 0.005, now it is 95% at 0.001, which is still good fundamentally.
DIA

A bullish scenario for DIATake profit level: $333.
DIA is extremely liquid, with huge assets and a long track record. The fund's UIT structure is shared by a few other long-lived ETFs (like SPY), with the most notable effects being a slight cash drag since stock dividends received in between the ETF's distributions can't be reinvested as is typically the case.

DJI to $14,500 in July 2032?Do we revert to the 50 year mean in 2032? That would put the Dow at 14,500 in 2032 if the cycle repeats.
Found it very interesting that it was exactly 50 years to get a low & bounce from the Great Depression bottom.
Every mega bear market is different so IF this is the start of another mega bear market that takes us to the lower blue line on this log chart then I doubt it will be labeled "Great Depression or Stagflation".
Great Depression-Lasted 3 years
Stagflation-Lasted 16.5 years
Jan 2022-July 2032=10.5 years (16.5+3=19.5 years and then divide that by 2 and you could conceivably say 10.5 years of whatever we will call it does make sense from a timeframe perspective).
Either way, IFFFF we are in a mega bear market the chart won't look identical to either the Great Depression nor Stagflation...it will have it's own uniqueness and it's own name.
For now, I'm just looking for the open weekly gaps on the DJI to get cleared seeing as those have ALWAYS cleared. Open weekly gaps are at 28,495.05 and 24,718.46

US DOLLAR/ Dollar dips on FED hike viewThe US DOLLAR has topped out and now beginning it correction. This is very bullish/positive for US Stocks for a new "potential" indication set up for them to breakout on a impulsive wave up.
It had touched my previous forecast of 110 as my last target.
Federal Reserve will take a more aggressive approach in hiking interest rates next week.
Expectations for a 100 basis points rate hike by the Fed at its policy meeting next week stood at about 29%, according to CME's FedWatch Tool after reaching as high as 80% last week.
The Fed seems to be leaning more towards 75 basis points than to 100 basis points," said Jim Barnes, director of fixed income at Bryn Mawr Trust.
A strong start to the trading session for stocks on Wall Street fizzled out, however, as a drop in Apple Inc (AAPL) weighed following a Bloomberg report that the iPhone maker plans to slow hiring and spending growth next year in some units to cope with a potential economic downturn

TOP WAVE STRUCTURE I AM NOW 50 % NET SHORT DIA SPY QQQ and long VIX We are in a zig zag and a triangle patterns within the choppy phase see updated forecast a quote A up down up pattern will form before the wave 5 down or a larger wave B into a low 3588 to 3488 focus 3511 NO real change to this forecast There is NO more Bull market it ended


Adam and Eve pattern, target 118, resistance also there. Falling wedge above support, now about to reach resistance of 118, and also target of Adam Eve pattern. I expect a descending triangle after that.
This coincides with 10 year stock reset and 4 year crypto cycle. Time frame is a little bit too long, my excuses for that. I think from December 2022 till May 2023 we might see DXY finally going down. 2024 and 2025 is bull

NEW WAVE B LOW COMING 3588/3490 FOCUS 3511 So far the first leg of the bear market has come to an end we had a very clear abc rally for wave A up we should now see an abc drop into a new low at which time I will be going long once again the last wave gave us my 10 to 14 % based in the trow and qqq and perfect in spy target 393 . I have taken profits on ALL trades and will wait till july 5th . once the next shoe falls this will then see the next rally to 4110 to 4180 that will mark the summer peak then the CRASH WAVE into the week of OCT 4TH .THAT WILL BE THE LOW . BEST OF TRADES WAVETIMER ! GOD BLESS THESE UNTIED STATES

13k Q4 2022; Sept 2024 160k. analysis since day 1 of BTCThis is a very detailed analysis by Dia, I won't post till Q4 2022.
- I see believe in 4 year cycles, average bull cycle is 800 days, and average bear market is 400 days, the other 200 I called ''neutral'' days where market switches between them.
- Macro economics are very bearish , including stocks, more downside is definitely expected to keep inflation under control, SP500 is big bull channel ready to break down
- TOTAL crypto cap is 914 b, next support is at 755 and 455 respectively, current crypto cap will not hold and 50% correction is definitely on the table (ascending wedge )
- The entire 30 to 60k symmetrical triangle structure has broken down, I notice every time a support line of previous bull run is broken, the last one will become support (the dotted lines). This is a very ugly break down and if people say bitcoin is DEAD and they show this chart, they can be right for the first time in history.
- the 30k and 60k triangle can be manipulated into a falling wedge , that coinicides with Q4 of every 4th year of bull run being the bottom and support line from previous bull run touching there exactly to the point
-looking at rsi we still actually just entered bear market territory (monthly stoch rsi under 10), bear market is around 40 to 50% finished. Still have a year or so to go roughly
CURRENT STRATEGY
DO NOT TRY TO TRADE IT (I shorted FLM and UNFI and lost 76% of my portfolio in 1 month)! Between now and end of 2022, DCA in coins, tokens that you believe in and look strong. THIS IS THE OPPORTUNITY OF YOUR LIFE!

Some Sort of a Low (DIA...'The Dow')DIA has been the ‘tell’ so far in 2022. Recall that 295 was marked as a big number and Friday’s low was 296.39. Close enough! Friday’s low was right on the channel line and a hair above the 200 week average (thick red line). After today’s strong action, my view is that the long side is viable until further notice.
-Jamie Saettele

DIA Historical CorrectionsThis is a macro perspective on the cycles of DIA.
I want to focus on all time highs and the corrections that come after.
Currently DIA is sitting at about a 19% decrease from all time high value.
As the chart suggests, this market could drop even further. Don't be surprised if it does. These things happen.

BTC inverted chart bull flag, next target 16.5kinvert charts and you will see a bull flag , we going to dump
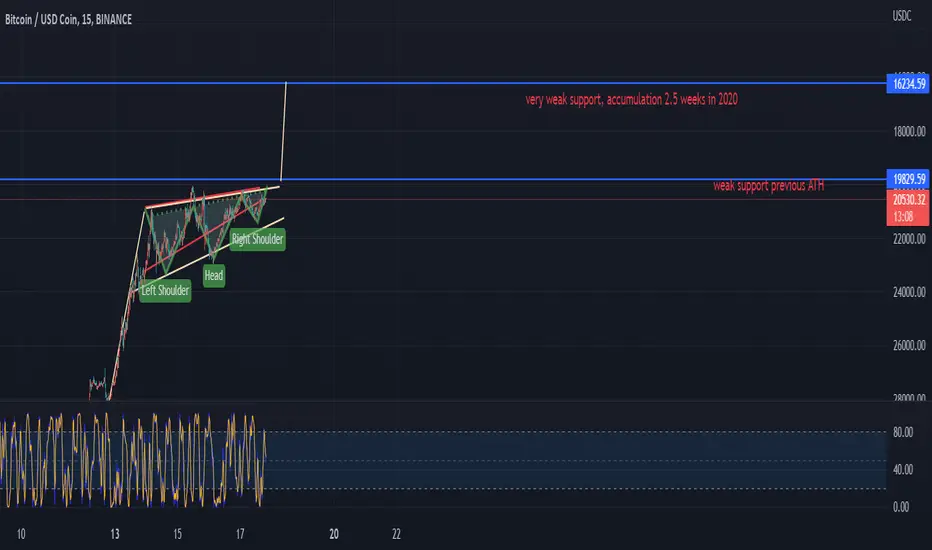
BTC will bottom at 12k, accumulation 12k and 19k, 2025 135kIf we break 20k and flip it to resistance then we will indeed go to 12k levels, where there is big support.
This is possible from fundamental analysis
1. more rate hikes for about three quarters
2. stock market has not bottomed out, there is support coming in, though
3. borrow protocols like celsius and 3ac who needs to be liquidated
4. 4 year cycle respected
Adam and Eve inverted pattern is also very strong, don't underestimate it

TOP WAVE STRUCTURE STILL WORKING As we come closer to the end of the first leg down in the Bear Market . We are setup for a monster rally of 11 to 14% My last call was 5.8 to 10.8 and we popped 9.2 to 10.3 . The real crash is still into oct 4 th week That will be anywhere from 3250 to 2250 with the ideal target in the 2770 area . AS I FEEL THE US $ IS TOPPING NOW . BITCOIN i TOOK A LONG AT 23600 AND WILL ADD AT 18600

DOW Gap CloseAfter a huge Sell-Off regarding the rumors about a 75 basis points rate hike.
I expect a relief rally towards the 50 EMA.

SPY, BONDS & FED BALANCE-SHEET - (zoomed)A place to view T-Yields, Fed Funds, and Money Supply against TLT and the SP500 .

SPY, BONDS & FED BALANCE-SHEETA place to view T-Yields, Fed Funds, and Money Supply against TLT and the SP500.

Some more pain?I think SPY will eventually hit those green lines which could act as support. I will get in when spy hits the bottom green line.

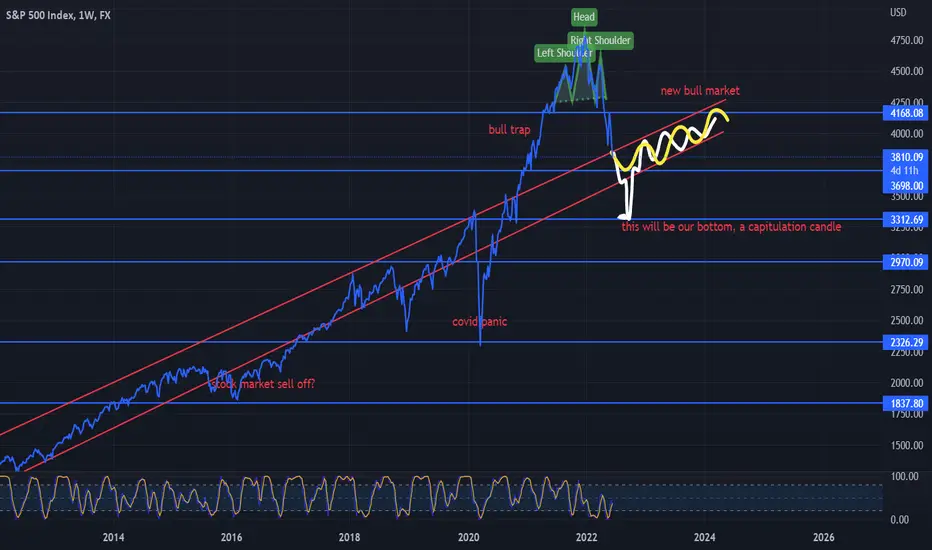
2009 till 2022, bullish channel, where we bottom by DIAAlright, so we can clearly see a bullish channel since 2009. During a bear market or stock sell offs, we deviated temporarily from the trend line ;there is no support there at the moment, or maybe we go more sideways. This could mean bottom is if we break 3700, 3311 swift capitulation, then bounce to 3600.
Market behaviour & correlations since 1971 (FIAT)Long term, equities are more closely correlated with the Fed's balance sheet than they are with T-Yields, Fed Funds, or Commodities .

Market behaviour & correlations since 1971 (FIAT)Long term, equities are more closely correlated with the Fed's balance sheet than they are with T-Yields, Fed Funds, or Commodities.

MOVE TO A 50% NET LONG ALL INDEXES MARKET WAVE B LOW LOOK FOR ANOTHER MOVE TO ABOVE 4177 /4213 the wave structure seems to be following the top wave count wave b down has ended under this model

BTC crash incoming TODAY? broke from bear flag, SPX below 4kResistance from 48k is now blocking the price from moving up! together with bear flag now being resistance, the dead cat bounce game is over?
