Using Regression Formula's to Predict Daily Highs and Lows Leave a comment if you would like to learn how to calculate the formulas or you have any other questions.
Hope you find this useful!
DIA

$DIA Key Levels, Analysis & Targets$DIA Key Levels, Analysis & Targets
Some number’s I’m looking at. Sorry, not much of an explanation today… I’m tired LOL.
GL
——————
I am not your financial advisor, but I will happily answer questions and analyze to the best of my ability but ultimately the risk is on you. Check out my ideas, but also do your own due diligence.
I have a huge tolerance for volatility so please know that. If you’re new to my trade setups please try them on a small scale first. Then go in with a risk you’re comfortable with.
I am not a bull. I am not a bear. I just see what I see in the charts and I don’t pay too much attention to the noise in the news.
If you want me to analyze any stock or ETF just leave me a comment and I’ll do it if I can. (If I have time)
And most importantly… Have fun, y’all!!
(\_/)
( •_•)
/ >🚀
bear flag + bearish divergence. btc is finished 39 to 40.5kdont buy! dont long. bulls waiting for 39000 to 40000 to dump large amount of btc. BTC IS DONE. its done!
it will go below 30000 and form a resistance, stock market also rising wedge, bearish. stay safe!
i suggest DCA BTCDOWN around these levels.
there was huge inflow of btc last few days around 20000+. same as dec 2-4 dump.

DIA - Wobble TopDiamonds ETF Monthly Chart having a grim start to 2022. Wobble Top with wild price swings over the last five months. Jan 2022 has been the wildest yet.
Monthly chart showing a potential bearish engulfing print. With only 1-day left in January will they save it? Even if buyers do come to the rescue on the 31st, indicators point to DIA ultimately going lower in early 2022.
And while buyers may appear to be exiting in earnest this month, based upon an entrenched "BTFD" sentiment, my take is the real selling is just beginning. It likely won't take too much more pressure/bad news to start a real rout.
The dollar's strength/resiliency combined with JPOW's comments and live market reaction this past week are telling. Expecting at a minimum a quick retest of the recent Jan lows in early Feb, and likely sharply lower into March/April 2022. Long volatility and short just about everything else as the baby will likely be thrown out with the bath water this time. Great Reset Indeed.
Not financial advice.

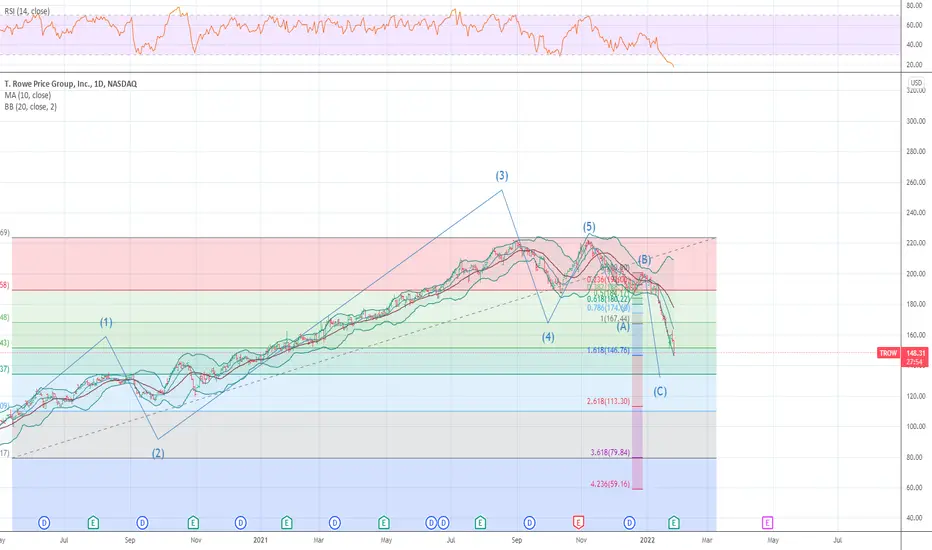
TROW MODEL WE ARE GOING TO FIND SUPPORT .618I have been posting that the spring and a date jan 27 time frame would be an event I feel that the downside is focused at gold ratio support and max fear this is wave A within the bear market the final low is due oct 4 of this year but we are near the bottom and will soon see a rally for a few weeks after this cycle is ended .I will post detail later this sunday
An 8.5% change in the S&P in one dayWow, that is some serious price action. Bottomed out at -3.9% around 11:30 and then rallied +4.6% by the end of the day to close positive for the day..
On the chart you can see the 20, 50, 100, and 200 day SMA. I also added the key price levels to watch. You can see the bounce off the lower and the morning open to be at the middle one. Would not be surprised if we see a rally to the upper level in the next week or so.

Relative Momentum of US EquitiesRelative Momentum of US Equities
SPY - Broad Market / Large Cap Equities
DIA - Dow Jones
QQQ - Nasdaq / Large Cap Growth
IWM - Russell2000 / Mid Cap Blend
IWV - Russell3000 / Small Cap Blend
IWC - Micro Cap Blend
SPYV - Large Cap Value
SPYG - Large Cap Growth
VXF - Extended Market Ex S&p500

DIA token formed bullish Gartley for upto 148.5% big moveHi dear friends, hope you are well and welcome to the new trade setup of DIA token.
Previously we had a nice trade of DIA:
Now during the current crash, on the weekly time frame chart, DIA has formed a bullish harmonic Gartley pattern for a big bullish reversal move.

DIA , a long term investment opportunityDIA , a long term investment opportunity.
If the price drops more, I will buy more
Target is about 15% invested Capital Gain
My positions will stay open until the average price target is hit

S&P 500 touching 200 day SMA - 68% chance of rallySince 2004
25 --> declines touch the 200 day SMA
8 --> continued into a larger correction
17 --> rebounded to some level
8/25 = 32% chance of bearish
17/25 = 68% chance bullish
Looking at the trend since 2004, it may take a week or two at these levels before it chooses its direction.
If I had to guess, this could be a likely match to today's place in the market.
20, 50, 100, 200 day SMAs

i expect 38k bottom. maybe one final dump. then upfalling wedge = bullish. howeever, i am a bear and hope btc to crash to 30k. this will take time.

DIA-USDTDIA-USDT has plotted a nearly 75% this harmonic pattern which suggests the long trade as shown in diagram

alt season coming because dominance breaking downcup handle break down, and 35 target. it will repeat 2018 retrace of btc again

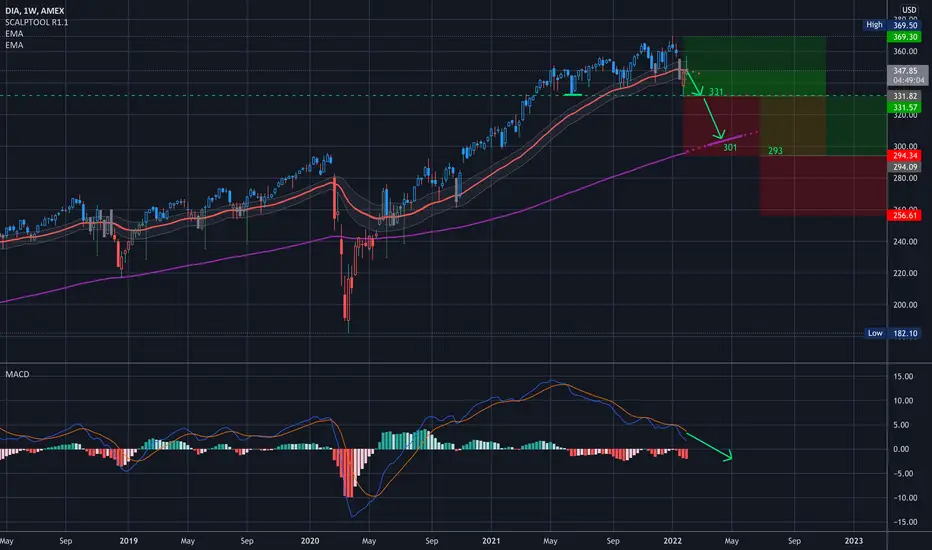
SHORT $DIA — BEARISH A,B,C,D PATTERN!
I'm expecting a move to the downside to complete this ABCD pattern in $DIA.
The gaps below the market will act as price magnets, and the same measurement from A to B from C would fill the bottom most gap.
I love this setup, and I'm buying puts on various names within the index and broader market to play it.
We could potentially see the pattern continue to the downside, but I am forecasting for a gap fill at minimum.

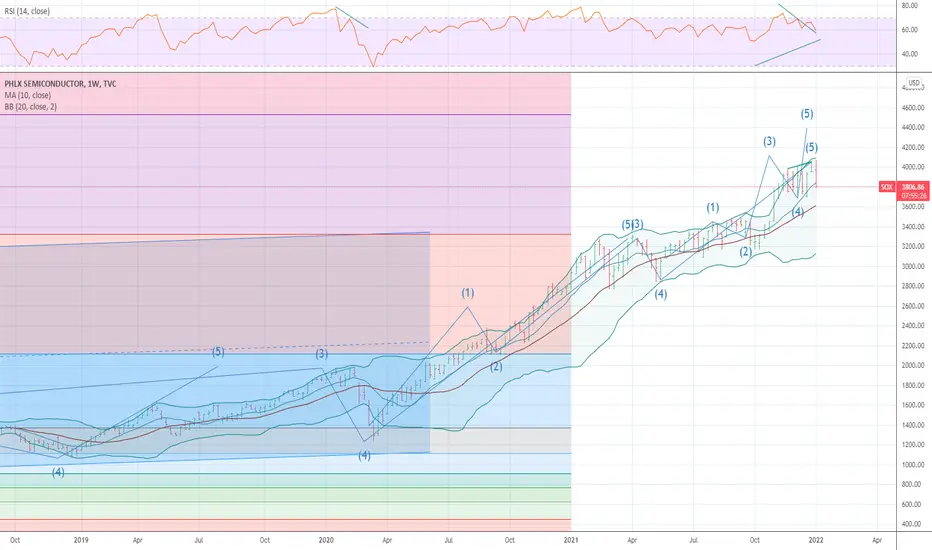
TOP WAVE STRUCTURE I AM BULLISH NOW We are about to see a new up leg into record highs in what should be a fast up thrust WAVE 2 was a flat and wave 4 is a triangle up Elliot WAVE STRUCTURE this a CLASSIC 4th WAVE under rules of alternation .Therefore I maintain will see an final 5th wave up to just outside the monthly bb at 2% above the bands to end the BULL MARKET FROM MARCH LOW2020

NASDAQ (QQQ) 2016 Rally Coming to an End?Things have been different lately in the NASDAQ. It has really leveled off in December and last week was rough. I laid out some trend lines and fib levels. To me, it looks like the rally from 2020 helped QQQ regain the bullish channel from the 2016 correction. Also, if start a fib sequence at the Feb 2016 low and a 1.0 at 2018 peak, then Nov 22 was a perfect touch of the 2.146 fib extension. We then had a retest for a double top on Dec 27th (but came up short). Since then we have been trending down. If you look at teh RSI you can also see that the recent ATH happend on a noticable lower RSI value, which is a bearish indicator (divergence). Saw the same kind of setup in 2015 and 2018.
Hard to know if we will try another rally to touch/break the 2.146 fib ($408), or we will see a stronger pull back.
1D
4h

QQQ the BULLISH WAVE COUNT WAVE C DOWN ON NEWS I wrote last week of a crash cycle I was looking for anywhere from 11.8 min today we fell short at 9.47 % of which that is a .786 of my drop of 11.8 % I am no longer bearish . the QQQ .I HAVE MOVED TO A NET LONG AND IF WE BREAK DOWN INTO 362 I WILL BE 100% NET LONG BUT DOUBT WE will see this . I now am looking at the drop has ending a wave 4 within the super cycle blow off before the CRASH world wide due OCT 10/20 BASED ON THE 20 10 4 2 1 YR CYCLES DUE AS WELL as the 9.2 month ALL are focused on oct 10/ 20 .BEST OF TRADES WAVETIMER

Bitcoin going to 19k, 69k was a trapSeems a lot like those triangles from early bull markets, this time 69k is the bull trap. What do you think.
Support bottom 19k from 2017 or 13k from 2019

UVXY (VIX) pattern implies risk on until mid-JanuaryHere is a pattern that I noticed in UVXY over the last year. The red trendline has been very consistent as a time for UVXY to change directions. If it holds, then the market is moving back into rally mode and we should not expect to see another pull back until mid-January.

5 WAVES UP ENDED LOOK FOR A CRASH We have ended into a Month in history with the highest level of major market tops outside of late aug 17 to sept 10 thru out the markets history . at THIS POINT and the wave structure as well as fib relationships within the the wave structure . I can now say we are setup for a CRASH cycle I think it has started and will see it over the next few days . the weekly rsi has not confirmed this rally as well as the nysi and nymo models put/call/ are not at any bottom or value nor is the naz dsi or fear greed index . BEST OF TRADES WAVETIMER
HIGH LEVEL SIGNAL IS NOW BEEN GIVEN C R A S H SIGNAL LOOK FOR A CRASH OVER THIS WEEKEND based on the action in nysi and mco as well as put call and the wave structure and the fact the sp reached into my projected stop at 4818 BTW mass fib relationship the alt to 4818 was 4917 these are relationships going back to 2009 low

Boeing ~ BA 242 or so should hit next on Boeing. Dow should remain strong this year.
Boeing may begin to move and breakout much further on the longer term DTL.

S&P respecting the 2009 resistance trend lineUpdate to previous post. The light volume over the holidays allowed the S&P to surge above the channel, but with trading back in full action yesterday's sell off brought the S&P back into the 2009 channel. Looking back at previous price action in 2010, 2011, and 2014-2015 this could continue on for the rest of 2022. I still think the S&P will make it to at least 5000 ($500) before we see a sizable correction.
1D
4h
