MOST BULLISH ALT WAVE 1 OF 5 THE chart posted is that of a rather bullish alt and could be how we get to 4917 .If Correct we ended only wave 1 of 5 and we are now in wave 2 , I will keep posting . I am net long based on this .WE DID STOP NEAR MY 4818 RES AS WELL IN THE QQQ TARGETS .
DIA

DIA BTC pair - A big move expected - pumping dumping tokenDIA BTC pair - A big move expected - pumping dumping token

S&P to 5300 by end of 2022S&P to 5300 by end of 2022
Did my own version of wave analysis using fib levels on the S&P. Key levels I see are Wave 1 is around 0.618, Wave 3 is 1.0, and Wave 5 ends at 1.786. You can see how well it lines up on the chart.
If the pattern holds, then it looks like this wave off the 2009 low should peak at 5300. I laid out a large scale fib starting wave 1 at the great depression and wave 3 in the mid 70's. I see a very good alignment at a 2.0 fib at 5336.
1M timeframe
1W timeframe
1D timeframe

Alt wave structure wave B top in sp 500 At this point I am not sure which is the top wave structure we do have the nysi nearing a major target and put/call was very high at that low . BUT HAS DROPPED VERY FAST !! . So I have now moved back to cash . 100 % as the chart posted here is that of a 5-3-5 or is a 1. 2 1 of 3 . I will how ever stay on the side till I see a change . BEST OF TRADES WAVETIMER > be safe HAPPY HOILDAYS

DAX H16: BEST Level to SHORT IT +1000/+1500 points(SL/TP)(NEW)Why get subbed to me on Tradingview?
-TOP author on TradingView
-2000+ ideas published
-15+ years experience in markets
-Professional chart break downs
-Supply/Demand Zones
-TD9 counts / combo review
-Key S/R levels
-No junk on my charts
-Frequent updates
-Covering FX/crypto/US stocks
-before/after analysis
-24/7 uptime so constant updates
🎁Please hit the like button and
🎁Leave a comment to support our team!
DAX H16: BEST Level to SHORT IT +1000/+1500 points(SL/TP)(NEW)
IMPORTANT NOTE: speculative setup. do your own
due dill. use STOP LOSS. don't overleverage.
🔸 Summary and potential trade setup
::: DAX 16hour/candle chart review
::: BUY alerted at 15100 +700 points now
::: trading in massive range since May 2021
::: 16000 range highs / 15000 range lows
::: focus on BUY LOW / SELL HIGH strategy
::: we will trade sideways next 4/8 weeks
::: bearish fractal in progress now
::: setup still valid as of today
::: new wave of global lockdowns
::: upside limited from here
::: short-term limited upside
::: HOWEVER heavy resistance overhead
::: 15 900 strong resistance
::: get ready to SHORT from overhead
::: BEARS will take over soon
::: lower risk setup is SHORT
::: get ready to SHORT HIGH later
::: once we hit resistance at 15 900
::: TP BEARS TP1 +1000 points TP2 +1500 points
::: SHORT/HOLD setup with great risk:reward
::: BEARS TP FINAL is 14 800
::: recommend to SHORT/HOLD
::: recommended strategy: SHORT/HOLD
::: 15 900 reversal level to SHORT IT
::: BULLS focus on BUYING LOW
::: near 15 000 / 15 200 later
::: TP BULLS is 15 900 points
::: SWING trade setup do not expect
::: fast/miracle overnights gains here
::: good luck traders
🔸 Supply/Demand Zones
::: 15 000 fresh demand zone
::: 15 850 fresh supply zone
🔸 Other noteworthy technicals/fundies
::: TD9 /Combo update: N/A
::: Sentiment short-term: BEARS
::: Sentiment outlook mid-term: BEARS
RISK DISCLAIMER:
Trading Crypto, Futures , Forex, CFDs and Stocks involves a risk of loss.
Please consider carefully if such trading is appropriate for you.
Past performance is not indicative of future results.
Always limit your leverage and use tight stop loss.

NAS100 H3: PT 15 750 XABCD Bears: SHORT IT! (NEW)Why get subbed to me on Tradingview?
-TOP author on TradingView
-2000+ ideas published
-15+ years experience in markets
-Professional chart break downs
-Supply/Demand Zones
-TD9 counts / combo review
-Key S/R levels
-No junk on my charts
-Frequent updates
-Covering FX/crypto/US stocks
-before/after analysis
-24/7 uptime so constant updates
🎁Please hit the like button and
🎁Leave a comment to support our team!
NAS100/QQQ H3: PT 15 750 XABCD Bears: SHORT IT! (NEW)
IMPORTANT NOTE: speculative setup. do your own
due dill. use STOP LOSS. don't overleverage.
Tagged as SHORT because short-term I expect
more losses / 5% pullback off the highs.
🔸 Summary and potential trade setup
::: NAS100/QQQ H3 market overview/outlook
::: XABCD Bears in progress / speculative setups
::: BEARS short from overhead near 16 900
::: shorting makes sense
::: 5% pullback warranted off the highs
::: TP bears is 15 750 points
::: upside likely limited from here
::: means we will get more follow-through selling
::: STRATEGY: SHORT RIPS/RALLIES /NEAR D / PRZ
::: Bears TP is 15 750 points. 5% pullback.
::: Expecting MILD gains next 1-2 weeks
::: recommended strategy: SHORT IT / SHORT RIPS
::: hit resistance time to cool down a bit
::: no fast/miracle gains here - patience required
::: good luck traders
🔸 Supply/Demand Zones
::: N/A
::: N/A
🔸 Other noteworthy technicals/fundies
::: TD9 /Combo update: N/A
::: Sentiment short-term: BEARS/PULLBACK
::: Sentiment outlook mid-term: MIXED/RANGE
RISK DISCLAIMER:
Trading Crypto, Futures , Forex, CFDs and Stocks involves a risk of loss.
Please consider carefully if such trading is appropriate for you.
Past performance is not indicative of future results.
Always limit your leverage and use tight stop loss.

S&P still respecting the 2009 resistance trend lineUpdate on my previous post. The S&P is still fighting with the resistance setup from 2009. Big pump at the end of today still did not change that. My guess, the big boys trying to suck in as much money as possible to try and pump S&P above this resistance. A 2-3% pump in something like 30 minutes was not driven by retail investors. Question is will retail jump in to get a breakout or will the big boys dump it by the end of the week? The setup looks pretty bullish to me, but need some kind of breakout to really make me choose to go more in or not.
2h
1W

$DIA — Market Forecast 12/18/21We officially filled the gap on Friday, 12/17, because we had actually bounced off the moving average before we could fully fill it on Tuesday and Wednesday.
Gaps on equities will fill about 80% of the time, and then the markets tend to reverse 80% of the time after a gap fills.
We have gaps immediately above and below the market right now; I think that we'll see another drop with the continuation of this downside momentum before the possibility of a bounce in an attempt to fill that upside gap — I don’t think it will fill right away, but keep your eyes on it.
I have been very accurate with the market forecasts that I send to my clients every weekend, so here are my thoughts on a few of the indices...

🆓DIA (DIA) Dec-22 #DIA $DIA
.
📈RED PLAN
♻️Condition : If 1-Day closes ABOVE 1.2$ zone
🔴Buy : 1.3 - 1.2
🔴Sell : 1.6 - 2 - 2.4
📈BLUE PLAN
♻️Condition : If 1-Day closes BELOW 1.2$ zone
🔵Sell : 1.2
🔵Buy : 1 - 0.9
❓Details
🚫Stoploss for Long : 10%
🚫Stoploss for Short : 5%
📈Red Arrow : Main Direction as RED PLAN
📉Blue Arrow : Back-Up Direction as BLUE PLAN
🟩Green zone : Support zone as BUY section
🟥Red zone : Resistance zone as SELL section

NASDAQ (QQQ) Wave Count since 2002Been a while since I did an Elliott Wave count for QQQ. Here is what I came up with. If wave theory has any real merit, then we clearly look to be in Wave 5 off the 2002 low from the dot com bubble. Inside Wave 5 it looks like we are also in a sub-wave 5. I am basing my analysis off fib levels and some patterns/features that I see in the price action.
It is hard to know where this wave 5 is actually going to stop. Wave theory only gives us general guidelines. Wave 3 typically ends around the 1.7 fib extension and Wave 5 usually around 2.146 to 2.5 (depends on where wave 3 ends). Also, wave 5 is typically 0.618x, 1.0x, or 1.236x wave 1.
Looking at the chart, then 1.0x wave one puts QQQ at the current ATH (184% vs 180% to be exact). This also lines up with a sub-wave 5 ending just a little over 2.0 fib extension off the 2019 low, which is pretty good match to the sub-wave 3 extension just a little over 1.618 (reaches up to touch the major fib of 2.786). That is a pretty encouraging sign that my counts are close.
The question obviously is will it go higher? An extension off Wave 1 to 1.236x would be around $318 (222%) and just around a sub-wave fib ext of 2.236-2.382. If it does make it that high, I would not be surprised if we get one final push to the 3.146 extension to make an ATH of around $500 before the whole thing crashes and burns to the ground like the dot com bubble.
1W
1D
4h
2h
Here is what I see right now.

NYA LOW DUE JAN 10 WEEK I need the nysi to get down to a from the 500 area to a minus 600 I have siad the avg drop in nysi if it fails at the 500 which it did should drop an avg of 1100 basis points . no change till that outside of C wave crash to which I THINK WE JUST STARTED SEE THE SP CHART POSTED THE ENDING OF WAVE B UP Look for a sharp C wave down. AND I think that will be wave A i.t. only BEST OF TRADES WAVETIMER


DIA (Dow Jones ETF) - Support, Resistance, Trendlines 2021 - DayDIA (Dow Jones Industrial Average ETF) - Support, Resistance, Trendlines - 2021 - Daily Chart:
-Resistance Price Levels (colored horizontal lines above current price)
-Support Price Levels (colored horizontal lines below current price)
-Trendline Resistance (diagonal yellow lines above current price)
-Trendline Support (diagonal yellow lines below current price)
note: chart is on log scale.


S&P 500 bouncing off 2009 resistance lineS&P at the top of it trading channel bouncing off of the resistance line. This line so far has provided a clear limit for the S&P, and you can see where it has done this several times before. So far it has always ended in a sizeable correction. If you look at the 2014 range, you can see that it effectively hit this line 5 times before a major correction. That means this could continue along for several months, with possible several opportunities to buy sizeable pullbacks and clearly places to take profit.
1W
1D
4h

Bullish Next Week on IndexesFor Next Week (Indexes)
- SPX, DJI, and NDX are diverging (I expect to see an upward impulse rally from each of these); we could potentially see a morning down spike, but I "do not" expect that to hold and markets (in my opinion) will reverse late into the morning to the upside.
- We should see the Semiconductor stocks within the SOX start to have some real issues going into next week for potential short term and long term expiration Option Puts.
Remember:
SPX is the major index itself, SPY is an ETF that tracks the SPX, /ES is stock market index futures, but all correlated. (~ 505 stocks in SPX)
NDX is the major index itself, QQQ is an ETF that tracks the NDX, /NQ is stock market index futures, but all correlated. (~ 105 stocks in NDX)
DJI is the major index itself, DIA is an ETF that tracks the DJI, /YM is stock market index futures, but all correlated. (30 stocks in DJI)
Media:
Lots of news in the media around Covid and it's evolutions; however, the market has known about this for weeks. The market was showing signs 1 1/2 weeks ago a trend change was coming -> the Covid evolutions was the excuse the market needed to deleverage (that was going to happen regardless). Markets always look for a reason to justify the moves up and down -- the media and talking heads do the same thing. Just like indicators, these "post events" are all lagging to what the markets were already signaling. Do Not allow external elements dictate what you're seeing in the charts -- too much of media and articles have "personal intentions" always keep that in mind. And every comment illustration on a Press Release or sponsored article have disclaimers of "forward thinking assumptions" and some disclose "payments from the company for their article and/or provide disclosure of their positional holding(s) in the very item their discussing."
Notes:
Running a few calculations tonight on the SPX (S&P 500). Perhaps this is the geek in me considering I spend most of my days in AI robotics programming labs as an analyst and data scientist. Most people are not pointing this out. Not the people bragging their “highly sophisticated” algorithms, trading platforms, talking heads on televisions, etc. blah-blah-blah.
We are at an inflection point within the markets. Let’s take all the human emotional thinking and “what-if scenarios” out of the equation and focus purely on statistical math and probability theory.
Do not get caught up into WHY the markets are “going up” or “going down.” Must get that nature of our consciousness out of the equation. This is also the same reason why many enter into trades and lack the capability to cut the bad ones early.
We call this the visual illusion where the brain develops (or blends) our perception of reality and expectations -- this can be applied to the markets because we want an expected outcome.
Now let’s look at what everyone else is not talking about because the media and industry is using their visual cortexes from what they see on television and processed through hearing.
Starting Feb. 21, 2020: The markets fell for 30 days and 20 hours a total of -1,124.54 points (-10.36%).
Starting Sept. 2, 2020: The markets fell for 21 days and 20 hours a total of -378.66 points (-10.55%).
Starting Oct. 12, 2020: The markets fell for 18 days a total of -315.91 points (-8.90%)
Starting Sept.3, 2021: The markets fell for 30 days and 20 hours a total of -262.51 points (-8.90%)
Starting Nov 21, 2021: The markets fell (thus far) for 11 days and 4 hours a total of -248.71 points (-5.24%)
S&P 500 Trigger levels We just took out yesterdays low so we need to monitor that along with our VIX post

DIA 4h movement startedThe chart is obvious. There is a long position which emulate my order.
I'll try to update the idea.

Dia Chart SIGNAL by Sajjat Hossen #Dia 4H Chart SIGNAL by Sajjat Hossen
⚠️ Risky Call ⚠️ Because Of Bitcoin.
Entry ✅ If 4H Candle Close Above $1.94
Stop-loss ❌ If 4H Candle Close Below The $1.65
Sell Target 👉 2.25 - 2.50 - 2.75 - 2.99 - 3.25
1D Chart,,,,

Binance: DIA buy / long 1DBinance: DIA buy / long 1D
Entry:1,7 - 1,8
SL: 1d close below 0,96
TP: 2,4
TP2: 5,6

🔮DIA- didn't make it last round, will it fly now?I thought I'd just re-post this as a reminder, because everything from the last months publication is still valid. BINANCE:DIAUSDT didn't make it last time. The price left the formation in a sideways movement, which at this point has turned into 2months+ of consolidation on key level/200EMA. It is safe to assume that another breakout attempt will come soon. And if it won't- well, then DIA will be of the biggest disappointments this season 🤣🤣 But it's ok, it's part of the game we're playing.
Previous post:
--------------------------
About DIA:
DIA (Decentralised Information Asset) is an open-source oracle platform that enables market actors to source, supply and share trustable data. DIA aims to be an ecosystem for open financial data in a financial smart contract ecosystem, to bring together data analysts, data providers and data users. In general, DIA provides a reliable and verifiable bridge between off-chain data from various sources and on-chain smart contracts that can be used to build a variety of financial DApps.
DIA is the governance token of the platform. It is currently based on ERC-20 Ethereum protocol.
The project was founded in 2018, while the token supply was made available to the public during the bonding curve sale from Aug. 3 through Aug. 17, 2020, where 10.2 million tokens were sold.
Source: coinmarketcap

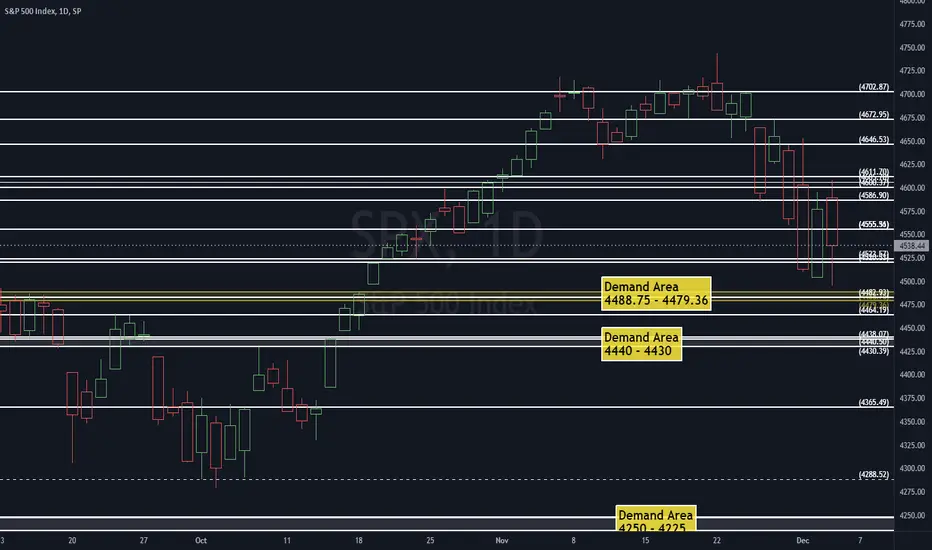
SPYThe S&P is under some selling pressure, which we can see in the upper vwap levels.
What we are looking for is to see if we gain or reject the upper vwap levels if rejection look for us to challenge the buyers at the lower vwap levels.
