$DIA, Levels to watch$DIA
Levels to watch as its showing a 1st UCTS Buy signal on the daily w/ very high volume..
#DIA
DIA

BULL WANDERING INTO A BEAR DENPRICE vs MOMENTUM forming a compression divergence. Notice the lower indicator and the trend on both sides. Price has been broadening the last few years while momentum/strength has been compressing. This is a hidden bull diverging into a massive bear divergence with the potential for a 3x touch here soon. Hidden divergences are historically weaker than regular divergences so the odds are in the bear's favor. We'll just have to see which one the CB's are rooting for.

DIA / BTC falling wedgeDIA / BTC
🌟 TECHNICAL ANALYSIS 🌟
Perfect falling wedge
Found local support at 650-720 sat
RSI = oversold and bullish divergence
If the local support hold and breakout happened
We can set a nice order
Good luck and happy trading 🌹

DIA breakout of trianglelooks like it will challenge the descending channel resistance at $1.55. Breakout of the channel has a measured move to $2.974


𝗗𝗼𝘄 𝗨𝗽𝗱𝗮𝘁𝗲: $YM_F Daily. 🎅🏼📈 into Year End?Held support area ~$26K and channel broke out to new ATH. Over $30K and will likely see a 🎅🏼📈 into year end
$DJI $DIA $SPX $SPY $ES_F $NDX $QQQ $NQ_F $VIX #DowJones #ElliottWave #Trading #Stocks

✳️DIA/USDT (31/10) #DIA $DIA #DIAUSDTDIA has returned to $1-1.05 zone as our previous analysis mentioned. We could buy DIA in this zone because there is a high possibility that DIA will increase strongly over the next few days. Targets should be 1.4 - 1.8 - 2.1$
We need to keep an eye on the $1.4 zone as this will be the most important resistance for DIA.
📈BUY- LONG Strategy
- Buy as close to $1-1.05 as possible, stoploss if 1D candle closes below this zone.
📉SELL-SHORT Strategy
- Sell at $1.35-1.4, stoploss if the 1D candle closes above this zone.
- Sell at $1.75-1.8 for some profit, stoploss if the 1D candle closes above this zone
- Sell at 2.05-2.1$, stoploss if the 1D candle closes above this zone
♻️BACK-UP Plan
- Buy at $0.8-0.85 if the 1D candle closes below $1, stoploss if the 1D candle closes below this zone

DIA Slicing through the fib levelsNow that the sell walls are falling one by one, DIA is cutting through the fib levels like butter and with Kucoin due to buy back the $3 million of hacked coins by 22nd November, DIA will be unstoppable.

DIA Fights To Move Up, Now Back Above SupportDIABTC broke below support (here marked with a blue dashed line) but managed to pull back up.
Prices are also above EMA10 and EMA21 on increasing volume.
The TD Sequential is looking quite good/bullish... This pair can print a bullish move in the days to come.
Our first and main target for DIABTC daily is set around 0.0001040 and 0.0001090.
This price range coincides with EMA50 and the 0.786 Fib. extension level.
Use this information to your advantage as you see fit.
This is not financial advice.
You need to build your own plan/strategy before you trade.
Thanks a lot my fellow cryptocurrency trader for your continued and amazing support.
Namaste.

NDX/QQQ H16: BEST Level to SHORT IT +15%/+30% gains(SL/TP)(NEW)Why get subbed to me on Tradingview?
-TOP author on TradingView
-15+ years experience in markets
-Professional chart break downs
-Supply/Demand Zones
-TD9 counts / combo review
-Key S/R levels
-No junk on my charts
-Frequent updates
-Covering FX/crypto/US stocks
-24/7 uptime so constant updates
NDX/QQQ H16: BEST Level to SHORT IT +15%/+30% gains(SL/TP)(NEW)
IMPORTANT NOTE: speculative setup. do your own
due dill. use STOP LOSS. don't overleverage.
🔸 Summary and potential trade setup
::: NDX/QQQ H16/candle chart review
::: market disconnected from reality
::: YTD gains > 40% not sustainable
::: huge surce in COVID cases
::: massive lockdowns
::: economy melting down fast
::: bearish fractal in progress now
::: XABCD BEARS point D at 12 800
::: short-term bullish/more gains
::: HOWEVER heavy resistance overhead
::: 12 800 points heavy/final resistance
::: get ready to SHORT from overhead
::: BEARS will take over soon
::: lower risk setup is SHORT
::: get ready to SHORT HIGH later
::: once we hit resistance at 12 800
::: TP BEARS TP1 +15% gains TP2 +30% gains
::: SHORT/HOLD setup with great risk:reward
::: BEARS TP FINAL is 10 000 points
::: recommend to SHORT/HOLD
::: recommended strategy: SHORT/HOLD
::: 12 800 reversal level to SHORT IT
::: SWING trade setup do not expect
::: fast/miracle overnights gains here
::: good luck traders
🔸 Supply/Demand Zones
::: 10 000 fresh demand zone
::: 12 800 fresh supply zone
🔸 Other noteworthy technicals/fundies
::: TD9 /Combo update: N/A
::: Sentiment short-term: BULLS
::: Sentiment outlook mid-term: BEARS

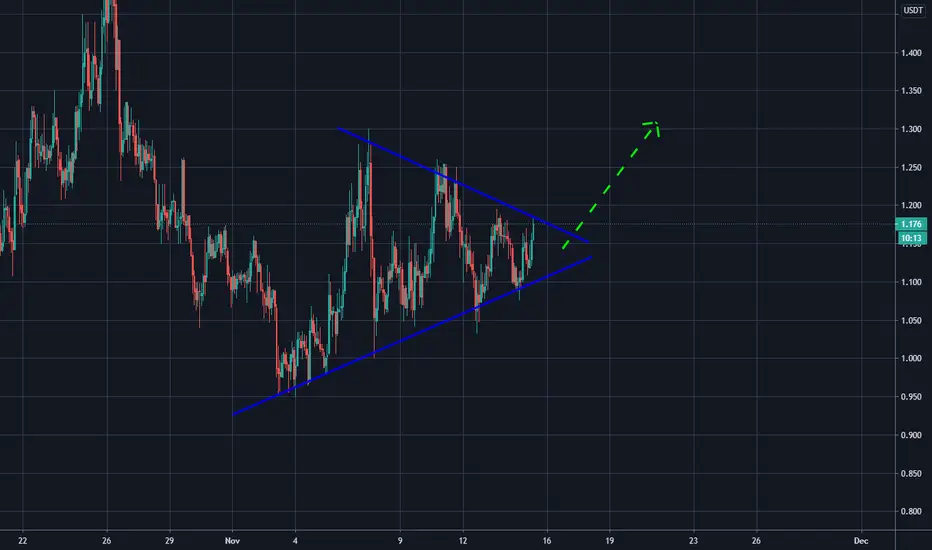
DIA Waiting to EXPLODE! 🚀DIA is currently consolidating within a bullish pennant, breakout likely very soon! 🚀
DIAUSDT UPDATEIF IT BREAKOUT BY UPPER LINE THEN IT WILL BE A BULISH
ON THE OTHER HAND IF IT BREAKUOT BY LOWER LINE IT WILL BE A BEARISH...

DIA: Ready to Fill the GapDow has shown recent bullishness however that might be coming to an end soon. We gapped up today over a low volume area but we have several confluent supports coming up in that zone including anchored vwap, moving averages and trendlines.
I do expect us to retrace and fill at least some of this gap, but we may go lower to test the vwap's and moving average supports.
On top of that, we also have our moving average delta indicator beginning to turn down which signals the momentum of a move or a possible reversal, in this case it looks like downward momentum is gaining.
Of course we could get news to send us higher but I have a lot of concerns with the gaps beneath us and the volume support. I am short term bearish on the dow because of those reasons but things could always change!
Ideally, the bulls need to gain control above the bottom wedge trendline for me to have bullish confidence.
AMEX:DIA

$DIA : Waiting for a break ?$DIA seems sexy on USDT & BTC pairs
But $BTC is the king - Hope to see a consolidation to help some coins to move.
DIA is DeFI + Oracle

DIA/BTC 1D LongThis is not a recommendation, you are trading at your own risk.
I am looking after this project.

$DIA REMAINS WEAK (STILL BEARISH)* TAKE AWAY FROM POST: We're expecting to see
*NOTHING HAS CHANGED, still seeing the Possible second wave of implosion
Minimum target is 15% in blue.
Although we are still seeing weakness in the market, it is imperative to remember that this is a longer time frame.
Meaning, It could take weeks/months before we start to see significant price movements.
We also believe that we could see a climatic top (10-20%), since the price is ranging above major support/resistance level, before the market shifts.
***As always, let's talk about it***

Trump snubbed off a depression...Markets Predict a Trump 2020 Landslide!
DOW
SPY
NDX
BTC
GOLD
SLV
All boats are going to rise!

US30/DOW 16H: Massive CRASH or PULLBACK? End of Year Rally?Why get subbed to me on Tradingview?
-TOP author on TradingView
-15+ years experience in markets
-Professional chart break downs
-Supply/Demand Zones
-TD9 counts / combo review
-Key S/R levels
-No junk on my charts
-Frequent updates
-Covering FX/crypto/US stocks
-24/7 uptime so constant updates
US30/DOW 16H: Massive CRASH or PULLBACK? End of Year Rally?
IMPORTANT NOTE: speculative setup. do your own
due dill. use STOP LOSS. don't overleverage.
Tagged as SHORT because short-term I expect
more losses before reversal BULLS later.
🔸 Summary and potential trade setup
::: US30/DOW H16 market overview/outlook
::: please review my other idea in VIX
::: because that's the foundation of this
::: trade setup as well
::: price currently stuck in RANGE MODE
::: However: strong rejection/ DOUBLE TOP
::: means we will get more follow-through selling
::: STRATEGY: SHORT RIPS/RALLIES
::: Bears EXIT at 26400/26000 points
::: Expecting MILD downside next 1-2 weeks
::: regardless of the outcome in the US Elections
::: Initially we will get selling
::: And volatility spike in VIX (up to 40%)
::: then reversal in VIX and US30/DOW
::: recommended strategy: WAIT FOR FIX SPIKE
::: to 45.00 and then ENTER LONG US30/DOW
::: near 26 000 points - best RELOAD BULLS
::: TP1 BULLS 29 000 points TP2 BULLS 29 500
::: fully expecting END OF YEAR RALLY
::: no fast/miracle gains here - patience required
::: good luck traders
🔸 Supply/Demand Zones
::: N/A
::: N/A
🔸 Other noteworthy technicals/fundies
::: TD9/Combo update: N/A
::: Sentiment short-term: BEARS/PULLBACK
::: Sentiment outlook mid-term: BULLS END OF YEAR RALLY

Dow Jones Fractals with 1929Will it happen again?
"History does not repeat itself, but it Rhymes" - Mark Twain

$DIA Inverse Head & Shoulders Pattern Spoiled! +395% Potencial DIA (Decentralised Information Asset) is an open-source oracle platform that enables market actors to source, supply and share trustable data.

DIA/BTC 4H NeutralThis is not a recommendation, you are trading at your own risk.
I am looking after this project.


DIA/BTC (Bearish Pattern Confirmed)💎Technical Analysis Summary💎
BINANCE: DIABTC
-The Bearish rising wedge pattern has been confirmed
-The trendline support finally failed and the Bears entered the market
-If there will be follow-through by the Bears in the coming hours or days
-The downside target is around 900s sat area
A big Thanks for donating 💰 via Tradingview coins this week to billstenzel 🙏🎉
``````````````````````````````````````````````
Trading Involves High Risk ⚠️
Not Financial Advice 💸
Please Exercise Risk Management 💱
``````````````````````````````````````````````
Thank You All!🙏😊💖For Supporting My Channel 📺
Through Leaving A Thumbs Up, Comment & Follow 💬
Happy Trading!😊💕💖
``````````````````````````````````````````````
