SPY - Did We Bottom, Or Is Manipulation Coming?In my preceeding posts, I'm actually "bullish" on equities in the fourth quarter.
SPX ES - Welcome To The Fourth Quarter Rodeo
Nasdaq Futes - You Wanted a Dip For That 'Santa Rally,' Aye?
And while I think this price action, coming on the back of news that the US Treasury will "only" issue $10 billion more worth of bonds this quarter (compared to like $160 billion last quarter), indicates that not only are we bullish, but going to take out the all time highs before year end...
I have reservations on this SPECIFIC price action being "The Bottom".
Before we go further, I will use the early space for those with low attention spans to warn you about the situation in Mainland China.
The Chinese Communist Party is the scourge of humanity that seeks to use all beings to destroy all beings. Xi Jinping is its head, and the Party will fall. When you kill a dragon, you kill it by chopping of its head.
But before you chop off its head, you often cripple it by chopping its tail. Former Xi Premier and right hand man Li Keqiang was killed by "a heart attack" recently, which is almost certainly code for the "Wuhan Pneumonia Pandemic."
The Party's 24-year persecution, and organ harvesting genocide, against Falun Dafa's 100 million practitioners is a sin that 100.00% guarantees the Party's destruction.
And that means it guarantees Xi's destruction, so long as he doesn't drop the CCP Gorbachev-style in time.
It does not look like Xi is that intelligent of a man to do that.
And so whatever bullish nonsense is arranged by Wall Street, who frequently sleeps with and transfuses blood to the Jiang Faction of the CCP, who are the architects of Falun Gong's persecution and the real evil force behind the Party and "China," to make sure that Communism globally can stay alive until the ruthless end, is subject to abject, merciless, brutal, and sudden truncation.
Meaning any rally can be annihilated by international events that are beyond the control of the so-called "controllers" at any time, for we fundamentally exist in a Cosmos that is inherently Divine.
There's some flaws on the SPY ETF, which is meaningful, because as I say many times, life revolves around banks and funds selling options and making sure they expire worthless.
When we look at the monthly:
October took out the June low, as I predicted earlier, but came up like a dollar shy of entering into the April wick.
Moreover, when we look at the weekly:
Which shows us more clearly the April-May double bottom is just 1%~ lower than the October low, and the $400 psych level is just 2% lower.
With this kind of a squeeze happening only 3 trading days into November's candle, and failing to take the high, we're primed to set up for an "outside bar" November that takes out BOTH the low AND the high of October.
But what this would mean is we're about to dump below the October low, where the real buying opportunity is.
But two problems with the theory are:
1) There's no news drivers next week except for Jerome Powell talking on Thursday.
2) The bull thesis has to complete by December 31 and we're running out of time
But that being said, when we had the October bottom last year, we had a 3-day 6% rally to open October before it turned around and took out the low and then rallied.
And when we had the COVID bottom because the Fed slashed rates to zero and started buying equities, the market had a 10% rally over the course of a few weeks and gave almost all of it back before setting the biggest highs of all time.
So this kind of manipulative behaviour is consistent with the market makers.
How to trade it? Well, if it doesn't go down next week then just blindly long anywhere and so long as you aren't buying calls with 0 or 3 days to expiry, you should be okay.
If it does go down, buy near the October low and under the October low.
The problem is no short setup has manifested as of Friday close, and so we can only sit on the sidelines and look for longs. Whoever was bigly long from Monday or last week should really have taken significant money off the table, cashing in and realizing those gains, this afternoon.
Don't forget the Dollar Index stopped just short of $108 and that's a big sign of coming manipulation and that we're too early.
This is how algorithms are programmed.
Good luck.
DIA

THE SHORT SQUEEZE BULL TRAP The chart posted is that of the DIA this is my top wave count The short squeeze .I see this as wave A up within the bear we should now see a 3 way drop back to 50 to 618 5 of this rally if not a retest near .786 from this we should see wave C up once again just past today peak . Then THE BEAR PHASE should be seen . For my view to change The IWM and RSP would have to break above the july high odds at 15 % as we hit the targets in IWM 161.8 and rsp the sp held 4107 a 500 point drop this is now wave 1 of C down we are in wave 2 up the most this should see is 4415 BUT I doubt this . The VIX is setup for a rather BIG up move

VIX WARNING RALLY is SHORT COVERING SQUEEZE like I said The chart posted is the VIX of the VIX the VVIX has the cycle which I stated on monday and friday last week a short squeeze is now setup as the13.8 to 15.2 week decline would see a sharp rally. And that the IYT RSP BA and TNX were making a ending of a 5WAVES pattern we are only going to see an ABC rally and the last 5 days have been wave A so CAUTION I think the wave strurture in TLT is that of a wave 4 it should not get above 88.3 if that is the correct count then we will see a print of 81.5 to 79.6 and the VIX will be well into 29.6 to 38 so take any profits NOW

Nasdaq Futes - You Wanted a Dip For That 'Santa Rally,' Aye?The equities markets have spent the last three months liquidating bulls, and then liquidating bears, and then liquidating bulls, because the markets are primarily a scam for big money to sell options and have them expire worthless.
No matter what system you use or whose ideas you follow, you're always just guessing, because the computers can take price and do whatever they want at any time, because there's more stocks than there are money and more money than there are stocks, all concentrated in the hands of a few select banks and funds that are really just running crowdsourced cloud algos that communicate with time stamps and decimal fractions.
It's just another scam to bankrupt people and then blame you for being bankrupt.
There's nobody this society hates more than poor people and depressed people, and no Communist Party-funded causes are paid to campaign on behalf of the poor and sad, unless it's to lead them to "Medical Assistance In Dying" (MAID; see Canada).
2023 started off uppy in a straight line, and there's no reason to believe that's going to correct until the timestamp on the market making algorithms has a year date of 2024.
Which means that this bearish impulse is just that, a bearish impulse, that may be seeing its likely finale as early as this coming week to end the October monthly bar, as the next FOMC rate decision is October 31 and November 1.
I'll provide my warning to bears and bulls alike at the early stage of the post, because I know social media and drugs have given people the attention span of children addicted to sugar and cartoons.
Did you know that Li Keqiang, former Premier of China and second in command of the Chinese Communist Party behind Xi Jinping died on October 27, "of a heart attack"?
I have been warning for years of two things:
1. The CCP is actually about to fall, and is almost entirely certain to take Xi, an idiot, to its grave with it.
2. The death toll from the Wuhan Pneumonia pandemic (not to be confused with SARS-CoV-2/COVID-19) is insanely scary and completely covered up by the regime.
And now we're seeing public evidence that even the Xi Faction's main network are being dropped. Keqiang was only 68 years old, which is not very old for a CCP member.
Former Chairman Jiang Zemin, the architect of the persecution and organ harvesting genocide against Falun Dafa's 100 million students, allegedly lived to 96, by comparison, before turning to a pile of crematorium ashes and being thrown out of the very Cosmos by the Wind itself.
All of the above is to say that the year end rally is likely arranged by "the controllers," and yet they're just mice and men, and what can actually unfold before we see 2024 is entirely in the hands of Heaven Himself.
Let's look at monthly bars:
Three mediocre red months after a series of bigly big green months isn't bearish. To the contrary, it's bullish, but it's a question of how you can finance your timing to stay solvent while the market is irrational.
Weekly bars give us more clarity:
What we're really dealing with is a meagre 12% dump over 15 weeks.
And you're going to say to yourself that 12% is actually a lot on the indexes, and I will agree with you. However, it's really not when you take a look at a pair of twin 6-7% bounces that occurred over the span of 6 and 10 trading days in the mix.
And when you pair this with the reality that the market turning around and taking out the July high is just a paltry 17% rally from the 13,750 potential reverse point, over the course of two months, bears are set up to get absolutely annihilated before the real show starts in 2024.
Nothing about the way the markets have traded indicated we have bottomed *yet*. So what we do is, instead of GoInG LoNg oN ThE DiP and getting into the same trap as Disney, Paypal, and AT&T longtards, we simply look for reversals at 13,750, because it's the August of 2022 high, and 13,480-13,550, because 13,500 is a psychological number, and go long on a reversal pattern.
If this theory pans out, not only will the indexes take out the July high, but, the Nasdaq especially, may very well take out the All Time High.
If you were to have bought a QQQ $380 call on Friday expiring January, it would have cost you ~$3.25 ($325) with a 19% delta.
If we get another 4% dump on the indexes, you can pick one up for a little more than $2 and be looking at $9-12~ after theta decay for it to be merely at the money by the end of November.
That's equivalent to going long on some penny garbage like MULN or Gamestop and lotterying into a 4 bagger on the MoThER oF aLl ShOrTSqUeEzEs.
The above is to tell you to stop following Wall Street Bets, Wall Street Silver, Stocktwits, and other public relations firm/marketing department-managed dumpster fires, stop gambling on 0DTEs, make less trades, go outside more, and enjoy your life while this planet still lasts.
Once everything is gone, it's gone forever.
Just like Atlantis, the Mayans, and the Dinosaurs.

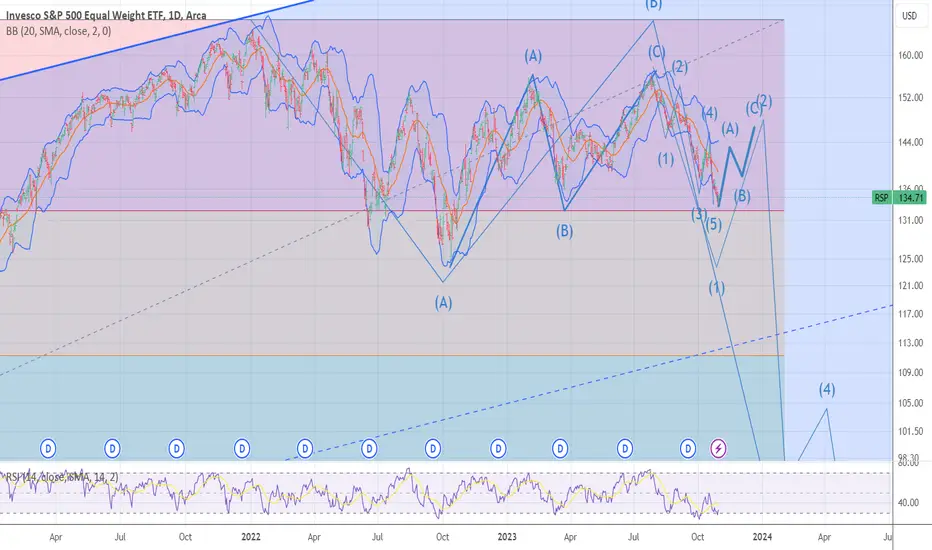
RSP 5 WAVES DOWN WAVE 1 HAS ENDED The chart posted tonight is the Equal weighted SP 500 So far this is the cleanest wave structure of all the indexes and as of tonight I can say this is my Preferred wave count and should be the guide going forward for the next 6 to 9 months . So The rally from the oct low of 2022 rallied in a abc x abc for the students for the rest of you it was a ABC rally it did fall short of a .786 to peak at 75 % W.D GANN and an old friend Don Wolanchuk . since the july 27 turn I can count 5 clean waves down and waves 1 and 5 are equal within .25 of one point at the lows .This is now labeled WAVE 1 or wave A but I lean towards wave 1 of wave C which means we have a much bigger decline coming after the A B C rally back to 50 = 144 to .618 % 147 of the drop from July and should peak into the previous 4th wave which was 143.5 . from this rally we should hear good news . This rally I will mark as WAVE 2 or B Wave 3 or C target is in to targets and both are into a perfect Fibonacci retracement
92 and the alt is 75.6. Has I stated the data for the last 121.9 years shows me the avg bear market is 2.4 to 3.2 years long and the price damage is from 38 to 55 % and the avg is 44 % plus or minus 1.75 % .So has I stated in the first week of July long term holdings should be hedged or sold and into 30 and 90 day tbills !!! I see the odds of 92 being the target as it is also .786 from the march 23 low 2020 and 50 % from the march 2009 low as well. BEST OF TRADES WAVETIMER !
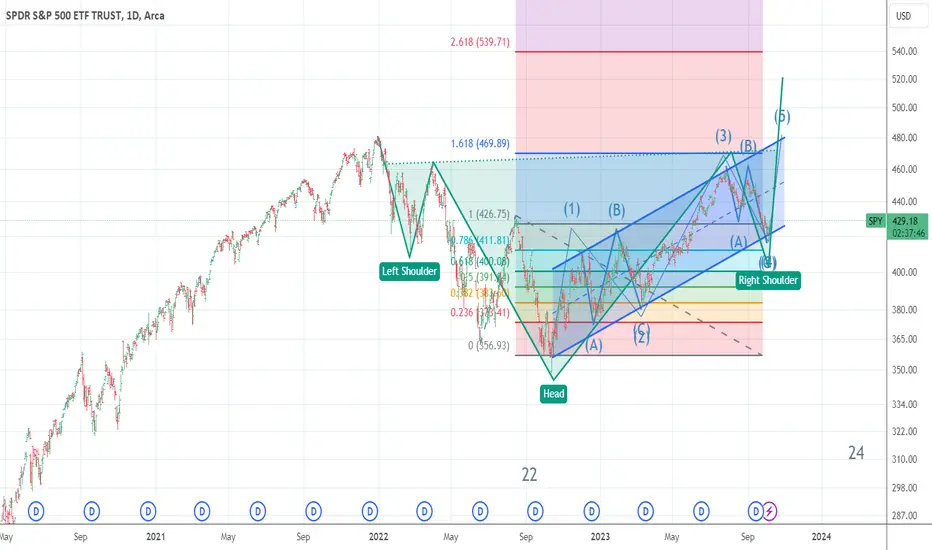
SPY head n shoulder formation we are at or near the end I am posting this chart at this time for what is good reason . The neg cycles from the spiral from 9/11/2001 is nov 3 but as stated we were closed until sept 21 and that is nov13 th so WHY am I going long Reason is the IYT dropped and held my line in the sand at 209.6 and that the DOW retraced to .786 to the tick . is that good enough to take the risk YES by Options and NOT futures .

Three peaks and doomed house Wave B Super Cycle degree.1974/2009The chart posted is that of the longer term super cycle wave B that started from super cycle wave 5 from 2009 low has stated that the 2021 dec forecast super cycle 5 th wave blowoff Parallel to 1907 to 1929 peak and that a correction Bear market would decline at a min .382 of the bull market with the likelihood more like a 50 % decline to 55 % Based on contraction of the FED BALANCE SHEET from 8.4 trillion to min of 4 trillion at a rate of 95 Billion a month has the Fed was at or near ZERO starting march 9 2009 and increased it at a rate of 60 to avg 85 billion per month since march 9 2009. Best of trades WAVETIMER

SPX ES - Welcome To The Fourth Quarter RodeoWhether you want to look at these markets like an American football game or the National Finals Rodeo/Calgary Stampede bull riding, this final quarter of the year is set up to be quite the fireworks show.
The new JP Morgan fund options collar is illustrated on the chart, but let's put it into text:
JPM is the seller of 41,000 calls with a strike of 4,515
JPM is the buyer of 41,000 puts with a strike of 4,055
JPM is the seller of 41,000 puts with a strike of 3,420
Expiry is December 29, 2023.
So if you believe that JP Morgan, the pinnacle systemically important bank in the United States, is the market maker, the crude logic is that the bank is incentivized to:
1. Keep price away from 4,515
2. Drive price towards/under 4,055
3. Keep price away from 3,420
Now, this is cool, but last quarter was an identical setup at similar strikes, and JP Morgan paid the calls it sold at 4,600~ and its own puts at 4,200 expired worthless.
A collar from a big fund is just a position and you should always remember the banks have the money to hedge, and hedge, and overhedge.
And their overhedges, when combining with the psychological effect on both retail and fund-level market participants, can produce greater profits than the simple cashing in of their ostensible public positions.
The problem for SPX and equities bulls right now is that if a new all time high was to be set, we should have bounced to start October. The meaning of this is that filling in the range of the giant June uppy candle is actually bearish.
Because it's fundamentally bearish, we have no reason to believe that downside pivots are not the target. Ergo, we have no reason to justify long trades as more than a single-or-intraday scalp until a significant low is taken.
And that low should involve the May 4,062.25 target.
A raid below that, a consolidation above 4,000, a manipulation raid slightly under 4,000 to eat stops, and then a rip back to take out "resistance" at the 4,634 double top before the end of the year AND possible run the all time high, is absolutely the trade thesis.
A raid on 4,062 happens to put JPM's long puts directly in the money and they'll be free to exit with profit.
Then, the bank can pay or mitigate the buyers of its 4,515 calls before expiry, all while making bears hate their life.
If this all plays out as anticipated, 2024 will be significantly dark clouds. Always keep in mind that 2023 opened in a straight line uppy, and year candles VERY rarely repeat their patterns twice.
What is "the bear thesis" really predicated on? It's not the Federal Reserve or such and such recession.
It's the situation in Mainland China. There's a total worldwide media blackout on what's going on inside China.
But how much longer can the Chinese Communist Party and the boundless and eternal sins of organ harvesting Falun Dafa's 100 million students at the hands of Jiang Zemin since July 20, 1999 continue forward?
The Wuhan Pneumonia pandemic has claimed millions and millions of lives inside the Mainland, and that's before the catastrophes from the Party's corrupt officials itself, and all the flooding and economic damage.
In short, the CCP will soon fall before our very eyes, and everything will change.
2024 Presidential Election theatre in the United States won't really matter.
If you want to have a bright future and happiness, you need to turn off the television, turn off the radio, turn off YouTube, get off TikTok, and go outside and be in your community in real life.
You need to cut the brainwashing and start valuing virtue again, start living like humans again, start thinking like a human again.
Heaven is watching to see who can stand against the Red Demon of the Chinese Communist Party's international "United Front" parasite campaigns.
Whoever can't is considered the worst kind of loser.
But for now, fade the so-called "bottom" at 4,250 and strongly consider buying 3,985.
Just make sure you dump it, dump it again, and cash out at 4,700 or 4,800.
The happy days humans dream of not only never existed, but are forever gone. Everything is about to become stringently serious.

$NDX breaking atm, $SPX will follow, can $DJI & $RUT hold?TVC:NDQ looks to be in SERIOUS trouble at the moment.
IF this is the case then the SP:SPX likely will follow.
DJ:DJI can hold, to a degree but wouldn't bet on it.
Let's focus on AMEX:SPY
Oversold daily BUT WEEKLY it has more room to go.
Also, in comparison to 2022, #stockmarkets are likely FURTHER along than anticipated. The chart we've been showing for some time.
Unless change FAST = 💀

We stopped being bull late Sept $DJI $SPX $NDXInverse Head & Shoulder Pattern on TVC:DJI is dissipating FAST.
(This pattern helps with bottoms)
🚨🚨🚨
It is GONE for CBOE:SPX , in fact, DANGER!!!
TVC:NDQ about to test support again. Could it be a double bottom or will it break through?
AGAIN, we stopped being on the BULL train in late Sept.
RISK is HIGH!!! VERY HIGH!!!

10Y & 30Y Yield losing more steamGOOD MORNING!
#interestrates look like they want to slow down a bit, short term top.
We see the 10Y & 30Y pulling back a bit...
But this is better seen intraday.
We'll see how that unfolds...
IF IT DOES, it could cause a sharp rise in #Stocks.
Coincidentally, DJ:DJI @ support & TVC:NDQ is near a major support.
TVC:TNX AMEX:DIA NASDAQ:QQQ

$DJI & $SPX leading, $NDX trails, but $RUT is shining!DJ:DJI is struggling here a bit but it looks okay, so far.
SP:SPX is in the same boat.
TVC:NDQ has been weaker recently but it moved the most out of the indices.
But look at this! TVC:RUT is shinning nicely today!
Looks like it wants to base here & maybe even move higher!
AMEX:DIA AMEX:SPY NASDAQ:QQQ AMEX:IWM #stocks
Stocks went from pump to dump, what's in store?#stocks went from basing & curling higher to topping and rolling over.
DJ:DJI had 5 green candle days. It turned to 3 red days.
TVC:NDQ bounced nicely but it reversed the hardest and FAST.
CBOE:SPX is in between both indices,
CBOE:VIX had a GOOD day.
WARNING!!! The more it hangs around here the MORE DANGER equities are in.
Have a great week!!!

$SPX almost like clockwork to 2022TVC:NDQ has traded back above the NECKLINE (from Head & Shoulders Break down) - Amazing!!!
DJ:DJI has not traded above and neither has the $SPX.
In this chart we see the SP:SPX illustrating the resemblance to 2022.
We've been showing this chart for some time now.
It's amazing how similar they are trading.
AMEX:TYD is running today (leveraged bonds ETF) likely an anticipated demand for "safety" causing #yields to fall.
SGX:SQQ NASDAQ:TQQQ NASDAQ:SQQQ
AMEX:DIA AMEX:UDOW AMEX:SDOW
AMEX:SPY AMEX:SPXL AMEX:SPXS

SUPER CYCYLE BLOWOFF IS ABOUT TO START MY most BULLISH VIEW .We have now ended a INVENTED HEAD N SHOULDERS BOTTOM THIS IS A WARNING IF YOU ARE AT ALL SHORT DO NOT BE >Five wave down in TLT a major ABC rally is in the cards and should see .382 this would be HUGE SHORT COVERING > I HAVE WARNED YOU IF YOU ARE BEARISH > !!!!!
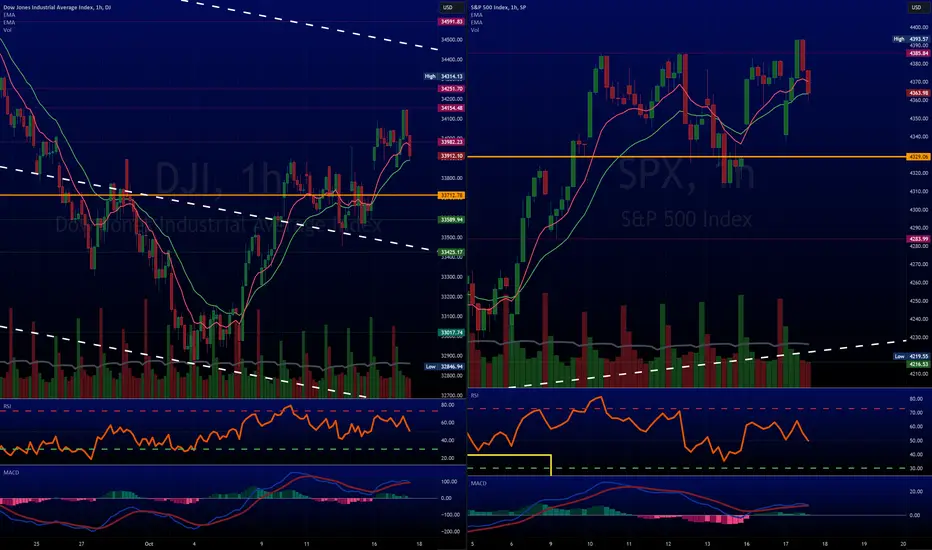
Dow JonesDJI Chart
Checking some TA, which I should have done more thoroughly on SPY, I would have seen the obvious TA screaming we go higher.
Both the SPY and DJI technicals are stating we go higher. RSI, MACD, MFI, and 50MA are pointing to higher moves in the market. In fact, taking a look at the 10YR is another confirmation of where we're heading.

$DJI @ a support level & oversoldStated a while ago, not sure if we posted here but did elsewhere (see profile), that we had short term Treasury exposure @ 50% but it's 75% atm. (it's a placeholder until trend changes)
Should've been shorting the entire time down.
TVC:DJI @ support but this area has not been a strong level.
However, we are severely oversold so that bounce can be close & it can happen here.
Sticking with the idea that large bounces should be sold of shorted until the technical data changes.
#stocks AMEX:DIA

$QQQ Still in Up Sloping Channel NASDAQ:QQQ Until and unless NASDAQ:QQQ drops out and stays out of this weekly channel it seems obvious to me that bulls are in charge. Of course, that can change and quickly but until it does, I remain in the bull camp. This pullback and sideways motion should help set-up more stocks for good entries. All TBD.
So far, (it's mid-day on Thursday so a day and a half to go) we are having an inside week. That is worth noting should it hold thru tomorrow.
Ideas, not investing / trading advice. Comments always welcome. Thanks for looking.

$DJI at do or die!!!This is where we see how serious the decline in DJ:DJI is.
AMEX:DIA has not been this oversold since March of this year.
2nd Pic:
Right side = 15minute chart
The lower part shows the Relative Strength = RSI
At the moment is shows some positive divergence, higher lows as index falls.
This is the battle ground!!!!!!!
Keep in mind that the index has taken a ton of damage technically which is NOT good longer term. At least for now.
#stocks AMEX:UDOW AMEX:SDOW

spy .382 bottom a zig zag in abc donethe chart posted is the spy we dropped in an abc decline into the sept 21/23 panic cycle it has the world so trapped in PUTS see 20 and 10 and 30 p/c I am 100 % LONG 4731

BOTTOM is the SP 500 A double zig zag has ended into the target Last week I talked about the alt wave structure if we failed at 4521 . I stated that if we fail to break above this we would then see a abc or 5 wave drop to 4331/4303 the ideal target 4303 in a perfect world and that the VIX would see 18.8/19.8 worst case if the bull was still within the final advance . I also want traders to review the tlt post THE MAJOR LOW DUE and the DXY . I look for the sp to march to 4666/4731 from here I am now 100 % long and margin of 5 % and fully long calls today I also took a full 100 % long in IWM target has been met . best of trades WAVETIMER

$DJI broke Head & shoulder & long term trend yesterdayDJ:DJI broke the head & Shoulder pattern on daily charts. However, the volume was not heavy.
AMEX:DIA also broke the up trend from the bottom in 2022
SERIOUS DAMAGE has been done the last 30 days.
We can get a bounce here BUT being Friday, not sure.
---
The previous MONTHLY BEARISH moving avg crossover on the DJ:DJI happened in June 2008. We all know that year.
The RSI in 2008 showed clear Negative Divergence & it formed a Doji (cross) at the top.
2008 bear > 14k - 7 = 50%
CV bear market > 30k - 18K = 40%
2022 bear market > 36 - 28 = 22%
---
Using AMEX:DIA as it resembles DJ:DJI pretty decently
IF 2021 was the top, looking more & more likely as:
RSI did not move strongly
2021 showing Negative Divergence
AND the recent rally was SUPER WEAK!
(wanted to see a stronger relative strength)
But rates can now be dropped & they can come and save the day. Very likely scenario in 2024.

I am now 100 % net long wave B low is in place 55 day crash endI am now moving to 100% net long in dia spy and qqq we now have a p/c model buy and we have the 55 daycycle the CRASH cycle is today sept 21 all crashes have been 55 to 62 days from the peak the peak was july 27 th I will now look for a sharp rally to above 4541 and then will assess but fell that the final peak is oct 16th week plus or minus 3 days at or above 4666 to 4731
