BTC diamond#BTCUSDT
$BTC broke out and closed daily above long term support line. price may continue its uptrend to $45k and even $48k.
but I see a diamond pattern that may reverse the trend. $39500 is a support that if broken #BTC price can drop to $30k again.
Diamondpattern

USDCHF H4 TIMEFRAME ANALYSIS (BUY)Both the Diamond pattern or setup and the head and shoulder pattern or setup are major reversal setups. Therefore in this analysis we have a combined reversal setup both happening together. This indicates that we are ready to move into a strong bullish trend. In this usdchf outlook We set our long orders above the current price expecting the trend reversal soon. We know what we are doing and we do what the market is doing. This is more than an institutional analysis. Invest wisely.Thank you for following Newjerusalemforex on tradingview.

Ethereum recent chart patternsAn expansion on my previous post.
A look at some of ethereums recent chart patterns performed.
For now, we await for the diamond pattern to play out and watch for a retest of support or resistance when the breakout occurs.
If it breaks down we will likley experience support at the 0.382 fib.
Otherwise we will likley have resitance at the 0.5 fib which is slightly below the breakouts technical target.
Momentum is starting to shift positive which indicates that the bullish scenario will play out. However, anything can happen.
As always it is important to watch for a retest for the breakout to confirm that it is not a "fake out".

BTC - Potential Demand ZonePrice is finding the Diamond Downslope as support. The lower wicks suggest a potential demand zone, where buyers are accumulating. In the middle of the range, more info needed.

Diamond Midline Back TestThe Diamond Pattern - full of false starts and fake-outs can serve as both a continuation and reversal pattern. Volume on the breaks has been solid.

BTC Short, Fomo guy will be hurtThis is not yet an ascending triangle, we have to draw a line from the higher high to the higher low correctly, but there is a slope angle, so we have to look for a second supporting pattern, after we draw it there is a diamond pattern, meaning this confirms that the market will move down, if the price touches the Fibonacci area 0.5 / 35098$ the fomo guy thinks this is a bulltrap they will sell massively until it touches the 0.618 / 33725$ area before the reversal

BTC - Diamond Pattern BreakAdded the backtest into what looks like a potential bull flag. The target is symbolized by the yellow ruler. The first check point would be the .214, adding fuel to the confirmation.

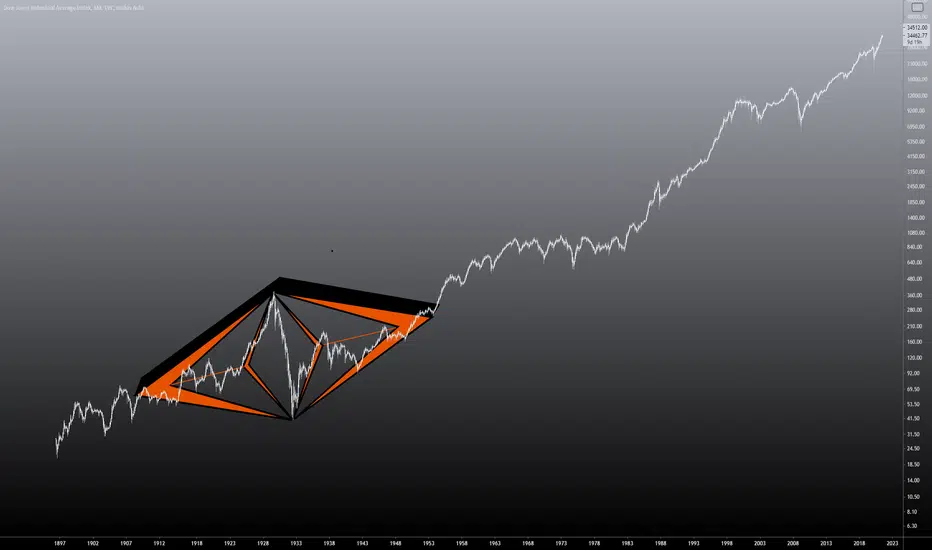
The Crash of 29' - The First Diamond - in 3DThe Diamond Pattern can cause havoc in a trading day. The sharp reversals and reversion to the midline; then onto the continuation or consolidation. Here is our very first diamond, which has echoed through-out the system since. A perfect diamond - a most unholy grail.
Kitex - Strong breakout; Diamond pattern - Positional trade!Kitex can give 65-70% returns in coming weeks.
Channel breakout and Diamond pattern breakout as well with huge volumes.

DIA SPOT TRADING INCREASE TRENDHello trading friends,
Depending on DIA it looks we can meet a new increase trend with a possible 100% increase - it's also a Spot coin.
Manage the risk with a max of 2%.
This chart depending on the price history of trade as you can see in the chart.
# this coin can be a long-term investment, so don't expect a fast move.
Have a good time.

NAS - Technical CorrectionThe bounce is taking a bit longer to develop - watching for a break of 14671 to the high of day. Found CNBC struggling to find a 'reason' for this minor move to the downside after a great run. It's the 10 year or Delta or the Olympics..or maybe just maybe..simple profit taking after the Fed minutes? The 2 hour 8 EMA is above and will offer a first test for the bulls.

Diamond Bottom on BTC - Reversal NearThe chart shows the potential of a reversal pattern. A diamond bottom may indicate a steady downtrend ready to reverse.

KLCI Future Index possible diamond/bullish triangle. 9 June 21KLCI future index price "stalled" at around daily 200 EMA / demand zone and trend line forming a bullish diamond / triangle pattern

AUDUSDLooks like AUDUSD is completing a continuation pattern to reach the upper line of the channel. minimum target is shown on chart.

#LINK, #ChainLink, Who likes #Diamonds?A quick look at #ChainLink (LINKUSDT , 4HR, Binance):
LINK is consolidating after a dip that brought its price from $53 to $15 in two weeks, in what looks like a diamond bottom.
If the price confirms a breakout, we can see higher prices.
Strategy:
Hit the TP1 target, or
Exit after 50 candles, or Stop loss
If you want to read more about ChainLink on CoinMarketCap, click here .
What do you think?
Still learning here, so any constructive feedback and positive vibes to improve my analysis are welcome.
But if you enjoy my chart, please like, comment or follow me. :)
Thank you and Happy trading!
------------------------------------------------------
Some of my charts represent actual trades, and some are just paper trading.
Needless to say, this is not financial advice!

VETUSDT diamond pattern$VET broke down from parallel channel , and confirm the support as resistance. now price can make a diamond pattern here that is a reversal pattern, so start a new rally.

BTTUSDT diamond patternBTT broke down from parallel channel, and confirm the support as resistance. now price can make a diamond pattern here that is a reversal pattern, so start a new rally.

Gold. A bit "tricky" on the triangle/diamond pattern. 24 May 21Gold. with clearest pic now on its " triangle or diamond pattern now".Gold..still possible to resuming its uptrend till around 1905-1910.. Where two upper trend line "meet up" with supply zone.
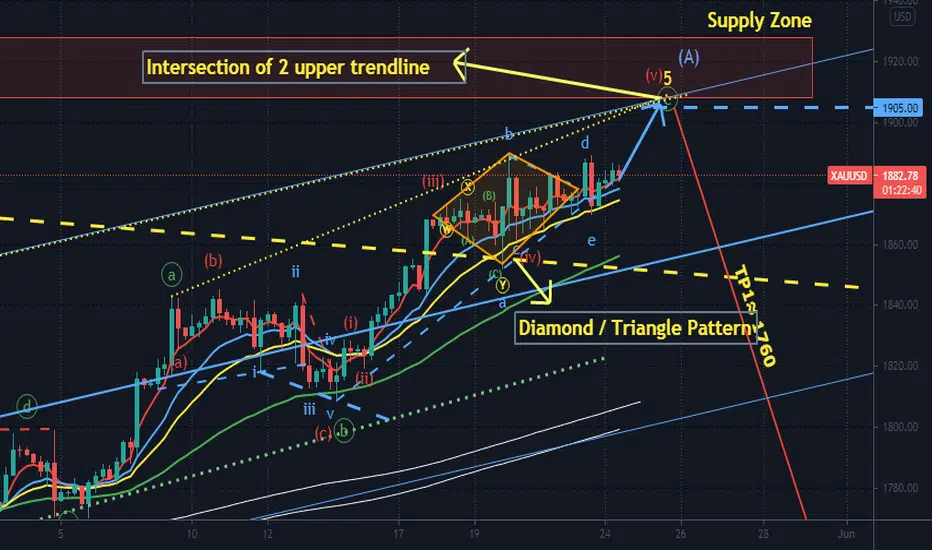
Gold - "Like Diamond in The Sky" -Rihanna. Updated 21 May 21Gold is forming a "bullish diamond / triangle " pattern. SL @ 1852, Tp @ 1905, A risk : reward of about 0.75 : 1 ( not good )( min 1 : 3)

BITCOIN - SHORT TERM DIAMOND - SYMETRICAL TRIANGLE Dear traders,
Here is a quick update for Bitcoin.
We are looking at the 30 minute chart of Bitcoin and see an inverted Head shoulder formation after which a symmetrical triangle has formed. It is in fact also a DIAMOND pattern.
This Diamond comes after a sharp rise and may indicate a possible short term top but the triangle will make it clear with an breakout above or below the triangle.
My last analysis showed big profits with the Diamond pattern but as you know nothing works always for 100%. It is always adopting redrawing the picture to have the most updated charts.
Gyu's on a breakout downwards we may see lower prices and vice versa if the price breaks out upwards.
We see that volume increases in the decline and decreases in the rise. That is a bearish sign. Volume is always very important to validate breakouts as is the same with re-testing trendlines .
Target at breakout upwards 49562 and downwards possibly again USD 30000.
A breakout upwards will also further validate the Inverted head and shoulder pattern form my previous analysis. Target around 50000 USD.
Stops at an upward breakout need to be placed below the last swinglows and vice versa at an upward triangle breakout.
----->> Traders please follow me for updates and if you give me support with a like👍 then that will motivates me a lot to continue💚 - Thanks guy's! <<---
Safe and happy trading!
Disclaimer Traders this is my view no advice to buy or sell. Also always do your own research before taking positions!

ETH CorrectionDiamond pattern at the Top of ETH after strong bullish impulse.
Bearish MACD divergence at double top.
We could see a healthy retracement on ETH.
Let me know what do you think. And thumb up if you find this is good content.
Peace and Joy!
Crypto SolArb

Diamond pattern forming for EthereumThere's a diamond pattern in play for Ethereum which could resolve in a huge breakout.
the RSI Indicator shows an underbought market, which means that the chance is higher to see an upside breakout of this diamond pattern.
This is no financial advice.

Ethereum ETH bearish diamond pattern is forming.Diamond patterns are notorious reversal patterns. When in a downtrend, a forming diamond could mean the start of an uptrend. Viceversa, when in an uptrend, a forming diamond could mean the start of a downtrend.
In this chart i’m identyfing the upper trend line from the previous channel as a new bottom for ETH. I could obviously be wrong and this keeps climbing, or the trend line that i’m identyfing as bottom could be wrong too.
Good luck, and stay safe!
Not financial advice.
