DIS

5.19.2017 Trade Idea: DISIf you are interested in more of our trades, check out our profile and Tradingview Indicator @ChaoticTrader

DIS setting up for double TopNot quite the bearish response I was looking for. I am thinking the travel ban might impact this high flier.

Disney's 20DMA Magic Carpet Ride Over?Disney has been riding the magic middle bollinger band (20 DMA) carpet ride since 10/21/2016. Today we closed below it. Every time there has been a close below it the next day has been positive. However, we are at the top of a long-term channel and based on the weekly indicators, the stock has been overbought for some time now (see below)
I think the next few days will tell us if the stock is going to continue falling back to the bottom of the channel or if it will push through (channel looks awfully like a bullish flag, so this could just be consolidation).

DIS.. so close.Iger better wish upon a star so #DIS can break that R-line. Otherwise, it's a long way back down.

$DIS Long Opportunity or Short Entry if It CrashesDisney recently announced positive news surrounding it's executives chain and has held a strong uptrend over the course of the last few months. If the stock breaks and closes above $112.86 there's a good opportunity to go long and follow the uptrend. If it breaks downward though, and closes below $111.12, then an opportunity for a credit spread or put position opens for a really short term trade due to the bullish bias.

DISNEY (DIS) IS NEARING MAKE OR BREAK POINTOn March 28, 2017 the Disney (DIS) 200 day moving average (MA) crossed above the 250 day MA. Historically this has occurred 27 times. When this happens, the stock does not always continue to rise. It has a median gain of 2.679% and maximum gain of 13.312% over the next 10 trading days.
When we take a look at other technical indicators, the relative strength index (RSI) is at 65.999. RSI tends to determine overbought and oversold levels. I personally use anything above 75 as overbought and anything under 25 as oversold. The current reading declares the stock is slightly looking for direction but trending upward. Per the RSI, DIS has retreated from the overbought level and is moving up.
The true strength index (TSI) is currently 22.1845. The TSI determines overbought/oversold levels and/or current trend. I solely use this as an indicator of trend as overbought and oversold levels vary. The TSI is double smoothed in its calculation and is a great indicator of upward and downward movement. The current reading declares the stock is looking for direction, but has recently began to move up.
The positive vortex indicator (VI) is currently 1.0578. The VI determines current trend and direction. When the positive level is higher than 1 and higher than the negative indicator, the overall price action is moving upward. When the negative level is higher than 1 and higher than the positive indicator, the overall price action is moving downward. The current reading declares the stock is trending upward, but is stagnating.
Considering the moving average crossover, RSI, TSI, and VI levels, the overall near-term stock direction appears to be slightly trending upward. Based on historical movement compared to current levels and the current technical wedge pattern, the stock could gain at least another 1.50% over the next two weeks. Today the stock hit its 52 week high. The question is what will be the next resistance level? The stock has been in an incredibly narrow upward trend channel since January of 2017. DIS could quickly hit the top of wedge and significantly reverse downward. Another resistance level could be 114.75 (which is the 1.50% gain from today's close) which was hit multiple times from October – December of 2015 and is attainable in its current narrow trend channel. Another level could be 120.65, last achieved November 23, 2015, or the stock could test its all-time high of 122.08 from August 4, 2015.

DISney Hitting ResistanceDIS is hitting trendline resistance as well as resistance at the 78.6% fib retracement level. CCI and Stoch both showing bearish signals and in overbought territory. With earnings not for a month and a half look economic and political factors will be at play here.

DIS Gartley pattern reversal zoneDIS reaching the down trend line
DIS completing the gartely pattern
Target 0.236 fib retracement (same as point B) and hopefully lower
earnings on 5/19. No catalysts so far till then


DIS - Upward channel or Rising wedge breakdown short from $108.5DIS was going higher within an upward channel or rising wedge formation. It seems broken down the pattern, retested the broken support and getting ready to rollover. It would be a good short, If it breaks below 50 day MA, and for trade we would consider $110 May-17 Puts
* Trade Criteria *
Date First Found- February 23, 2017
Pattern/Why- Upward channel or Rising wedge breakdown
Entry Target Criteria- Break of $108.50 and MA-50
Option - $110 May-17 Puts
Exit Target Criteria- $104.13 & lower
Stop Loss Criteria- $111.07
Please check back for Trade updates. (Note: Trade update is little delayed here.)


DIS Bullish WedgeClear uptrend with normal growing pains. Bullish wedge suggests breakout soon! Definitely still a buy.
Target: ~115 and beyond! Solid long-term blue-chip.
NYSE:DIS

The force of the house of mouse is strong.Well, indicators say the Mickey Mouse clubhouse is going to be strong for the foreseeable future... assuming no craptastic news from ESPN or any of its properties.

DIS Update - Too hotThis is an update to this chart:
DIS could top out at this level for now, then it could form an inverted head & shoulders to top out once again in the summer/fall of 2017.

0-Cost Options Strategy ahead of earningsSOUND BUT UNEXCITING FUNDAMENTALS
Consensus is favorable on aggregate: Buy recommendation, +12.75% target upside.
Numbers are compelling (5-yr rev growth +6.63% and ROE +20.35%) but growth has been slipping, esp. in TV.
Valuation is un-demanding at a P/E of 17x (now less expensive than the market?)
TECHNICALLY ON A DOWNTREND BUT COULD BE REBOUNDING
DIS has been on a downtrend since the double-top of Aug/Nov 2015.
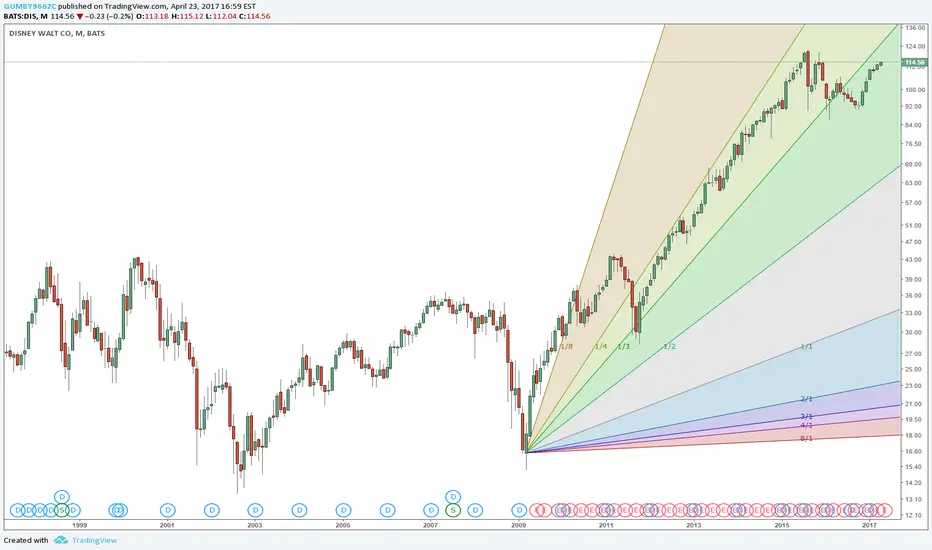
The long-term (M chart) is still clearly negative.
The medium-term (W) shows a series of negative cross-overs and a H&S formation.
But lately the stock has been rebounding with the market and the short-term picture (D) is turning positive.
A close above the 97.00 (MA200) would confirm the positive turnaround.
A close below 90.00 would confirm the negative trend and potentially take us towards the H&S target of 84.00.
EARNINGS AND GUIDANCE WILL BE A KEY CATALYST
What could propel the stock higher are the earnings and guidance from DIS.
STRATEGY: 0-COST EXPOSURE TO UPSIDE IN CASE OF BREAKOUT
Buy Nov 18 2016 $98 call to play the breakout = $0.34/share
Sell Nov 18 2016 $90 put to finance the synthetic long = $0.33/share
Best-case scenario: Stock breaks out ==> Make $ on the call or convert
Worst-case scenario: Stock tanks ==> Go long a quality long term holding close to the 52w low.

$DIS bull flag on the 60$DIS bull flag on the 60 into the .618, nearing breakout of falling wedge on daily.

$DIS looks ready to go *pop*$DIS falling wedge on daily. Recent retracement is golden w/ a .618 touch. Expecting a nice move up


#DIS one more time go long! :)Last time we've earned some on this stock.. now we have the same situation.. strong support.. looks like DIS is in consolidation.. so we can try to get some money. I'll go long.

DIS ABCD MoveCheck this out. It looks a lot like the drop back in December... I'm banking on continuation down.
Short
-Cheers
