AUDCAD - H1 bullish structureD1 - key support
H4 - multiple false breaks + bullish divergences
H1 - bullish structure
Looking for bullish setups during a pullback.
Divergece

CELR/USDT has a Incoming Bullish movement!Hi every one
CELR/USDT has formed a falling wedge! It's a great bullish pattern, after the breaking of this pattern the price can reach the top of the wedge once again! (the resistance is shown in the picture!) and also there is a Hidden bullish divergence on MACD as well which is quite helpful for this bullish pattern.
Traders, if you liked this idea or have your opinion on it, write in the comments, We will be glad.
Things can change...
The markets are always changing and even with all these signals, the market changes tend to be strong and fast!!
Thank you for seeing idea .
Have a nice day and Good luck

110pip hit, already in profit in this next divergence.The last signal i posted went all the way to 110 pips then reversed back to the downside. I would say 110pips is a lot if you capitalized on the move.
If you still want to hop on, check your H1 and look for an entry around the M5 timeframe or the M15 time frame. H1 is to confirm the overall trend price is heading to.
Happy trading !.
If you like this post please leave a like, share, follow and most of all, engage with the post by leaving your thoughts in the comment section.

ethusd analysisin the name of god
Atrium Technical Analysis
according to the price reaching the ceiling of the channel and reaction to it My prediction is that price will decrease
to the channel midline for short time and also we see a negative HD in the MACD indicator that it can to confirm my analysis.

Bitcoin weeklies: A little re-charge before another move up?Will Bitcoin follow its recent pattern -- chop for a few weeks, touch the EMA9 at around 37.5k on the weekly -- before exploding up to $60k+?
Volume has been divergent on this recent uptrend, despite huge squeeze Momo & huge corporate news w/ Tesla. Anchored VWAP on the last move up after a chop would match this shake out.
Volatility has been rising, too, since the bleeding from the March crash happened.
I wouldn't be shocked if it touches $50k as a psychological pivot point before shaking some weak hands.

Huge divergence is formingEOSUSD is forming a huge divergence. It might be too early before it turns, but when it does there is at least a 10% upside - at least. So look out for this one.
Be aware that it could take one more down before going. Ultimately the low would be at. 1.6 - 1.8.


NKE 1H shortNKE is in an uptrend (EMA200 rising on the 1H chart) but there are multiple bearish jeddingen divergences (price vs. momentum), MACD crossed the signal-line and RSI is recovering from overbought levels - all these are indications that the price might fall a bit, before it's rising again.
Profit target is $58.83 (around the weekly pivot)


GBP/NZD Swing TradeThe Price has broken major resistance level and closed above it.
On Daily chart there is a Bullish Divergence. So it's time for correction.
Entry: 1.7670
Stop Loss: 1.7380
Break Even: 1.7820
Target: 1.9500

EURUSD Short for Wave 5, 2618 & RSI DivShort for multi confluences
SL: 1.1140 (45pips = 1R/R)
Entry: 1.1095
PT: 1.1000 (2R/R)


My Scenario NFP for GBPUSD is BullishMy Scenario NFP for GBPUSD is Bullish
After price making new Lowers High and Hidden Bullish Divergence i recomend to buy


YAHOO INC LOOKING UP - LONG#YHOO - YAHOO INC - LONG OPPORTUNITY - SHORT TERM
YAHOO INC LOOKS TO BE ON THE UP SHORT TERM, LONG OPPORTUNITY FINANCIALS SET TO LEAD THE WAY HOPING TO REACH AROUND 45.00 AREA


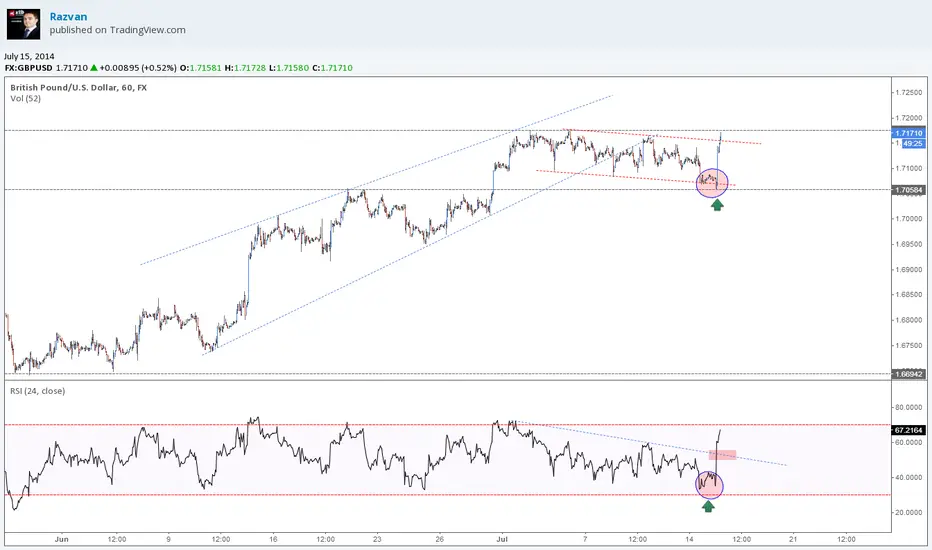
GBPUSD - TA does work :)Can anyone say that Technical Analysis does not work? This is a very nice example of divergence at confluence area.