🚧Bitcoin is Bullish now🚧 & many Traders don't see it 👀!!!Hi.
BITSTAMP:BTCUSD
✅Today, I want to analyze BTC for you in a 12H time frame so that we can have a MID-term view of BTC regarding the technical analysis. (Please ✌️respectfully✌️share if you have a different opinion from me or other analysts).
After the fifth bullish wave, BTC has completed his corrective waves (ABC) and now he has reached the end of the wedge, now it is time to start the five bullish waves .
✅ Due to the Ascending structure of the chart...
🟢 High potential areas are clear in the chart.
🟢 Bullish Wedge.
🟢 Starting 5th waves.
🟢 Bullish Divergence
🟢Falling Wedge
❗ Note that if the WEDGE is broken down with the power of descending candles, our analysis will fail.
Stay awesome my friends.
_ _ _ _ _ _ _ _ _ _ _ _ _ _ _ _ _ _ _ _ _ _ _ _ _ _ _ _ _ _ _ _ _
✅Thank you, and for more ideas, hit ❤️Like❤️ and 🌟Follow🌟!
⚠️Things can change...
The markets are always changing and even with all these signals, the market changes tend to be strong and fast!!
Divergence

EURGBP ShortOANDA:EURGBP
The pair has made a substantial retracement and formed a bearish divergence, which brings an opportunity to sell the pair targeting the major support line.

Two divergences at the same time in #BTCUSD chart#bitcoin has been proceeding in ascending channel. 2 divergences occured while #btc moves in LTF:
1- Hidden bullish RSI divergence (Green)
2- Regular bearish RSI divergence (Red)
Hidden divergence has been playing out after the bounce from ichimoku cloud and continuation is expected till the price reaches 69K or may be even 71K. Also there're great liquidations in these levels. If CRYPTOCAP:BTC claims 69 - 71K and liquidate shorts, then it's likely to be expected that bearish divergence may take the play with minor correction wave or even a dump. If price breakouts above 74K, bearish divergence will be postponed or invalidated, but ascending channel pattern will be secretly on the play.
NOT FINANCIAL ADVICE. DYOR.

AVAX/USDT is about to do a Bearish movement!!!Hi.
COINEX:AVAXUSDT
Today, I want to analyze AVAX for you in a 3D time frame so that we can have a mid-term view of AVAX regarding the technical analysis. (Please ✌️respectfully✌️share if you have a different opinion from me or other analysts).
AVAX reached the resistance but could not break it. Also, we have a bearish divergence on MACD and RSI that the price will soon decline.
✅ Due to the Descending structure of the chart...
- High potential areas are clear in the chart.
- DIVERGENCE ON MACD
- DIVERGENCE ON RSI
Stay awesome my friends.
_ _ _ _ _ _ _ _ _ _ _ _ _ _ _ _ _ _ _ _ _ _ _ _ _ _ _ _ _ _ _ _ _
✅Thank you, and for more ideas, hit ❤️Like❤️ and 🌟Follow🌟!
⚠️Things can change...
The markets are always changing and even with all these signals, the market changes tend to be strong and fast!!

PLTR Bullish Note A NYSE:PLTR s a software company PLTR seems to be doing great and the past earnings weren't the exception. Even when price is down because of a less than prior quarter growth rate in commercial revenue, fundamentals seems solid with the only issue being a very high P/E ratio.
From a technical perspective, the price is resting on a strong support zone and held the current trend line that has been following from october 2023. If the price goes up above the 20 y 50 EMA I would expect it to reach 27.50 that would be the price target of the preceding falling wedge. Let's see.
Target 27.50
Stop 20.40

Bearish RSI divergence in $BTC price short term #btc #bitcoin divergence is on continuation and ascending wedge is about to the resulted with price action. #btcusd has both liquidations at 63K and 71K levels to take. Let's see what happens in this weekend. Not financial advice.


CHF/JPY end of uptrendThe pair is slowing down. The RSI is showing a clear divergence. Price has tapped and reacted to the supply areas (tradable on LTF).
Once the pair breaks the trendline as well as the support I am ready to short.

NZD/USD ShortPossible move to the downside for this pair. NZDUSD is correcting from an uptrend on the HTF, but there might another move to the downside. if the resistance turned support is broken it might be a signal of a further move down. Divergence shows.

impulse-scalp 33x margin quick, scalp (?) ... its looking better since they made me come back and make this longer so idk
looking for 65k expecting 64k. ill star take profit ~63. already did at around 62.75k
just an impulse publish, why the need to have to fill boxes this isn't what i planned on doing and i already took profits so idk what purpose this serves
local trading range - 59.4k(SUPPORT) 64.4K(mid)
65k(resistance)
futures contracts 33x leverage

AUD/NZD shortAfter reaching last month high, the price is going sideways, has created a divergence and a double top. I will be entering a short trade if the price breaks the horizontal line.
TP 1.092

I Cannot Short This !!! situation+next targets.Hi.
KUCOIN:GTAIUSDT
➡️ the odds of another bullish Movement is Pretty high because the pattern which GTAI is in, Is a Bullish wedge Pattern! Since The break out has happened.
✅ Due to the Ascending structure of the chart...
🟢 The odds of another Bullish Movement is High!
🟢 Bullish wedge is Visible on The chart!
🟢 Bullish Divergence
🟢 FALLING WEDGE
🟢The break out has happened
✨Targets are:
🎯$2.7060
🎯$3.0200
🎯$3.5000
🎯$4.0165
🎯$4.5580
🎯$5.0490
Previous Analysis:
Stay awesome my friends.
_ _ _ _ _ _ _ _ _ _ _ _ _ _ _ _ _ _ _ _ _ _ _ _ _ _ _ _ _ _ _ _ _
✅Thank you, and for more ideas, hit ❤️Like❤️ and 🌟Follow🌟!
⚠️Things can change...
The markets are always changing and even with all these signals, the market changes tend to be strong and fast!!

WORKDAY possible reversal & low-risk high-reward setupA few confluences:
- Horizontal support
- Trend lines
- Hammer on rising volume
- Overall the stock outperforms the Index in IBD Style terms
- 61% Fib retracement
- Reverse or Hidden Divergence
If that works - you have a low-risk high-reward setup.
If it doesn't - we'd understand that quickly and move on.

Bitcoin: Dip or Bear Trap?A continuation to my last idea:
The diverging volume delta shows the selling-side domination going down.
You can see I use my Diverging Volume Delta Strategy,
like in my previous chart:
This is a short 4H-Chart analysis that indicates we might see a rise back to 60K or higher.
Disclaimer
The information and publications are not meant to be, and do not constitute, financial, investment, trading, or other types of advice or recommendations.

Regular Bearish Divergence on the 4H UNI/USD (Uniswap)**UNI/USD 4H Chart Analysis**
As we examine the 4-hour chart for Uniswap (UNI/USD), a noteworthy pattern emerges, signaling potential trading opportunities. The price trajectory is forming higher highs, a bullish signal under normal circumstances. However, a deeper look with the Commodity Channel Index (CCI) reveals a contrasting picture. The CCI is making lower highs, presenting a classic case of bearish divergence. This divergence suggests weakening momentum despite the rising prices and could foreshadow a possible reversal.
Moreover, UNI's price movement above the weekly pivot point, which stands untouched at $7.432, draws attention. Typically, untouched pivots act as significant levels of either support or resistance. In this context, surpassing this pivot without retest might indicate it as a plausible target for initiating a short position, particularly if other indicators support a downward shift.
Traders should monitor these developments closely, considering the bearish divergence and pivot dynamics, to refine entry and exit strategies in the coming sessions.

4015_Possible Trend reversal (Bullish setup)4015
**Bullish Points:**
Price at significant support level (Volume profile) confluence with 78% fib level
Bullish divergence is observed
Small entry can be taken now (Aggressive)
Further entry can be taken after descending channel breakout, or
at next support level 118.6 (DCA strategy)
**Bearish Points:**
Price is moving in downtrend, series of LH/LL
H&S pattern breakdown and retest of neckline
Current stop loss is specified
Trail stop loss if price goes up
Place SL below 118 (DCA strategy)

Will DXY break Descending Channel at Support?!Here I have the DXY on the 4Hr Chart!
For the past 2 weeks, Price on DXY has been steadily falling!
With our Highs and Lows marked, we can see that Price is outlining what looks to be a Descending Channel!
If price continues to follow down this channel, I suspect that the ( 105.53 - 105.025 ) Support Zone will be the area price will Most Likely find support to push higher!!
What I want to see is Price test the Falling Support of the Descending Channel for a Third Time with a successful bounce ultimately turning this Descending Channel into a Bull Flag Pattern!
-For added confirmation, once the next low is formed, I'd like to see:
1) The low be Equal too OR LOWER than the Second test of the Falling Support
2) A Bullish Divergence to appear on the RSI so underlying direction
Fundamentally to finish the week:
Advanced GDP, Unemployment Claims, Pending Home Sales (Thur)
Core PCE, UoM Consumer Sentiment (Fri)
-Another big fundamental factor to DXY strength will be the results from JPY Policy Rate decision and Core CPI released Thur!

The last bullish chance of BITCOIN. A Comprehensive Analysis!!Hi.
COINBASE:BTCUSD Today, I want to analyze BTC for you in a 1D time frame so that we can have a mid-term view of BTC regarding the technical analysis. (Please ✌️respectfully✌️share if you have a different opinion from me or other analysts).
Bullish pennant is on the table on Daily timeframe🔍
Looking for a break out and more upside📈
✅ Due to the Ascending structure of the chart...
🟢 High potential areas are clear in the chart.
🟢 AB=CD
🟢 Ascending pennant
🟢 Bullish Divergence
Stay awesome my friends.
_ _ _ _ _ _ _ _ _ _ _ _ _ _ _ _ _ _ _ _ _ _ _ _ _ _ _ _ _ _ _ _ _
✅Thank you, and for more ideas, hit ❤️Like❤️ and 🌟Follow🌟!
⚠️Things can change...
The markets are always changing and even with all these signals, the market changes tend to be strong and fast!!

🚧DOTUSDT is Bullish now🚧 & many Traders don't see it 👀!!!Hi.
BINANCE:DOTUSDT
➡️ the odds of another bullish Movement is Pretty high because the pattern which DOT is in, Is a Bullish wedge Pattern! Since The break out has not happened, there is no confirmation of a Bullish Movement But If It happens....
✅ Due to the Ascending structure of the chart...
🟢 The odds of another Bullish Movement is High!
🟢 Bullish wedge is Visible on The chart!
🟢REEGULAR BULLISH Divergence
🟢 No break out yet!
🟢 FALLING WEDGE
✨Targets are:
🎯$7.830
🎯$8.150
🎯$8.530
🎯$8.950
🎯$9.300
🎯$9.700
✅previous Analysis
❗ Note that if the WEDGE is broken down with the power of descending candles, our analysis will fail.
Stay awesome my friends.
_ _ _ _ _ _ _ _ _ _ _ _ _ _ _ _ _ _ _ _ _ _ _ _ _ _ _ _ _ _ _ _ _
✅Thank you, and for more ideas, hit ❤️Like❤️ and 🌟Follow🌟!
⚠️Things can change...
The markets are always changing and even with all these signals, the market changes tend to be strong and fast!!

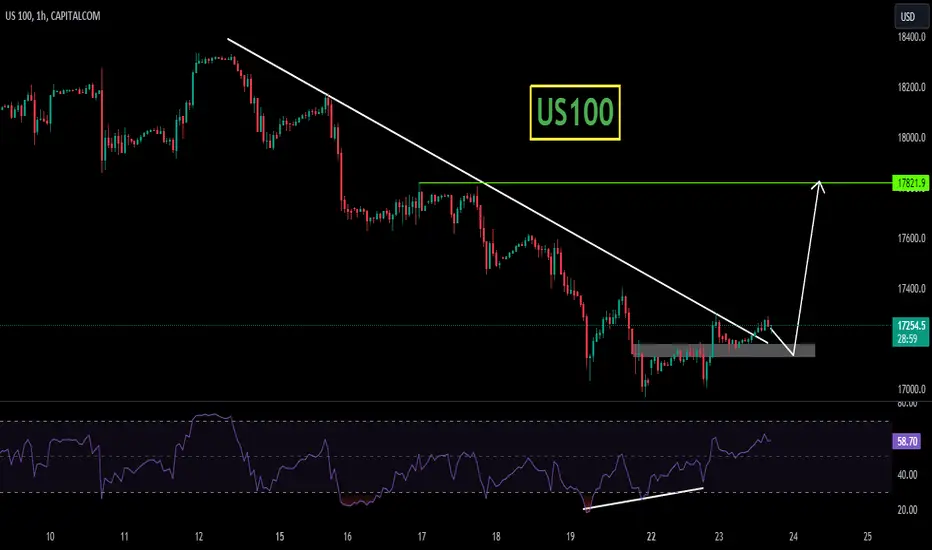
US100US100 is trading in falling wedge pattern. The price was reacting well the support and resistance of wedge.
Currently the price has given the massive breakout from falling wedge and after successful retest of the level will be bullish signal and seems like the price may go for another leg higher.
If the breakout sustain to upside the optimum target could be 17850
What you guys think of this idea?
🐳GTAI will Go Up Again🐳Hi.
➡️ the odds of another bullish Movement is Pretty high because the pattern which GTAI is in, Is a Bullish wedge Pattern! Since The break out has not happened, there is no confirmation of a Bullish Movement But If It happens....
✅ Due to the Ascending structure of the chart...
🟢 The odds of another Bullish Movement is High!
🟢 Bullish wedge is Visible on The chart!
🟢REEGULAR BULLISH Divergence
🟢 No break out yet!
🟢 FALLING WEDGE
✨Targets are:
🎯$2.7060
🎯$3.0200
🎯$3.5000
🎯$4.0165
🎯$4.5580
🎯$5.0490
❗ Note that if the WEDGE is broken down with the power of descending candles, our analysis will fail.
Stay awesome my friends.
_ _ _ _ _ _ _ _ _ _ _ _ _ _ _ _ _ _ _ _ _ _ _ _ _ _ _ _ _ _ _ _ _
✅Thank you, and for more ideas, hit ❤️Like❤️ and 🌟Follow🌟!
⚠️Things can change...
The markets are always changing and even with all these signals, the market changes tend to be strong and fast!!

Potential upside move in EURCADOANDA:EURCAD is showing potential reversal from current zone. It is currently trading in potential reversal zone of XABCD butterfly pattern along with ascending trendline retest and bullish divergence confluence. These evidences suggest a potential up move in EURCAD from here. We can look for buying setups.
