AUDJPY is preparing for a long term declineHi
As you see in the chart there is a very strong negative regular divergence in weekly and monthly TF and we expect a long term decline
Cheers
Divergence

Daily Wedge w/ Divergence Spotted!! - AJHere I have AUD/JPY on the 4Hr and Daily Charts!
Daily Chart-
-We see Price outlining a Rising Wedge and with this the First inclination that we could see Price push down further is the Bearish Divergence shown as the HIGHS on the RSI indicator suggesting Bulls could be losing Power!
-The High created on Feb. 23rd was followed by a STEEP decline in price!! Much of this caused by BOJ rumors of JPY possibly exiting "Deflation" and with the market doing well!
4Hr Chart-
Price had made a Low after the steep decline from the High giving me an opportunity to find a Fib'd Entry Zone and Price had tested it already at the end of last week. To start this week, price as began to work down validating my Bearish Bias on this pair!
Fundamentally this week:
AUD - GDP (Tue)
JPY - Tokyo Core CPI & BOJ Ueda Speaks (Mon)
*Currently in Active Trade

BTCI don't want to clutter the chart too much In my opinion there might be a divergence possibility on the higher timeframe
The reason for my analysis is that it might be better to act a bit more intelligently

"Let's be realistic with SHIB" - Is 2400% realistic enough ?#SHIB/USDT #Analysis
Description
---------------------------------------------------------------
+ SHIB is currently looking to breakout from its resistance zone
+ I see a clear bullish divergence with the RSI and price. Overall SHIB is showing a bullish signs
+ For the long term trade, i'm planning to enter a position at the current price.
---------------------------------------------------------------
VectorAlgo Trade Details
------------------------------
Entry Price: 0.00001133
Stop Loss: 0.00000767
------------------------------
Target 1: 0.00001371
Target 2: 0.00001601
Target 3: 0.00001956
Target 4: 0.00002466
Target 5: 0.00002976
Target 6: 0.00003944
------------------------------
Timeframe:1W
Capital: 1-2% of trading capital
Leverage: 3-7x
---------------------------------------------------------------
Enhance, Trade, Grow
---------------------------------------------------------------
Feel free to share your thoughts and insights.
Don't forget to like and follow us for more trading ideas and discussions.
Best Regards,
VectorAlgo

#XAU #XAUUSD #GOLD #Short #ShortSetup #Eddy#XAU #XAUUSD #GOLD #Short #ShortSetup #Eddy
I'll Think Its Time to short Gold ;-)
In the monthly time frame, it looks like we have the third collision and the completion of the monthly divergence.
What you think!?
Related Analysis of Gold : (( XAU/USD )) : Check Link :

GBPCHF SHORT postionAfter reaching a supply zone for the GBP may be it is time for correction. There is bearish divergence on the RSI 1H timeframe which I am thinking is going to happen. The TP zone could be the eclipse which is on the resistance zone. The other important thing is that the 200MA could be support zone which is not sure that the price will break. Do your own reasearch and please share you thoughts.

Next Nears All-Time High: Key Levels to WatchThe cryptocurrency Next is on the verge of breaking its all-time high (ATH) of $0.41390 on the weekly chart. If the price breaks above this resistance level, it could signal further gains for the token. However, if the price fails to break through this level, it could find support at $0.34618, the next key level is $0.31143.
Technical Analysis:
Resistance: $0.41390
Support: $0.34618
Relative Strength Index (RSI): 65
Moving Average Convergence Divergence (MACD): Bullish
Volume Analysis:
The volume of Next has been increasing steadily over the past few weeks, which is a bullish sign. This suggests that there is strong buying pressure behind the token.
Price Consolidation:
The price is currently in a small consolidation range. However, since the overall trend is bullish, there is a good chance that the price will break out of this range and continue its upward movement. The next support level is at $0.31143.
RSI Divergence:
There is a bullish divergence between the price and the RSI indicator. The price has made a new high, but the RSI has not. This suggests that the upward momentum is still strong and that the price is likely to continue to rise.
Conclusion:
The technical indicators for Next are bullish, suggesting that the price could continue to rise in the near future.
The information provided in this article is not intended as financial advice. Please do your own research before making any investment decisions.

Cerberus sell signal Cerberus observes the ratio between stable coins and the markets to forecast extremes.
We are currently seeing a sell signal. The past sell was a fake out so its worth having a look a how often this can happen and if it has ever happen to see two fake outs in a row.
From 2017, where we can start tracking all the stable coins used in the indicator, we see 15 sell signals. So far only two including the past month one are the only ones that got it wrong. That’s about a 77% right.
What’s more interesting is to notice that there’s never been two signals wrong in a while.
Not financial advice only chart observations.

Bearish RSI divergence on NasdaqHello everyone,
I just found a bearish RSI divergence on weekly chart of Nasdaq. RSI (14) on February 5 was at 73.05 and 72.91 on February 26. Close was 15990.66, now is 16274.94.
In addition there was a bull cycle of 18 bars on weekly chart from March 13 2023 with price increase of 31.54 %, current cycle from October 23 ended with 29.96 %.
And there is a high probability of a drop after reaching the ATH. See June 18 2015, just 4 days after a drop occured with a low on July 7, then another ATH was on July 15 August at 5231.94, this is just 1.01937 % above ATH from 10 March 2000 at 5132.52. Then signiffant drop occured with a low on August 24 at 4292.14, this is 82,03 % of ATH.

NZDUSD Short after a short bullish moveOverall the trend should be our friend. NZDUSD is in big bearish trend and after a sharply down movement it is time for a tiny correction. There is a bullish diviregence on the RSI 1H time frame, which may be is going to happen. Once the correction is done and the price hit supply zone it is good idea to look for a enter after candlestick confirmation or bearish diviregence on some of the oscillators.

CADJPYIs CADJPY exhausting at resistance zone?
As the price is been on high bull run but now it seems like price is lacking bullish momentum after printing double top pattern at resistance level and bearish divergence, suggesting the sell pressure is about to start.
If the bears took control , the 1st target could be 108.
What you guys think of it?

LINK - Perfect Elliot's Wave Flag Bouncing On Support w/OBVBIST:LINK
Chainlink printing another beautiful flag after breaking through resistance onto now support.
The best part is while this is taking place the x-ray goggles of OBV showing us the growing bullish strength via higher highs and higher lows with bullish divergence behind the scenes.
Slowly, and then all at once 🌊👀

NZDJPYIs NZDJPY exhausting at resistance zone?
As the price is been on high bull run but now it seems like price is lacking bullish momentum after printing double top pattern at resistance level and bearish divergence, suggesting the sell pressure is about to start.
If the bears took control , the 1st target could be 91.500.
What you guys think of it?

Divergence spotted, expect reversal. Potential +800% profit.Bullish divergence on the Relative Strength Index (RSI) indicates a promising outlook for BINANCE:COTIUSDT , suggesting a potential uptrend in the near future. This divergence typically occurs when the price of an asset moves in the opposite direction to the RSI indicator, signaling a potential shift in market sentiment.
Moreover, recent price action has shown signs of reversal, further supporting the notion of an upcoming bull run. This reversal is expected to continue its momentum, potentially driving prices higher over time.
For traders considering entry into this market, the current price stands at 0.07180, presenting an opportune moment to initiate positions. Additionally, setting clear targets can help manage expectations and guide trading strategies. The following targets are suggested:
Target-1: 0.13108
Target-2: 0.19075
Target-3: 0.33982
Target-4: 0.45786
Target-5: 0.51000
Target-6: 0.61245
Target-7: 0.69199
It's crucial to implement risk management techniques to protect capital. A suggested stop loss level is at 0.03701, which can help limit potential losses in case the trade does not unfold as anticipated.
Considering these factors, this trade opportunity presents a favorable long-term prospect with the potential for substantial gains. Traders are encouraged to conduct thorough analysis and assess their risk tolerance before making any investment decisions.
Should you have any further questions or require additional information, please feel free to reach out.
Regards,

Double Bottom CONFIRMED! - EGHere I have EUR/GBP on the 1 Hr Chart!
Price had made two very equal lows on the chart but closer look on the RSI indicator and you can see Price really is losing is Bearish influence and is looking to possibly go Bullish!!
This strong reversal pattern called a Double Bottom makes me believe we could see Price push Higher after it broke out CONFIRMATION of Pattern @ .85424 and has come back to test and is already showing signs of finding possible Support @ Confirmation!
INVALIDATION of Pattern @ .85289
First Target Range is .85535 - .85593
Second Target Range is .85687 - .85745

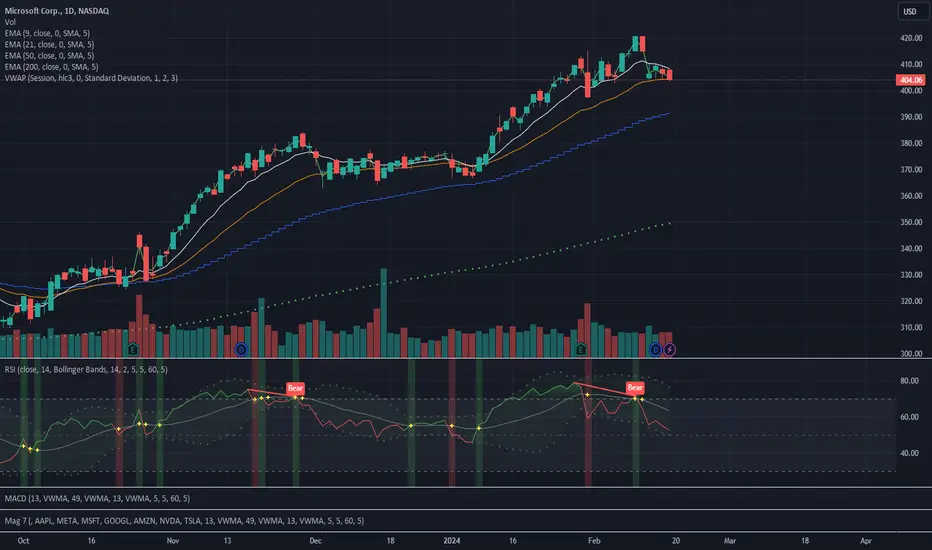
$MSFT Short idea NASDAQ:MSFT is showing bearish divergence on the RSI on the daily timeframe. We also see that price action has started to consolidate and the shorter term moving averages starting to curl. The $400 whole number would be a good entry to take MSFT short.
Short under $400 on MSFT.
NASDAQ: Bearish - Ascending Wedge + ROC DivergenceNASDAQ: Bearish - Ascending Wedge + ROC Divergence
Ascending Wedge Detected on the Nasdaq
The trend is bullish, but there is a big divergence with the ROC (Rate Of Change) which gives you the speed of the Momentum of the asset.
A break of the bearish trend line of the ascending wedge would cause the Nasdaq to fall around 17158 - the support zone detected by the Wolf of Zurich is between 16160 and 15675
Monitor the 50 and 200 exponential moving averages
Be careful and happy trading everyone.

JP Morgan: Bearish - WOLFE detected + divergence with the ROC.JP Morgan: Bearish - WOLFE detected + divergence with the ROC.
The price could fall weekly to around 154 then 137.
The divergence on the ROC is very strong.
The 50 and 200 exponential moving averages are potential targets.
On a daily basis we could reach 171 then 155, the divergence on the ROC is also very strong.
Be careful!

CADJPY Bearish Divergence, Trend Line BreakNote:
1- Berish Divergence
2-Sell Sentiment 90%
Trade:
SL= 111.808
EP= 111.634
TP1= 111.457
TP2= 111.283

AUDNZD Bullish Divergence, Trend Line Break, Head & ShoulderNote:
1- Berish Divergence
2- Head and Shoulder
3-Sell Sentiment 95%
Trade:
SL= 1.05873
EP= 1.06068
TP1= 1.06257
TP2= 1.06466

AUDJPY Berish DivergenceNote:
1- Berish Divergence
2-Sell Sentiment 91%
Trade:
SL= 99.075
EP= 98.475
TP1= 97.868
TP2= 97.299

EURCHF Berish DivergenceNote:
1-Bearish Divergence
2-Sell Sentiment 93%
Trade:
SL= 0.95457
EP= 0.94958
TP1= 0.94459
TP2= 0.93956

DKKCZK - 1H - Bullish Divergence - DOW THEORYIn this chart we have spotted a Bullish Divergence on 1H time frame, and we see promising rise of price.
