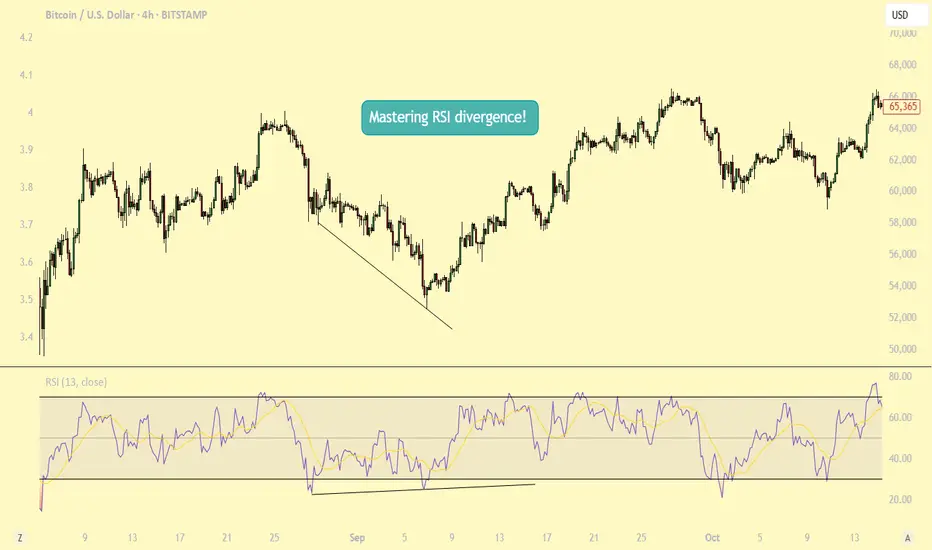
Mastering RSI Divergence: A Complete Guide to Trend ReversalsWhat Are Divergences?
In this guide, we will explore the concept of divergence and how it can be effectively utilized alongside the Relative Strength Index (RSI), one of the most popular momentum indicators in technical analysis. Divergence occurs when the price of an asset moves in the opposite direction of an indicator, such as the RSI. Understanding RSI divergence can be a powerful tool for identifying potential trend reversals or continuations. In this guide, we'll delve into the various types of divergence that can occur with the RSI and how to incorporate them into your trading strategy.
Types of Divergences?
There are three primary types of divergence: bullish, bearish, and hidden divergence. Each signals a distinct market condition and potential outcome, and understanding these nuances is key to using divergence effectively in your trading.
1. Bullish Divergence Bullish divergence happens when the price of an asset makes a lower low, while the RSI forms a higher low. This indicates that although the price is declining, momentum is weakening. The failure of the RSI to confirm the new low in price suggests that selling pressure is diminishing, potentially signaling that a reversal to the upside could occur. Essentially, the market is losing its downward momentum, setting the stage for a potential bullish move.
2. Bearish Divergence Bearish divergence occurs when the price forms a higher high, but the RSI forms a lower high. This indicates that although the price is rising, momentum is weakening. It suggests that the uptrend may be losing steam, signaling that a potential reversal to the downside could be on the horizon. As the price continues higher, but the RSI fails to confirm the new highs, it may indicate that the market is becoming overextended and ready for a correction.
3. Hidden Divergence Hidden divergence differs from regular divergence in that it signals a continuation of the existing trend, rather than a reversal. It typically occurs during pullbacks or retracements in a strong trend. Hidden divergence can appear in both uptrends and downtrends, providing traders with an indication that the prevailing trend is likely to continue after the short-term retracement is over. This type of divergence serves as a confirmation of trend strength and helps traders stay in profitable positions during market pullbacks.
Why Are RSI Divergences a Powerful Tool?
RSI divergence is a powerful tool in trading because it offers early insights into potential trend reversals or shifts in momentum before these changes are fully reflected in price movements. By recognizing divergence, traders can anticipate shifts in market sentiment and make timely decisions. One of the main reasons RSI divergence is so effective is that it serves as an early warning system. It signals when the momentum behind a price trend, whether up or down, is starting to weaken.
For example, in a strong uptrend, if prices continue to make new highs, but the RSI fails to reach new highs, this could signal that the buying momentum is losing strength, even though the price is still rising. This divergence indicates that a reversal or pullback might be imminent, allowing traders to exit their positions or prepare for a potential shift in market direction. Understanding this early warning can provide traders with an edge, helping them avoid being caught in the late stages of a trend and positioning themselves ahead of a change.
How to Trade RSI Divergences?
When the price makes a higher high but the RSI fails to confirm with a higher high, this is known as bearish divergence. While this situation suggests weakening momentum, it doesn’t necessarily mean a correction is imminent. The price may continue to rise for some time, and eventually, the RSI could catch up and make a higher high in line with the price action. Essentially, the market could remain in an uptrend, and the RSI could still align with the price over time.
This highlights the importance of not jumping to conclusions solely based on RSI divergence. Divergence can act as a useful warning, but it should not be relied upon as a definitive signal of a trend reversal. To increase the reliability of the signal, traders should wait for additional confirmation, such as a candlestick pattern indicating a potential trend reversal. Candlestick patterns like engulfing patterns, doji candles, or shooting stars at key support or resistance levels can provide stronger evidence that the trend may be about to change.
Therefore, it’s wise to wait for a more comprehensive confirmation from price action before making a move, rather than acting on divergence alone. Combining RSI divergence with other technical tools, such as candlestick patterns or chart patterns, can help increase the accuracy of your trade decisions.
Conclusion:
Divergence is a powerful tool that provides valuable insights into potential trend reversals or continuations. By understanding the different types of divergence and knowing how to identify them, traders can make more informed decisions. However, divergence should always be used in conjunction with other technical analysis tools to enhance the accuracy of your strategy. With practice, patience, and proper risk management, divergence trading can become a profitable strategy for identifying key market turning points. Whether you are seeking trend reversals or confirming ongoing trends, RSI divergence can be an essential component of your trading toolkit.
Thanks for your support.
- Make sure to follow me so you don't miss out on the next analysis!
- Drop a like and leave a comment!
Divergence
Buy idea on AMAZON (AMZN)Based On :
- Presidential cycle and quinquennial cycle
- quantitative data
- strong demand zone covered by weekly and 2w as well
- divergence on Poiv (open interest from Nq) and Progo
- Undervalued conditions on weekly timeframe

GOLD - Day Trading with RSI 04/02/2025
Weekly and Daily Timeframes (W & D):
GOLD is still in an uptrend, as the RSI's WMA45 is still hovering near the 70 level, and RSI remains above both of its moving averages.
H4 Timeframe:
This timeframe is currently showing a correction. However, it's not yet considered a downtrend because the WMA45 is still in the high region, close to the 70 level. But, RSI has dropped below the WMA45.
At present, the RSI on H4 is facing dynamic resistance from the WMA45 above and has support around the 4x level (43-48). The corresponding temporary price levels are approximately 3128 (resistance) and 3088 (support).
This end-of-uptrend correction on H4 could lead to high price volatility. GOLD may move within a 300–400 pip range (between the resistance from WMA45 and the RSI support around the 4x zone).
H1 Timeframe:
Currently in a downtrend, as RSI is moving below both of its MAs, and the WMA45 has a noticeable downward slope.
H1 also has RSI support at the 30 level (temporary price ~3086) and resistance at WMA45 above (temporary price ~3130).
Since we’re focusing on intraday trading, priority is given to the H1 trend.
Figure 1
Trading Plan: SELL
Entry Zone:
When RSI on M15 approaches upper resistance: levels 50–55 or 65–70.
Confirm Entry:
Conservative/Safe approach: when M5 ends its uptrend and reverses (see example in Figure 1 – M5 ends uptrend when RSI crosses below both MAs).
Or when bearish divergence appears on M5.
Or even earlier, when there’s divergence on M1 and M5's WMA45 flattens out.
Stoploss:
20–30 pips above M5’s recent peak.
Or if RSI on M5/M15 breaks through its previous high.
Take Profit:
100 pips or R:R >= 1:1.
Or when M5’s downtrend ends (when RSI crosses above both MAs).
You can check out the indicators I use here: www.tradingview.com

Smart Money Technique (SMT) Divergences - The Ultimate GuideIntroduction
SMT Divergences are a powerful concept used by professional traders to spot inefficiencies in the market. By comparing correlated assets, traders can identify hidden opportunities where one market shows strength while the other shows weakness. This guide will break down the major SMT divergences: EURUSD/GBPUSD, US100/US500, and XAUUSD/XAGUSD .
---
What is SMT Divergence?
SMT Divergence occurs when two correlated assets do not move in sync, signaling potential liquidity grabs or market inefficiencies. These divergences can be used to confirm trend reversals, identify smart money movements, and improve trade precision.
Key Concepts:
- If one asset makes a higher high while the correlated asset fails to do so, this suggests potential weakness in the pair making the higher high.
- If one asset makes a lower low while the correlated asset does not, this suggests potential strength in the pair that did not make a lower low.
- Smart Money often exploits these inefficiencies to engineer liquidity hunts before moving price in the intended direction.
---
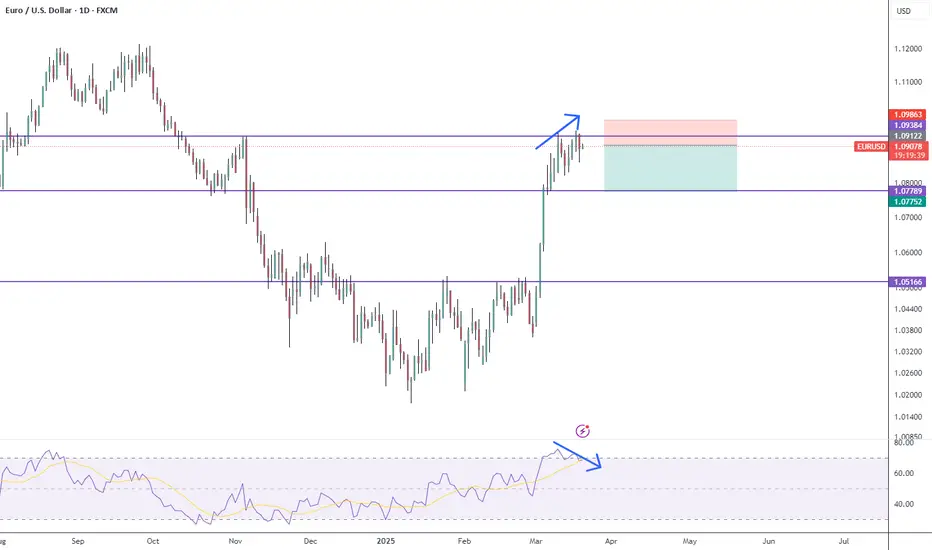
EURUSD vs. GBPUSD SMT Divergence
These two forex pairs are highly correlated because both share the USD as the quote currency. However, when divergence occurs, it often signals liquidity manipulations.
How to Use:
- If GBPUSD makes a higher high but EURUSD does not, GBPUSD may be trapping breakout traders before reversing.
- If EURUSD makes a lower low but GBPUSD does not, EURUSD might be in a liquidity grab, signaling a potential reversal.
---
US100 vs. US500 SMT Divergence
The NASDAQ (US100) and S&P 500 (US500) are both major indices with a strong correlation, but tech-heavy NASDAQ can sometimes lead or lag the S&P.
How to Use:
- If US100 makes a higher high but US500 does not, it suggests US100 is extended and may reverse soon.
- If US500 makes a lower low but US100 does not, US500 might be experiencing a liquidity grab before a reversal.
---
XAUUSD vs. XAGUSD SMT Divergence
Gold (XAUUSD) and Silver (XAGUSD) have a historic correlation. However, due to differences in volatility and liquidity, they can diverge, presenting trading opportunities.
How to Use:
- If Gold makes a higher high but Silver does not, Gold might be overextended and ready to reverse.
- If Silver makes a lower low but Gold does not, Silver might be in a liquidity grab, signaling strength.
---
Indicator Used for SMT Divergences
To simplify the process of identifying SMT divergences, this guide utilizes the TradingView indicator TehThomas ICT SMT Divergences . This tool automatically detects divergences between correlated assets, highlighting potential trade opportunities.
You can access the indicator here:
Why Use This Indicator?
- Automatically plots divergences, saving time on manual comparisons.
- Works across multiple asset classes (Forex, Indices, Metals, etc.).
- Helps traders spot Smart Money inefficiencies with ease.
---
Final Tips for Trading SMT Divergences
1. Use Higher Timeframes for Confirmation: SMT Divergences on 1H or 4H hold more weight than those on lower timeframes.
2. Combine with Other Confluences: ICT concepts like Order Blocks, FVGs, or liquidity sweeps can strengthen the SMT setup.
3. Wait for Market Structure Confirmation: After spotting SMT divergence, look for a market structure shift before entering trades.
4. Be Mindful of Economic Events: Divergences can appear due to news releases, so always check the economic calendar.
---
Conclusion
SMT Divergences are a valuable tool for traders looking to gain an edge in the markets. By analyzing inefficiencies between correlated assets, traders can anticipate smart money movements and improve trade precision. Practice spotting these divergences on real charts, and soon, you'll develop a keen eye for hidden liquidity traps.
Happy trading!

Mon 31st Mar 2025 XAG/USD Daily Forex Chart Buy SetupGood morning fellow traders. On my Daily Forex charts using the High Probability & Divergence trading methods from my books, I have identified a new trade setup this morning. As usual, you can read my notes on the chart for my thoughts on this setup. The trade being a XAG/USD Buy. This is not a valid Buy set up as per my rules but it is assisting with my original Sell trade dated 24th Mar as I go into my multi sequence hedging technique. Enjoy the day all. Cheers. Jim

Buy Idea On CADCHFBased on :
- Cycles and quantitative analysis
- Demand zone created by engulfing candle
- Small speculators shorting are 156w extremes on weekly chart
- Divergence on Poiv and Progo

Bullish Divergence on Weekly TF.Bullish Divergence on Weekly TF.
Seems like taking Support from a Very Important
fib. level around 10.30 - 11.40
Falling Wedge Pattern on Daily TF.
10.90 Should be Sustained on Monthly Basis, otherwise
we may witness further Selling pressure till 8.
Important Resistance is around 12.30 - 12.65 as of now.

Bearish Divergence has started appearing but...Bearish Divergence has started appearing
on Weekly TF but not yet on Monthly, so
a pressure might be seen around 116 - 117.
& Sustaining this level will expose 135 - 138 targets.
On the flip side, 101 - 109 may act as a Good
Support zone in case of pressure.

Quick pull backBearish divergence between the pair and the RSI and also is overbought. The pair is hitting and important resistance level. I expect a pull back to the level shown on the chart and maybe lower. SL triggers only if a daily candles closes above the resistance with great volume.
Hidden Bullish Divergence appeared.Hidden Bullish Divergence appeared.
Breaking Out a long Consolidation Box around
145 - 149.
164 - 169 is a Strong Resistance zone.
If this Level is Sustained, we may witness
200+
However, if 135 - 136 is broken, more Selling
Pressure will be witness & it may drag the price
towards 113 - 115.

Short Idea on EURNZDBased On
- Williams POIV Divergence on 4H
- Interest rate and real rate differential increased
- Cycle analysis and quantitative data
- Overvalued Conditions

Chart is crystal clear. Reaction on divergence at support.All liquidity on the upperside are left open. No reason to not go down while these are open.

Bearish Divergence on Monthly TF but Bounce ExpectedBearish Divergence on Monthly TF.
Very important Support lies around
160 - 162; and a Bounce is Expected if this level
is Sustained on Monthly Support.
Bullish Divergence on Short TF; so a bounce can be seen
up to 177 & then 194 (if 177 is Sustained)

BtcusdtLook good...
Divergence
Btc in weekly timeframe has divergence and if breakdown the channel ...72000is possible

Double BottomDouble bottom with Bullish Divergence
Immediate Targets around 43 - 45
Support is around 39 - 39.50
Should not Break 37.50

Huge divergence on ETH/BTCETH will soon rise up and we can see signs since now, i predict a epic altseason this year probably ATH Q3 or Q4 of 2025

Monthly + Weekly View
If Monthly Candle closes above 95, it would
confirm a Morning Star Formation which is a
Positive Sign.

HL Confirmed on Weekly.HL Confirmed on Weekly TF around 92.
Bullish Divergence on Daily TF.
Crossing 107 with Good Volumes
may lead it towards 112 & then 120+

Russel 2000 Compared to General MarketTVC:RUT has continued to sell off since my last couple posts and I believe we could see a huge market correction this year if price doesn't look to stop selling.
The next play on RUT I would like to see price pullback to the last breakout zone ($2,200) to confirm a continuation in trend
This play also looks very familiar to the 2022 selloff with equal highs to our current price structure. Seeing that AMEX:SPY is at a higher high tells me there is market-wide divergence and a topping pattern could be in play.
Now when we add CRYPTOCAP:BTC and $OTHER to the mix we can see bitcoin actually tops out first while Alts and SPX look to make one more leg up before crashing out.
The Trend Reader at the lower tab has topped out and has a bearish crossing in the overbought zone indicating we can see a long term play to the downside.

BTC- bearish divergenceBearish divergence on weekly = more downward movement expected. Trade with care.

Bullish Divergence on Shorter TFImmediate Support seems to be
around 82 - 84.
If this level is not sustained, we
may witness 65 - 72 range.
However, Bullish Divergence on Shorter
time frame may give it a spike of 3-5 rupees.

XAUUSD SellTrade Analysis
Harmonic Pattern: ABCD is forming. C point retracement is 0.641, which is near 0.618.
Divergence: Confirmed.
Key Level: Currently at 1H resistance.
Trade Plan
📌 Entry: 2877.320
🛑 Stop Loss (SL): 2898.080
✅ Take Profit (TP): 2856.460

SOLUSD Weekly Outlook: Bullish Shark PatternUPDATE
Bullish Shark Completion & Emerging Divergence
Shark Pattern in Play: Following our previous analysis, BINANCE:SOLUSD has completed the Bullish Shark pattern at the 0.886–1.13 retracement of the 0-X leg. Price action is now reacting around this deeper PRZ, suggesting a potential reversal may be underway.
DMI Delta Divergence: We’re seeing a bullish divergence between price and the DMI Delta—an early sign that bearish momentum could be fading. This divergence reinforces the likelihood of a bounce from the current levels.
If this divergence is confirmed with a strong bullish candle or surge in volume, it may validate the Shark pattern and open the door for a trend reversal. Keep stops below the 1.13 extension to manage risk, and watch for price targets around the 38.2% or 61.8% retracement of the new leg.
