AUD/USD SELLING ON STRONG BEARISH DIVERGENCEaccording to D1 chart forming some strong bearish divergence. also near to be sign HH on megaphone pattern.
Divergence

Divergence + Minor SNR + OrderblockI spot a divergence on 5M outlook, which then price seem to reject as well giving to a possible orderblock entry and as well as a minor SNR level could be into play as well.
Although the SNR level is not so much clean but to stand more chance is the Divergence as the dominant Reason.
Cons are the price is overall bullish and has just returned from mitigating a price structure and might push more to the upside to mitigate the minor extreme orderblock as AUDCAD mostly does.

DIS - Long term support heldA look at the monthly chart revealed that DIS has establised a strong support between 79 - 84 since 2015. This zone has been tested several times (2015, 2016, 2020) and the last time being just recently in the last week of Dec2022.
A bullish divergence is seen on it's monthly chart, increasing the odds of a bounce lasting a couple of (monthly) candles. (bullish divergence usually predicts a short term reversal that may last 2-3 candles and does not necessarily predict a longer term trend change).
It's probably a good opportunity for long term investors to accumulate at current levels or at any near term dips (as long as it does not breach $79). Bear in mind that it could remain volatile as it has yet to clear above its 200 day moving average.
In the unlikely even of the stock breaking below the long term support of 79, then all bullish bets will be off.
Disclaimer: Just my 2 cents and not a trade advice. Kindly do your own due diligence and trade according to your own risk tolerance and don't forget that money management is important! Take care and Good Luck!

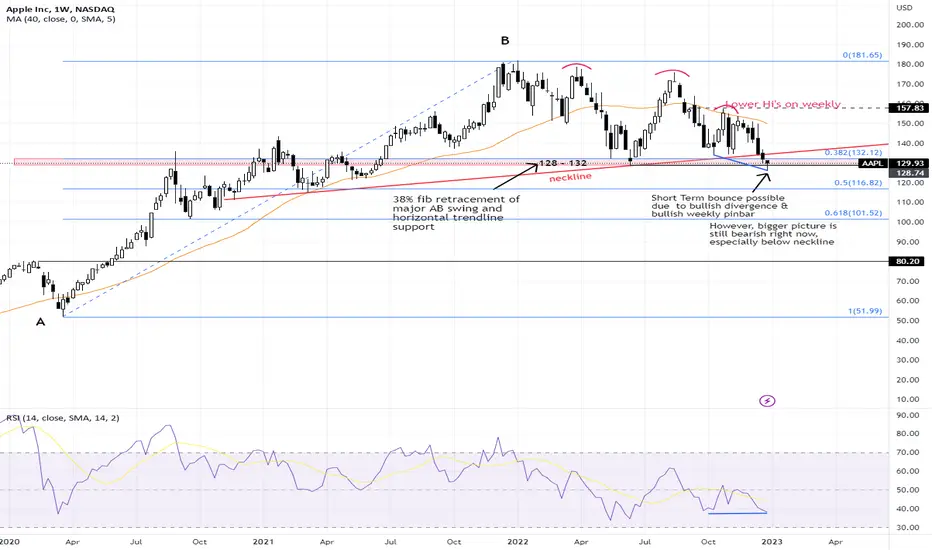
AAPL - Will support @ 128 hold?AAPL had been the most resilient among the FAANG stocks despite being in a volatile and toppish pattern for months. However it started to break below major neckline support @ 134 on 19th Dec and then an attempt to break the horizontal support @ 128.
It managed to close the month with a weekly bullish pin bar above 128 and a potential bullish divergance is also forming between price and RSI on the weekly chart. Hence a near term bounce could happen but any bounce right now is best viewed with a grain of salt until we can see change in the chart structure
Any close below 128 is potential for the bear trend to continue towards 110-115.
Disclaimer: Just my 2 cents and not a trade advice. Kindly do your own due diligence and trade according to your own risk tolerance and don't forget that money management is important! Take care and Good Luck!
Oil ready to run?Looks like $OXY is in the mix of a bullish divergence. So lets dig. Look at the lower low on the price it is sharp. It needs to rest the oscillator. Here is the thing, if we can hold above the 0 line on the MACD and start to open up we can see the ticker really run.
Bull Case we have a divergence forcing the gap up. I am looking that if there is a gap fill to take it back to the top with the ema as support. We will see what the market have. for continuation it need to blow pass $65. One of those are the entry.
Bear case first time above the ema since November with 2 candle open and close. This gap fill will be the beginning of the run back down. We are below the 0 line, there is nothing here to see but read. Break below $62 new lows will follow.

Bitcoin Bearish Divergence RSIAs you can see Bitcoin is forming a bearish divergence on the 4 hourly chart which could cause a short-term reversal in price to the two potential support lines.

Zecusdt Zed could fall because of -RD in MACD and RSI indicators till 4h support line
—- This analis is not offer to buy or sell —-

$AMZN LongPrice at apex of huge falling wedge and major support level from March '20.
Confirmed bullish divergence on daily with developing bullish divergence on weekly chart.
5.5 R:R. Tight stop loss below recent lows.

ES1! Spy Futures DailyES1! has formed daily divergence with the CRSI. and after hours has hit the daily POC level already roughly 3875. Looking for a short today.

⚠️ SPY with OBV in bearish divergence📈 The chart continues with higher funds, but the volume does not follow this movement as demonstrated by the OBV.
Which signals a bearish divergence. 🐻❄️👎
🤔 I believe there could be a spike just to liquidate the positions, leading to a big trap:
🛑 Furthermore, the OBV has just broken the white dotted line, entering the red zone, overcoming the fall of the Corona Crash for the worse:
🤥 That is, the price is higher than Corana Crash, but the volume is lower...
☁️The market can be manipulated by the big players with their Machiavellian plans and government artifacts, but volume doesn't lie!

ARCELORMITTAL MTS Bullish DivergenceArcelorMittal has activated a divergence with both MACD and RSI and with target price at 30.985€. I'd set the stop loss below 19.42€ because the structure would get inactivated. This is a short term structure but just as a reminder this company has a double bottom activated with target price to 54.10€.

SPX & NQ - Still a mixed bagJust a quick update.
SPX closed the year 2022 with a Diamond Pattern. This pattern is potentially a reversal pattern (potentially bearish if it occurs at Market Tops, and potentially bullish if it occurs at Market Bottoms). Where it is occuring now, it could be a bottoming process for the SPX.
However, Nasdaq is still the weakest link right now and still looking bearish. A short term bounce could happen for NQ as a bullish divergence is seen but in the larger picture, any bounce right now could still be a "Bull Trap".
Disclaimer: Just my 2 cents and not a trade advice. Kindly do your own due diligence and trade according to your own risk tolerance and don't forget that money management is important! Take care and Good Luck!

Price Action Analysis of Corn Futuresas we can see the apparent divergence was shown between April 2021 and April 2022.
followed by a drop-down below 0.236 Fibonacci level.
the price is still moving in a trading range which makes it hard to predict his next move.
Break bellow MA 209 with Big Volume signal a short entry.

PEV | Good Entry Point | BouncePhoenix Motor Inc. designs, assembles, and integrates electric drive systems and light and medium duty electric vehicles. The company offers buses and trucks. It focuses on developing light and medium duty commercial electric vehicles for various service and government fleet markets, including city fleets, campuses, municipalities, and transit agencies; and serves a spectrum of commercial fleet customers, such as airport shuttle operators, hotel chains, transit fleet operators, seaports, last-mile delivery fleets, and large corporations. The company also markets and sells electric vehicle chargers for the commercial and residential markets; and operates a sales and leasing dealership in the United States. In addition, it sells various L2 and DC fast-charging solutions to its fleet customers at the point of sale for fleet vehicles. The company was founded in 2003 and is headquartered in Anaheim, California. Phoenix Motor Inc. operates as a subsidiary of Edisonfuture Inc.

GOING SHORT IN GOLD USD BY TRADING STRATEGYBearish Indications (BIASED SHORT)
1. Rejected or retest from a resistance level
2. Formation of Bearish Diamond Pattern
3. Trend Line Broken
4. Bearish Divergence
5. Entry at Bearish Candle
Neutral Indication
1. Price still in the range/consolidation phase
Bullish Indications
1. By Breaking the resistance level and making a new HL then the trend will be bullish

GOLD Potential Sell 📉Gold seems to be preparing for a market correction and make a potential (A B C) or if default (1 2 3 4 5) as confirmation we have a trailing diagonal, harmonic bat pattern and strong downward momentum that can characterize a trend change.

Flawed concepts: divergences One of the reasons why a divergence on an "indicator" hasn't provided an expected result is because there was an info conflict with more data on lower resolution (aka higher timeframe was against it).
The second reason is because these indicators don't know how to distinguish buying and selling waves properly, when they start and when they end, as explained in "Real waves". Even if you pass the correctly approximated typical wave size as a lookback window length, it won't change anything 4 real.
The third reason is because these indicators actually are not supposed to be used for comparative analysis. They are what they are, they approximate slope aka direction aka gradient in given data, and some also calculate some sort of statistical limits for these historical slope values. If that's what you really need, you can simple calculate Z-scores of Close minus Open values over some lookback window, you'll do better.
As explained in "Wave exhaustion", a wave (continuous directional movement) strength is understood based on:
1) How far the price gone;
2) How much time passed;
3) How much volume got traded during this wave.
The indicators will show you a correct divergence when 2 waves have the same volume, same price range, but different time range. Volumes are completely disregarded. And most importantly, even if when volumes are the same, time is the same, but price ranges are different, it will Not show you a divergence at all. So effectively, even disregarding volume, price & time are combined in these indicators that way so comparative analysis of waves can not be done.
Many have a wrong idea is that if prices move fast (they call it strong momentum) it means motive strength. It neither confirms strength nor denies it. Time, price & volume are used together to properly understand the order flow strength, in a way explained before.

NVDA - Why I'm buying this dipLike many stocks forming a base right now, NVDA is also a victim of false breakups and wild gyrations recently.
One may wait to test the next breakup (again) or alternatively, "buy the dips".
However we before we buy a dip, we want to check that the bullish bias for the stock is still intact, which is the case for NVDA right now:
1. pullback was within 38.2% fib retracement from its AB upswing since hitting bottom in early October (ie still within acceptable range of a "normal pullback")
2. higher hi's and higher lo's still intact
3. bullish divergence between price and RSI acting out (although I have to emphasize that bullish divergence is only predictive of short term price movement, usually next 2-3 candles)
4. lastly, a bullish morning star formation.
Go long at the next candle as soon as we have price trading just above the close of yesterday's candle with initial stop placed just slightly below the low of the morning star pattern (~ 158).
The trick to trading is not about being right most of the time but wining bigger when right and losing smaller when wrong. Hence money management (ie stop loss, position sizing etc) are also parts of equation.
Disclaimer: Just my 2 cents and not a trade advice. Kindly do your own due diligence and trade according to your own risk tolerance and don't forget that money management is important! Take care and Good Luck!

Dow Jones Index Outlook 21 Dec 2022TVC:DJI DJI is clearly moving in a downtrend direction in the 30m timeframe. However, it stopped making a lower low yesterday plus it has a bullish divergence signal between price and RSI.
This bullish divergence is signaling a chance of trend change to either a sideway or uptrend direction, which we need to monitor the price action today.
If the market opens within the range of 32650-33040, then it has a chance of trading in this range for today.
However, if the market chooses to gap open above 33040 then it will test at 33163 and 333000 respectively.
On the other hand, if the market gap opens below 32650 then it will test at 32470 and 32328 respectively

West Texas Crude(WTI )....Positive Swans, Bats and Wolfves Picking bottoms particularly recently in the oil (WTI) complex, sometimes produces sticky fingers.
That said, one could build a technical analysis case for a bottom formation at current levels.
A) Longer term we have a completion of a Harmonic Bat. (insert)
B) Shorter term turn we have :
1) A completed Wolfe Wave
2) Black Swan harmonic formation
3) An ABCD formation going back to last August.
4) Oct/Nov double top target hit
5) Mildly positive momentum divergence
So how do you play this.
I would certainly give WTI a chance to find a bottom and advance upward
A penetration of 3 of the Wolfe Wave provides an entry point at $73.65(marked)
Then a Wolfe Wave Target is set up for late January at the $85 area.
Using the Black Swan harmonic we get targets as marked.
If this the best way to play bottoming oil ? Probably not but its a signpost to play your favorite horse.
Please note... Fed activity next week, year end illiquidity and Eastern European events should magnify WTI's volatility going forward.
Good Luck and I will update as needed.
Not investment advice, do your own due diligence.
S.

Gala is ready to dump! We have extreme barest divergence on the one hour, and we topped out with confirmation in the volume three hours ago, so the drop should happen anytime. This token suffered an attack on its accounts and had its tokens stolen so I’m not sure if this token will recover at all it’s probably best to just short this token to zero in my opinion.

NEAR Protocol - possible long play NEAR protocol long scenario I am watching.
My criteria noted on the chart.
Cheers

USD/JPY -8.264% 12/19Was right for a split second then trended upward and stopped me out. Maybe I should have weighed the ADX indicating a strong trend.? Idk LMK what yall think I could have done better here.
