EURUSD - SellsFX:EURUSD
EURUSD - Looking like we are coming for these lows to grab liquidity! Watch out
Divergence

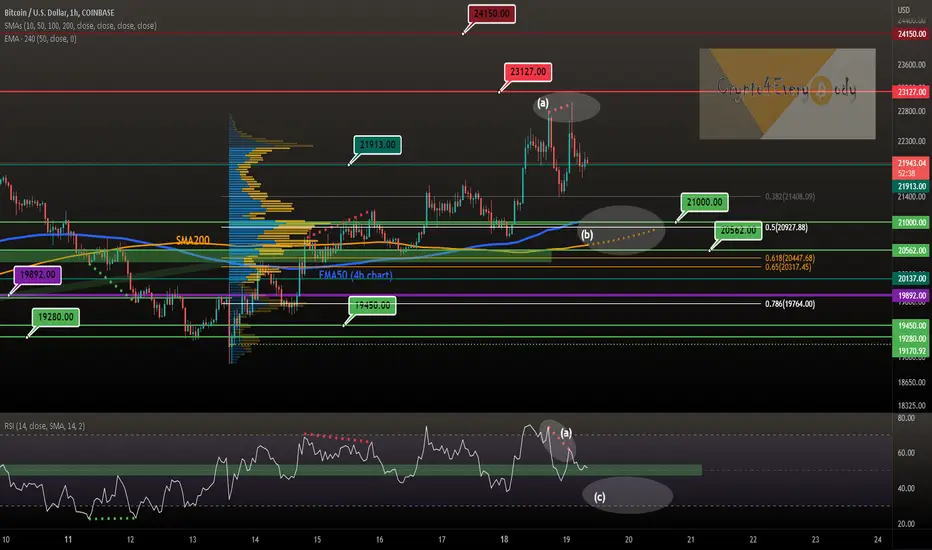
Bitcoin short-term view - bearish divergence - correction likelyBitcoin short-term view
(a) bearish divergence - correction likely
(b) IMO a correction to ~$21.000 would be fine - (volume support, EMA, SMA, FIB50%)
(c) Expect RSI to get in oversold area soon
*not financial advice
do your own research before investing
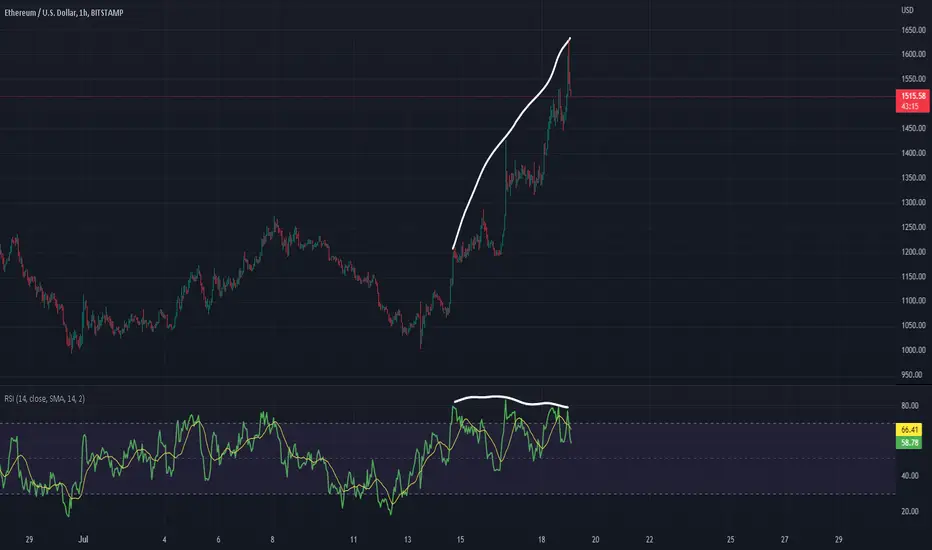
ETHEREUM /// SHORT /// SWING /// DIVERGENCE Hi
Divergence on 1H on RSI
No more needed to say
SL at 3%
TP at 5% 7% and runner for 10%
GL

Bitcoin short-term view - correction likelyBitcoin short-term view - correction likely
BTC is overbought and showing bearish divergence on RSI
Correction should find first support at $21.000 - next lower support at $20.562 where SMA200 and EMA50 (4h chart) are waiting
Have a great day dear Crypto Nation
*not financial advice
do your own research before investing

NVDA is making falling wedge right on supportNVDA is making falling wedge pattern right at monthly and weekly support good chance to go up

Bitcoin short-term view - BTC at $21.000 resistanceBitcoin short-term view - BTC at $21.000 resistance and bearish divergence with RSI
If price gets rejected next volume support can be found at $20.562
A drop of RSI below 47 more likely IMO - what do you think dear Crypto Nation?
*not financial advice
do your own research before investing

XRP looking sexy AF So what do you all think, is this not the best time to buy this financial disrupter? Everything seems to be lining up with the SEC settlement coming soon. Not financial advise.

Market Range - What are they trying to tell us?When the market range, it is telling us they are lost with the main direction. And we are seeing that between all the US major stock indices and many stocks since the second week of May. Prices basically still trading around the same price since then.
In today’s tutorial, we will discuss:
• How to identify when market started to enter into a range and
• Which direction will it ultimately break away from a range market?
The concept of “Less is More”
When we trade into a contract that is within our means, we will be able to focus on trade set-up that is so helpful for entry, stop loss and profit taking than trying to manage our emotions as we have over traded.
Disclaimer:
• What presented here is not a recommendation, please consult your licensed broker.
• Our mission is to create lateral thinking skills for every investor and trader, knowing when to take a calculated risk with market uncertainty and a bolder risk when opportunity arises.

Double Top Pattern On GBP/USD - 4-hourHi Traders,
Happy Wednesday.
Today we are looking at GBP/USD.
We are on the 4-hour time frame and we can see we have a double top playing out.
Notice the two peaks of the double top ( I have placed arrows on each peak ) Notice the divergence of the histogram on the MACD across these two peaks. This indicates that the sellers are coming in hot and taking control because the buyers have been weakening.
We also know that we are trading with the current market trend. There's no reason for us to look for long positions in most of the major pairs right now as the DXY is rocketing up and the Euro and Pound are struggling to form a bottom. So remember, if you want to give your strategy a further edge, trade with the trend. Our current market bias on this pair is short so we have been looking for short positions.
I have highlighted the neckline zone in yellow. I was waiting for a retrace to the topmost point of this zone. I wanted the price to hit the resistance of that zone before opening up a short position. This gives me a higher risk to reward and I am looking for a risk to reward of one to three for this particular setup.
Switching to the weekly time frame we can see that we have support around the 1.165 level.
Price always seems to react around this level and there is technically no previous price structure to stop us on the way down. This is why I have chosen the 1.165 price level as my target for this double top.
My short position opened early this morning whilst I was away from my computer so I decided to showcase this trade to you guys because it is always interesting to see how these things tend to play out. I am a patient swing trader and most of my entries occur within the 4-hour time frame.
So let's wait and see if this pair is indeed going to move down even lower towards my target.
Double tops and double bottoms are one of the most popular chart patterns to use and it's always a great tool to add to your bag of tricks when trading forex.
Keep your eyes peeled!
So on that note, let's watch and see what happens.
I will be seeing you all in the next one.
Hope you all have a great day!
The Vortex Trader

In the History of BTC, this Indicator has Never been WrongThe month isn't over, but hidden CCI divergence has been extremely accurate in predicting long term reversals.
For reference, I've also provided Commodity Channel Index bearish divergence for the XLE that proved to be accurate as well.

Double Top Pattern On AUD/USD - 4 Hour Hi Traders,
Happy Tuesday.
Today we are looking at AUD/USD
Before we get into it, can we all just acknowledge the fact that the Euro and the US Dollar is officially one-to-one. The last time this was seen was in 2002. Twenty years ago. It's quite something to see. We are living in interesting times. The DXY is still rocketing upwards. Other markets are falling. As a trader, we love volatility right. That’s our bread and butter. And because we trade constantly, we’re the first people to see these moves before the rest of the world finds out. I think we should remember not to take this ability for granted. You’ve worked hard to be where you are and thankfully if you are a consistently profitable day trader, then you can take advantage of price swings like this. The rest of the world cant. So, let's remember to be grateful every day.
Ok, let's move on to AUD/USD
We are on the 4-hour time frame.
The price has been bearish and still is. However, we may have a Double top playing out in this time frame. As you can see I have placed two arrows indicating where the tops are. I have also highlighted the neckline in yellow. The price moved straight through this neckline and is currently sitting way below it. We have very strong bearish volume at the same time.
So what I would like to see is the price slowly come back up to the neckline, which is also the previous Support flipped resistance. This is a zone that has a lot of interest so I'm happy with it being a neckline zone.
Moving to Volume, we have seen nothing but bearish volume, but what I would like to see with that possible retrace up to the neckline, is bullish volume, but we don’t want overpowering bullish volume with the retrace because that could indicate a possible reversal and we would most likely be stopped out. So we want to see bullish volume lower than this previous impulsive bearish volume we have been seeing.
Moving to the MACD, we have divergence across the two tops of the Double Top. We can see this on the Histogram. Buyers were weakening and this just confirms our bearish bias because as we are trading with the trend remember. So we are looking for opportunities to go short.
So on that note, let's watch and see what happens.
I will be seeing you all on the next one.
Hope you all have a great day!
The Vortex Trader

Bitcoin short-term view - many resistances aboveBitcoin fell down to the All Time High of December 2017 at $19.892 again
But BTC built a nice bullish divergence that should more likely lead to a recovery
If not ... next lower support is at $19.450 and $19.280
What do you think... will BTC go lower?
*not financial advice
do your own research before investing

NAS100/ LONG I expect we will see a temporary uptick from here. There are many reasons that confirm
The price is inside a consolidation zone and coincides with the trend line and there is also a divergence in the MACD indicator
Also, for the correction to be completed, we expect to get an upward C wave

Ethereum ETH short-term - bullish divergence on volume supportEthereum ETH short-term - bullish divergence on volume support
Can ETH hold support at $1.138 by the help of bullish divergence with the RSI?
Next lower support at $1.079 (price action)
*not financial advice
do your own research before investing

Altcoins Bearish Hidden DivergenceWe are posting a Hidden Bearish Divergence on the daily chart with Altcoin Market Cap.
