Divergences

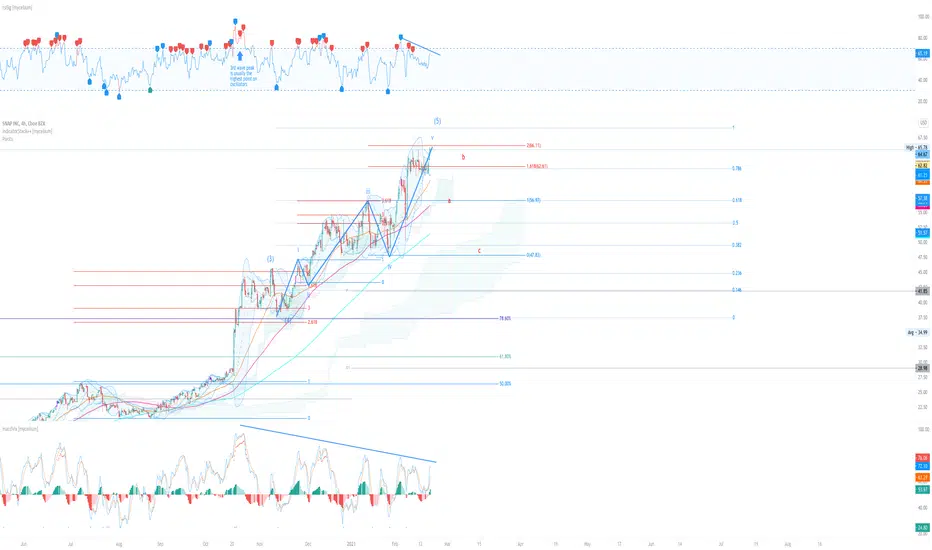
SNAP: might be time to snap back soon...quick idea:
SNAP has been on an amazing rally - however - I think the time has come for the fun to end. When looking for the most egregious examples of high valuation in the market might now, snap is definitely up there.
After counting waves several times I came to the conclusion that SNAP is like many other tickers on the market near in a fifth wave completion. It is also difficult to ignore the divergence on the MACD that has been building since late October (short term bear div on rsi as well). Divergence can go on for a long time but after five months, almost half a year, it's likely that a correction/significant retrace to previous support levels will happen.
There may be a pop after market open but my guess is a strong sell-off will begin this week.
BTCUSD - bearish divergence (short term trade)I think a retest to previous resistance area (42k) is possible, though remaining in a bullish configuration.

This it's possible a correction toward the $900 USD!!! Good ideaAt the moment, Ethereum it's show a rejection of the price in H4 chart. So, we can to see a down movement toward the $1,106 USD. Now, in this point, this it's very important to know if Ethereum break down this support that could be psycological important to form any rejection or formation of this bullish channel. So for that, we would need to know this part of manipulation when we see first a bearish risign wedge and we could have a potentail formation of bullish channel into this bearish rising wedge that I show you for you. This it's a market secret that investor and traders use to identity possible potentail of formation. But in case that Ethreum doesn't break down the $1,106 USD and show any bullish or rejection candlestick, we could to see and prefer to find down possible bought at $1,106 USD approximately to then, we can to see a target profit at $`,400 USD again, that it's in case for bullish scenario, and that I show you using this arrow model.
In H8, MACD show highe lower in the MACD signal, usign htis blue and yellow line, that show that MACD are lossing boughts, that mean possibles overbought market in H8 timeframe. Bur for that, this model it's the same of H4 timeframe. To know, if Etherem going to break down the $1,106 USD, we could to see a next movement toward the $900 USD easily.
And then, this it's the Daily chart that I wanting to share you. We see a bearish divergence in the MACD that show higher lower, and also in the same time the price action that we have this big bearish candlestick that show a overbought market.
So guys, the possibility to see the $900 USD it's 75% of probability in front of 25% that $1,106 USD make support and then up.
So, I'm in the market right now from $1,234 USD hoping the confirmation of H4 timeframe candlestick. So, I am in short position with a SL at $1,329 USD and my target it's exactly at $910 USD.

📖 A Guide to RSI Divergences - By Trading-GuruIn this guide I will walk you through the three main different kind of divergences and explain to you how you can spot them.
I also show you the extreme power RSI divergences have by looking at BTC/USD and mark them on the chart. It's quite special to see all these three kinds immediately after another, and it's really nice to see them all working out here as well.
Obviously, no signal will not provide a 100% success guarantee. But this text-book example on the BTC price showing how they work out every time is great for both learning and profit taking.
It can be very hard to trade an asset that has seen such immense growth and nearly vertical upwards momentum. Using RSI divergences you will still be able to predict price reversals and trade successfully. So let's take a closer look at the three different forms of RSI divergences that I cover here on the chart.
Exaggerated Divergences
Exaggerated divergences are similar to regular divergences, but are considered weaker and less predictive variations. The term exaggerated refers to a circumstance where either the oscillator or price makes an equal high or low.
Regular bullish divergences and regular bearish divergences both have two exaggerated variations, so there are four exaggerated variations in total. In this case we look at a bullish version where the price is consolidating the but the RSI shows an increase in momentum.
Hidden Bullish Divergences
A Hidden Bullish Divergence is considered a continuation signal in an uptrend. It refers to a circumstance where an oscillator reading falls down below its previous low, while price is still higher than its previous low.
Hidden bullish divergences are most likely to occur in the middle of an uptrend – often after a healthy pull back – and indicate that the uptrend will most likely continue.
The starting point of a hidden bullish divergence should be a clear swing, not just a red candlestick.
Regular Bearish Divergence
A Regular Bearish Divergence is considered a strong reversal signal in an uptrend. It refers to a circumstance where price rises and makes a higher high, while the corresponding oscillator reading is still lower than its previous high.
Bearish divergences are most likely to occur in strong uptrends and signify that upward momentum is weakening. A reversal – or at least a pull back – is then expected to follow. Regular bearish divergences also appear in exaggerated form.
Follow me for consistent high quality updates, with clear explanations and charts.
Please like this post to support me.
- Trading Guru
--------------------------------------------------------------
Disclaimer!
This post does not provide financial advice. It is for educational purposes only!

Atul Auto - A Great investment IdeaAtul Auto is a fundamentally a strong company with great investors on board.
Technically, the stock is showing positive divergences on the weekly time frames.
CMP is 192 and it seems it is already to touch 260 and 340 levels.
Any weekly closing above 340 levels will open the chances of it testing its all time highs

Bitcoin: 30m''BUY MARKET ORDER''
Why buy?
38.2% retracement
bullish hidden divergences
bullish engulfing
Stops: $22858
Target 1: $234xx
Target 2: $237xx
Good luck to everyone buying Bitcoin!

Infosys - All poised a decent correction ? Stay cautious I usually prefer a 3-hour time frame chart to understand the longer trend of the stock.
IT stocks have had a stellar rally since the March lows and it seems to me that the bulls are finally getting tired before they get active all over again.
Infosys the beast is showing some serious negative divergences on a 3-hour time frame. Additionally, the dollar index is also looking to bottom out in near time :)
Infosys can correct till 1020-1050 in near short time :)

EURUSD: 4h''SELL MARKET ORDER''
Why sell?
Exaggerated bearish divergences
Hanging Man candlestick pattern
Additionally, you may want to wait for the trend-line break for confirmation.
Good luck to everyone buying $ !


GBP/USD- Daily overview Hello everybody!
-On a daily chart, we can see that the price reached the supply area, and then the price formed a double top pattern which is a very good reversal signal.
-We can also see that the price is still in an ascending channel but we can notice that the price touched and rejected the upper trend line of the ascending channel
-If the price breaks the lower trendline of the ascending channel we can also looking for a short position on this pair because we can also see that the price formed a triangle pattern so we can wait for the breakout.
-The price also formed a shooting star pattern which is also a signal that the bulls are losing control and that the bears are gaining some power in that area.
-The Stochastic indicator is showing us the bearish regular divergence and that is also an extra confirmation to take a short position to this pair.
-Before taking action in Forex, please check the economic calendar and currency strength meter.
-WHAT DO YOU THINK ABOUT THIS SETUP?
Please let me know in the comment section!
THANKS FOR READING!
-If you have some different opinions please let me know and if you like this please hit that like button and give me support, I will appreciate every support.
-Remember this analysis is not 100% accurate. No single analysis is. To make a decision follow your own thoughts. The information given is not Financial advice.


XAUUSD down trend termination or just an other corrective leg?!#XAUUSD has some trend reversal signs. First it completed an ABC corrective wave with a Regular Divergence between wave 3 and 5 in RSI(8) oversell area. It also reacted to the channel lower line and Monthly static support (gray area).
It's first resistance is at 1850$ where it reaches the inner line. And if it tends to reach the upper line of the channel it has a major Monthly resistance at 1921$.
But these are not enough to reverse the whole downtrend and it can be just and upward correction!
What do you think about #XAUUSD?!

EURJPY: Bullish Butterfly Preceding .618 Retracement''BUY MARKET ORDER''
Why buy?
Preceding bullish butterfly
bullish .618 retracement
bullish hidden divergences
Preceding bullish butterfly:
Good luck to everyone trading EUR/JPY!

LONG DOS - bullish divergencesBullish divergence in momentum and at POC support (Green Line), which is a sign of accumulation.

Divergence - Expecting Downward MovementAs you can see, there is a huge divergence in BTCUSDT 4H chart, I expect a downward movement soon.

Gold: 1H''SELL MARKET ORDER''
Why sell?
Bearish Gartley
Negative hidden divergences
Doji at PRZ
There should be some serious resistance at current prices, around $1896.
Good luck to everyone trading gold this week!

DAX: 15m''BUY MARKET ORDER''
Why buy??
Bullish Butterfly
Negative hidden divergences
Spinning top/Doji candlestick pattern
Good luck to everyone trading DAX!

USDCHF: 4H''BUY MARKET ORDER''
Why buy?
Positive hidden divergences
Positive regular divergences
AB=CD
Additionally you may want to wait for a candlestick confirmation before entering.
Good luck to everyone trading USD/CHF!

Bitcoin: 4HWhy sell?
Bearish butterfly
Preceding 0.618 triangle
Bearish hidden divergences
Harami candlestick pattern (Inside-Bar)
Good luck to everyone trading Bitcoin!

GBPUSD: 1HThe previous highs happens to be a 0.382 retracement level coming in at a very psychological level (1.30$)
With this set-up you will simply be trading in the direction of the short term trend and never again will you have to pick a high or low.
So why sell this market?
A dip down to the 1.50 extension illustrates a bearish trending market
Pullback up to 0.618-0.786 area
Bearish hidden divergences
Not expecting 1.30 sellers to give up the highs. Protective stops are placed at 1.301, 3 pips above the previous highs.
Good luck to everyone trading GBP/USD!!

GBP/NZD: 4hHere is an update on last weeks chart, with a fresh view on the market!
Check related ideas for more info

Bullish on BRD (LONG) Bread has been in a downtrend for some time now, we've seen multiple spikes but yet the price remained bearish with no bullish mid term signs. however, something interesting caught me when I was looking at the 12h Chart for bread. A bullish divergence is visible on the 12h chart. hence, this gives a great opportunity midterm, while taking some volatility from BTC into account. hence a SL is needed around 600 Sats.
Buy 650-660 Sats
target 1 733 Sats
target 2 770 Sats
target 3 830 Sats
target 4 980 Sats
