GBPAUD: 15m''BUY MARKET ORDER''
Why buy??
True double bottom (Gartley '222')
Regular bullish divergences
Rickshaw Man (doji) candlestick pattern
Good luck to all trading GBP/AUD!!
Divergences

Alert: Bitcoin in demand zone + bullish rising wedge: Buy signalHello traders and guys of the trading view community. In this analysis, at the moment, in Daily the trend is not clear here. As we are in the important support key betwen the $10,400 USD and $10,198 USD, its could be to produced a manipulation for short position, we need to take as counsel while Bitcoin it's go on.
So, in H4 timeframe we see one change of perspective, because the $10,198 USD it's could be to consider as important level as support, becuase the price tends to go back to the $10,200 USD above it. Because the candlestick show a bullish movement, we have one signal of alert to stay alert, there are one rejection's candlestick and RSI and MACD overbought, and that show a possible bought until the go back to the $11,100 USD to then, confirme the break down of the shoulder head shoulder
IN H1, the RSI indicator show a momentum to see a bought because the price are overbought and RSI make a lowe higher and price action make a lower lower, that show a possible change of trend and bulls are defend for complete to find up the $10,200 USD as maximum point, if the Bitcoin it's was defended for bulls, we could see a bullish movement!!!

Euro represent a bearish and hide divergenceIn this analysis, in H4 timeframe, we see that Euro is into this bullish channel, but as recomendation is put any long position as buy order, I put my buy order at $1.1943 USD with a SL at 44 pips and take profit of 130 pips.
Now, in the RSI show a hide and bearish divergence that show a higher lower and the price action show a higher high, that is a momentum of change of trend.
Now, the candlestick today is closed up formed a bearish hammer, this is an indication of more drop!!!!
Also, in the other pars we need to check out if there will be a other form of watching of the market of to going agains the trend, I see the same situation of other pars.

When god throws you apples!make cider or it will turn to vinegarIt's going to get tough over the coming next weeks.. also today apple announced they bought out Startup Mobeewave for $100m so to turn iphones into payment terminals and compete with Square.
Imagine this: they will become a financial institution sooner or later as well as your personal doctor. Think about it... they will measure your vital stats and grant you a new loan... or change your insurance cost...
This company is by far the best on the world!!! just trying to find out short-term momentum nothing else..

GOLD WILL REACH 2k zone and then drop dramatically!After using "my art" with respect to frequency functions, and analyzing gannbox, harmonicpatterns, fishpattern, trend lines, divergences, arcs, waves of Elliot, gannbox fib ratios ...
So:
I've found this 'qantum-gravity-price-zone', and ... just don't let it go. Let's wait for # Bloodhound'sEffect! And #BePatient!
(You could buy, and then sell).
"For me, analyzing markets is an art, I just draw it".
-JBPip

Updates of EUR/GBP: That is all manipulationWhen I going to making the technical analysis, I see a bearish rising wedge, but this bearish risign wedge are the expectative what we hope so bearish of trend of trend, in that case we are int othe ascendent channel. But, this morning I see that we need to entry in short position because this zone what the price it, it's a manipulation and we don't to trust that we going to entry in buy or long position, institutiaonsl make that, it's important to me as fix to see what markets are invisible to become a visible to see it.
Well, if you see we idetify 3 bearish divergences:
1. price action
2. MACD
3. RSI
That divergence are hide and this is a signal or reversal of bear.
My best technical analysis is in H4 timeframe that is see better, well my objective of htis par is to find down 140 pips. But remember that in H4 we broke up this rising wedge, but eyes that is not a bullish, this candlestick in H4 are manipulation, but if you will see in H1 timeframe, it's a pure manipulation.
Now, today there are a fundamental that the technical analysis speak in our fundamentals analysis.
1. Coronavirus and Brexit continue to Dominate Pound to Euro
2. And obviously the news of German inflation picks up more than expected on service cost and it's making a Eurozone a disstrenghten of the leador Eurozone Economy and motor of this continent that is Germany.


Special Analysis for EUR/USDin this technical analysis as education, we see an EUR/USD in long term very bullish. Why? Because there:
If you keep watching up, we are in the strong support and a possible formation of Bat armonic pattern bearish or double top, as you want to see, maybe it's has for me a double top, and very strongest because in the past in the accumulation of 2014-2017 we having a bullish trend until the 2018. But, so, we are in the possible bull run to form in long term, because indicators in the RSI show us a bullish divergence in Monthly, and this is a good indicator for this currency EUR. I see an Euro very optimistic their economies and there are a good indicators so what EUR is could be the strengthen in the long term.
In weekly, we have a very curious patter, because we are from August 2018 in the descendent and bearish channel from $!.17 USD from $!.06 USD, and then, in the RSI if you see, we are having in the ascendent channel in the RSI, and then, it's a good indicator what the force is strenghten on the price action. Also, as we broke up the descedent channel, we can to see a possible proyection and target again from the level of $1.24 USD. So, that it's a study of elliot wave analysis so we need to recover this information to take in our hand.
And Daily in midterm, we proyect a drop until the $!.11 USD to later of the elliot wave analysis, we need to see an Euro bullish in this bull run of 2020. And also, I detect a hide bearish divergence and it's very neccesary to the price drop in that zone as I estimated in my previously technical analysis. Also i added in my link of related ideas a updates of EUR/USD so recently from yesterday
That my friend, is all my technical analysis in Moonthly, Weekly and Daily timeframe, my expectative of the Euro is that I see that currency in the bull run agains the US Dollar.

Eur is bullish until 1.13445we can see regular divergence(+RD) also candles show that EURUSD is bullish until the resistant line

AUDUSD - 15 minute chartI thought this chart was worth a post of its own. A Fibonacci retracement pattern is confirmed by a hidden divergence and a bearish reaction around the completion area of the Gartley pattern now followed by a regular bearish divergence on the chart.
Good luck to all trading AUD/USD

AUDUSD - UpdateDark Cloud Cover single candlestick pattern appearing on the daily charts.
1H charts trading in a wedge formation with the RSI showing regular bearish divergences:
Using a 15 minute chart the price action reveals a Gartley pattern formation with the RSI now showing hidden bearish divergences:
Good luck to all trading AUD/USD !

Short postion for long time of BitcoinHello, guys, in Daily timeframe, I believe that Bitcoin want to soon to drop of the price in Daily, there are 4 reason why put hort position in long at the price of $9700 USD, so, in my case from yesterday my short position is $9,686 USD. So, in the Daily, we have a bearish divergence in the RSI, and the price action has advising us a possible drop of the price until the zone of $8,200 USD. So, wow, this is an great opportunity to put in short for lojnger from $9,750 -$9,650 USD until the $8,200 USD. And the target profit is $8,200 USD approximately, but always and when the Bitcoin show us a bearish candlestick, chart pattern validated and use the bearish price action to following in short.
Now, Macd also doesn't have force to continue up, expecially the fourth rejection of the zone of $10,300 USD, this is a liquidation of long, so my trades, i believe that it's a movement what Bitcoin want to change the trend, especially in Daily timeframe, we have in the bearish rising wedge, and so this mark in blue, this is a possible proyection of waht Bitcoin do in the next days.
Well, also, I find up that Bitcoin is the zone of Distributtion, because if you see this indicator Acumulation. Distribution, we see that the force to continue up is ending. So, look below in the H4 timeframe

Potential long opportunity for THETA:BTC.Ichicloud still thickly bearish in the 1hrly though.
Price now at the 61.8% Fib retrace after retracing ca. 53%.
CYBER ENSEMBLE triggered a blue Buy signal.
PRISM Oscillators Set Analysis:
pRSI Stochs in the oversold state.
Bullish divergence in the pRSI, as well as pRSI about to cross bullish above its 30 VWMA.
Momentum already in the positive, pulled up by the bullish Acceleration/Jerk-Ribbon; which is in turn sustained by the positive (yellow) snap-oscillator.
Summary:
Buying if price holds above the green 50 SMA, and the red 21 EMA crosses above the green 50 SMA.

USD/JPY Short On Friday November 15, 2019 there was an established downtrend for USD/JPY. In fact, within the activity of the following price action, there were clear signals of a trend reversal. I took the liberty of pointing out some obvious cases of hidden bearish divergence and also regular bullish divergence. These two indicators pointed out an overall possible reversal. Bulls are exhausted. Warning of possible trend direction change from uptrend to downtrend.

AUDUSD: short term buy signal15 minute charts
Hidden divergences appearing on the chart. Prices dropping on increasing volume.
Just trading the chart as it should be done.
Good luck to all buying AUD/USD!

AUD CAD looking interesting for a SELL setupThe price in the making of triple top in the 1 hour chart. Waiting for the price to crack below neckline and pull back to retest.
The price was in a short term up trend in 1 hr chart, also nearing the top of the descending channel in the daily chart. It then broke the upward channel to retest it again to possibly form the triple top.
Also, regular divergence is spotted in the 1 hour chart against the short term up trend.
Confluence exists wiht the higher time frames. Both daily and weekly charts showing bearish price action.
All of the above reasons points towards a possible SELL setup.
Key is to wait till the price falls below the neckline in the 1 hr chart and retest it to confirm a SELL entry.


RSI Hidden Bullish Divergence on BCPTBTC [QUICK UPDATES]Hey all, the Trading Guru is back with another entry on a new series called 'Quick Updates'.
We can see the price making a higher low, whereas at the same time the RSI is making a lower low. This is a bullish continuation pattern where the divergence indicates the end of a temporary retracement in an overall uptrend. This could be a great moment to buy BCPT and enter a coin that just started a strong uptrend.
--- What is The Quick Update Series All About? ---
I am starting a new tag (quickupdates) where I quickly share great opportunities based on TA for shorter timeframes, such as 4h, 1h, and 15m. It will not contain just a short explanation, in order to keep the velocity up and make sure you get to see the opportunities as fast as possible.
Follow me for consistent high quality updates, with clear explanations and charts.
Please like this post to support me.
- Trading Guru
--------------------------------------------------------------
Disclaimer!
This post does not provide financial advice. It is for educational purposes only!
About the links below:
20% Discount on Binance: Did you know that Binance introduced a new system where you can get 20% discount on your fees? Find the step-by-step guide on how to add it to your account on the website of 100eyes
Forex & Crypto Scanner: Nobody can keep track of all the pairs on all timeframes. This scanner works on Telegram and sends an automated message including a chart every time something happens to a coin. E.g. it can automatically detect areas of support and resistance, RSI Divergences, Fib Retracements, and more.

BTC/USD - Daily - Nice consolidationDaily :
-Doji close with higher volumes than previous bearish daily session
-Rejection from 9400 support, which is a good VPVR level since early-2018
-MA-EMA 30 still ok
-RSI hidden bull div on the edge of confirmation
-Golden cross MA 50-200 into weekly bull context
4h :
-RSI hidden bull div + bull div to consider
-Two bear trials rejected from S1 weekly support
I'm still long until 13k, which is the yearly R1 pivot.

Indusind Bank LimitedIndusind Bank Limited is made low but rsi is trying to go up. This is a divergence .

Mo Momo, yoInterested in buying under $33 and taking partial profit at $57, or long term options.
Amid China's current nCov 2019 epidemic, it seems that the internet/social media based companies are handling things well.
There is a lot of open interest for puts 30-35 on options a few months out. Considering their top holder with 14 million shares is Black Rock and MOMO is backed by Alibaba, I am near certain the puts are merely hedges for their positions should MOMO not be able to reclaim price above $40.
Here is a copy paste from Yahoo Finance:
"Momo Inc. operates a mobile-based social and entertainment platform in the People's Republic of China. The company operates Momo platform that includes its Momo mobile application and various related features, functionalities, tools, and services to users, customers, and platform partners. It offers Momo mobile application that enables users to establish and expand their social relationships based on locations; interests; and recreational activities, including live talent shows, short videos, social games, and other video- and audio-based interactive experiences. The company also operates Tantan, a social and dating app to help its users to find and establish romantic connections, as well as to meet interesting people primarily for young mobile Internet users. The company was formerly known as Momo Technology Company Limited and changed its name to Momo Inc. in July 2014. Momo Inc. was founded in 2011 and is headquartered in Beijing, the People's Republic of China."
Social media is the future.
And this has to be one of my most favorite bullish trading patterns:

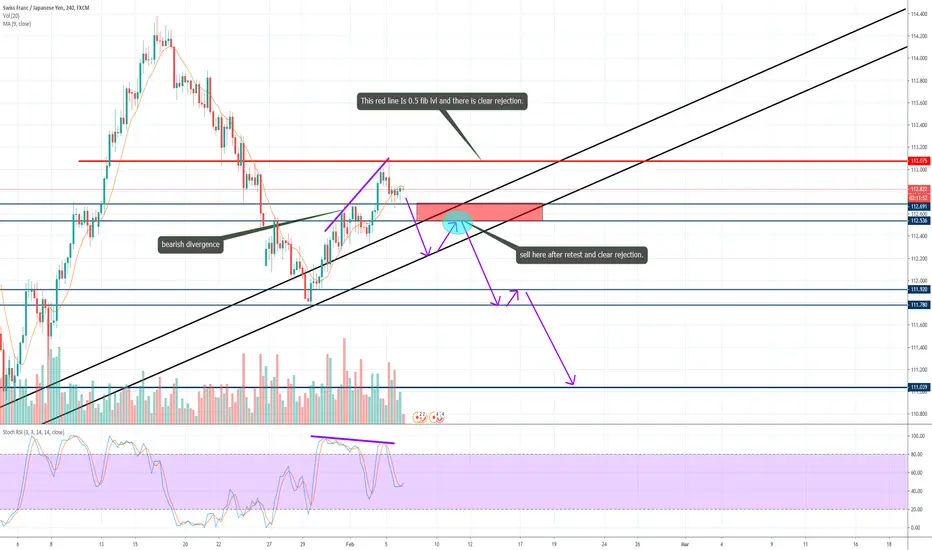
CHFJPY Set Up...Be ready to short. My technical analysis points towards big bearish movement, but we wont chase it. instead we will wait for a retest as shown and after clear rejection we can sell. DO NOT continue this plan if the novel corona virus gets very very serious!
. 0.5 Fib rejection
. bearish divergence
these r examples of why I feel it will drop.
Trendline and resistance Price is at area of resistance.
I cant see any fib retracement points.
There is divergence.
A break out and reversal candle would be required prior to entry. For now it's a waiting game.
