I know, it's scary… But it's on my watchlist. This is one of my favorites in the industry.
It's overall solid. I plan to buy this year.
I think positive future earnings are priced in so I'll wait for people to be disappointed by Q4 :| (If they're not, it's an even stronger buy)
It's at about $0.70 on the dollar according to my latest valuation. I'm kinda waiting for the earnings, really.
It's been pretty solid over the last decade, before 'rona. I don't see why it wouldn't in the future, in fact I believe that it's bound to go up despite the apparent "wedge".
I need to look deeper into the background of the company before really committing.
I may buy before finishing my homework, in which case I'll use a stop loss.
Please don't rely on my opinion. Do your own research (especially since I'm not done with mine)
Dividends


$Marps seasonal advantage looking for a retestNatural gas in the winter have a seasonal advantage
the low number of outstanding shares and the 5 mil market cap makes this stock a candidate for a big upside move
price target 9-11$


Long term bullish trendSouth African Rand is entering a relative strength period against the Australian Dollar that unleash 2 trading Ideas.
First Idea: buy for 10-20% profit with similar stop-loss.
Second Idea: buy for long term (at least 1 year) and benefit from both positive interest differential and positive trend for at least 30% estimated gain with 20% stop-loss.

Altria poised to climb from hereOn this week's ISM PMI report, the fastest-growing industry for September was "Food, Beverage, and Tobacco." So I looked at the tobacco space over the weekend and noticed that the tobacco company Altria recently made a fairly large price correction and looks to be making a U-shaped bottom, with an imminent bullish cross on the MACD. With the positive technicals and positive economic data for the sector, it looks like a pretty good buy.
Plus, fundamentals and sentiment look fairly good, too. Altria pays a 9% dividend, and its earnings, sales, book value, and free cash flow are currently priced an average of about 37% below the median price for the last three years. Investors have been discounting tobacco stocks due to competition from e-cigarettes, but the reality is that Altria is poised to capture market share in the e-cig space too, with a couple hundred vape-related patent filings over the past few years. In terms of sentiment, there's 23% upside to the average analyst price target, according to TipRanks, and the Equity Starmine analyst summary score is 9.2/10. Options traders are bullish, with more than twice as many calls as puts.
Consumer staples and dividend payers tend to outperform in a recession, so Altria has potential as a defensive hedge should the recession double dip.

Dividend information Please can someone inform as to how to find dividend data on TradingView .
Ex dividend dates ? And yields ?
Thank you !!

$CSCO - the gambleTook out a call option on this, far in to the future.
There are a few that are being punished and dumping in the short term and trying to pick up a few bucks in case they flip the script.
Very very small investment for this gamble. If we see $47 / share by 10/16 - its a 117% win. I would sell at 50% probably.

ENPH or SEDG or TAN - Lockstep CorrelationSolar Edge stays on my buy list, but Enphase keeps a direct correlation to SEDG with similar P/E ratios, but at the quarter of the cost. Further correlation with the TAN of course, but if you want to track the two inverter companies, you can do so with TAN and at least get dividends :)

DHT Long PlayOn the fundamental side:
- Mgmt reaffirmed dividend of $1.4/sh, ~22% yield. DHT has been consistent with its dividend for 42 consecutive quarters.
- DHT is rather insulated from most economic downturn. One key assumption we have is that we will not see another pandemic quarantine lockdown on the scale of what we saw in March/April. Other than that, DHT actually benefits immensely from any backwardation in oil prices
- If we right and the market is in denial of DHT's dividend, assuming mgmt. team maintains its current track record - we expect DHT to trade up to match its dividend at $13-18/sh
On the technical side:
- On the daily, we see a massive cup and handle accumulation pattern, with measured moves pointing towards the ~$14.5/sh level
- Initial price target level of ~$14.5/sh lines up with Fibonacci retracement to the 50% level

Altria Fundamental TrendsThese are the fundamental metrics I'm looking at that support my bullish/bottoming thesis in Altria. Technical chart is linked below.

If you didn't know which company this was, would you buy?Would you buy purely on the technicals not knowing what stock this is? It's tempting!
Looking at a long-term monthly chart over a 30+ year time frame you can see each time RSI reached the 32.6 level this stock has bottomed. The large time frame over which this has been observed strengthens my confidence that this could be yet another bottoming for this stock.
The last four instances dividend yield has peaked above the current 7.88% annual dividend yield, this has also corresponded with a major bottom for this stock.
On a weekly frequency, the MACD MAs have been establishing a series of higher lows further confirming a long-term bottom is forming.
Lastly, the 200 Monthly EMA has been a strong support line over this 30+ year time frame. It looks as if the 200 EMA has held once again and price is now working it's way up of this support area.
From a purely technical perspective, I would buy this stock. Even if this stocks hovers sideways along its 200 Monthly EMA there is a nearly 8% dividend to collect.
With all that said, I do think this is a controversial stock but I think there's a compelling fundamental story too. Gross margin % and operating margin % have been steadily increasing over this long time period. There are also new frontiers (such as cannabis $CRON) which have the potential to be profitable investments in the long-run. However, Juul is an example that hasn't worked out well and resulted in losses for the company. The company currently trades at 9.41 full-year forecasted earnings and price-to-sales ratio of 3.85.
I still think this is an opportune time to get in at cheap valuations supported by technicals meanwhile collecting a large and sustainable dividend.

WINUSD [UPSIDE CONTINUATION]WINUSD
Weekly:
-Bullish on FA
-Breaking Resistance
-Can give us minimum of 50% up to 90% profits
Entry: 1221-1293
TP: 1883, 2103, 2360
SL: 1065

OPENING (IRA): IYR AUGUST/SEPTEMBER 66/68 SHORT PUT LADDER... for a total of 3.00 in credit.
Notes: With rank/implied at 49/38, looking to re-up an acquisitional setup in this dividend yielder (3.36%) for the IRA.


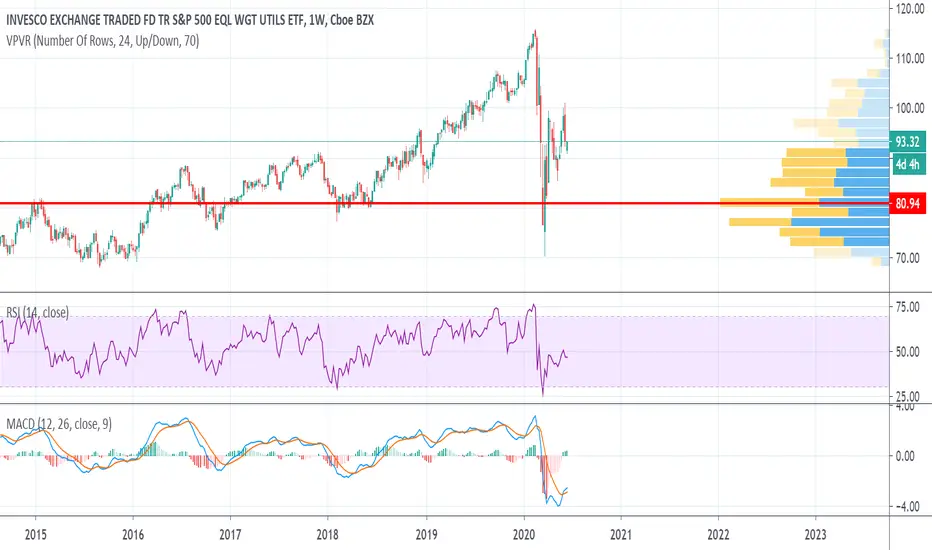
Utilities could substantially outperform this yearUtilities traditionally are a recession safe haven, although in March they fell along with the broader market. There is reason, however, to think they will outperform going forward. According to an analyst poll conducted by FactSet, analysts expect utilities to be the sector least affected by the pandemic, with 2020 earnings down only 1.6% from pre-pandemic forecasts. The next strongest sector, information technology, is expected to take a 6.5% hit. Of the S&P 500 companies that have confirmed their previous 2020 guidance, 53% are in the utilities sector. Here's the link to the FactSet poll:
www.factset.com
Although earnings forecasts for the sector are down only 1.6%, utilities stock prices are down about 16% from their pre-pandemic peak. That suggests that utilities are now trading at a significant discount. Additionally, RYU has a nearly 3% dividend yield and has been a growth sector due to the widespread adoption of renewable energy technologies by both corporations and governments. In 2019, the utilities sector roughly doubled its earnings over the previous year.
In terms of technicals, utilities recently made a bullish MACD cross on the weekly chart. There's a little bearish divergence on the histogram, and the daily MACD is below the signal line, which makes some short-term price weakness a real possibility. For the longer term, however, the technical setup looks good. RYU is sitting atop a block of support on the volume profile, whereas to the upside there's much less volume profile resistance.
Note that RYU is not optionable. If you're like me and you'd like to buy some long-term (2022) option calls, you could look at the XLU S&P 500 utilities fund. I prefer equal-weight funds because they tend to outperform long-term, but in addition to being optionable, XLU has a better dividend yield and a better expense ratio than RYU.

GEO Group IncFirst off, I view REITs in general as completely undervalued in our markets and due a solid run. Now with GEO I see them weathering the "storm" of covid-19 due to them being in a safe niche. They are heavily involved in the "for profit prisons" which I don't see going away any time soon (opposite of commercial office buildings). GEO also has a high dividend yield of over 17% which protects any slight drawdown.
Technically speaking, the monthly candle is consolidating over a historic support/resistance zone. The zone originally acting as reistance, which led to a drawdown of -88% and a 7 year bear market. Acting as heavy support, GEO has seen surges of 175% and 221% from this zone. Add in a sub 35 RSI with volume steady increasing and the bull case gets stronger by the day.

$KDP about to Dip to < $25First off, please don't take anything I say seriously or as financial advice. As always, this is on opinion based basis. That being said, let me get into a few of my key insights. Keurig Dr Pepper recently announced its new dividends and has been an under performer this quarter. I was hoping within the last week it would close at a $30 price. Many analyst are giving it a sell rating, and I expect it to at least dip below the $25 price point.

Nearing buy zone! NYSE:GEO High risk juicy stock. Could be back with potential 50% if the real estate does not break up.

Hedging bets on energyThere's a lot of action in energy stocks today as Donald Trump announced on Twitter that Saudi Arabia and Russia are closing in on a deal to cut production by 10-15 million barrels per day. This is going to be challenging, since the two countries only produce 23 million barrels per day between them, so they'd have to cut their production in half. Shortly after Trump's tweet, a Russian spokesman announced that in fact no specifics have been discussed, so it seems that Trump's tweet was very premature.
Nevertheless, there's some reason to think that Saudi Arabia, at least, will cut production. Last night, Senator Kevin Cramer said he had told Trump that "we should not keep armed forces in Saudi Arabia protecting their oil assets while the Kingdom declares war on our oil producers." In other words, Cramer told Trump to twist the Kingdom's arm by threatening to withdraw US troops amid a rebellion in Yemen and threats from Iran. Assuming that this is, in fact, the strategy Trump is using, I think it's very likely to succeed whether Russia plays ball or not.
Here are a couple other bullish signs for energy: the US is addressing the storage shortage by renting out space in the strategic oil reserve to private companies, and crude inventories are falling in China for the first time in months because refineries have reopened there.
On the other hand, there are bearish signs too: Rystad Energy predicts a large decrease in energy demand in April, and today's jobless claims report would tend to confirm that. 6 million jobs lost means the economy is in a very bad place, and the weakening of demand may persist long after lockdowns are over.
It's hard to resist taking some positions in the energy sector with so many bargain dividends available, such as the nearly 10% dividend on Exxon-Mobil. (And Exxon should have the cash to be able to sustain that dividend even if oil prices remain weak.) However, what if oil prices continue to fall? For that scenario, it's useful to have a hedge.
I am hedging my Exxon-Mobil position with an oil tanker stock, specifically Frontline, Ltd. (FRO). Tankers and producers have been moving opposite each other, with tanker stocks gaining when oil prices fall and falling when oil prices rise. That's because weak oil prices lead producers to ship their oil to storage locations, which increases demand for tankers. Frontline has a nearly 20% dividend yield right now, so I should make money from dividends on both sides of this trade, regardless of what happens to prices.
I also have a smaller hedge in USO, an ETF that holds physical oil. This is because rising oil prices may not always be good for Exxon-Mobil. What if oil prices rise because big producers like Exxon have cut production? Then both my Exxon stock and my Frontline stock would fall even as physical oil prices rise. So I want to have some physical oil in my portfolio too, to offset the effects of any Exxon-Mobil production cuts. Unfortunately there are no dividends from USO, which is why I have only a small hedge here.

Watch this critical levelIt sure looks like the S&P 500 is getting rejected from the 20-day exponential moving average (EMA) today. With support at the 10-year trend line and resistance at the 20-day EMA, the price will get squeezed between the two in the coming days, and we should see a breakout one way or another.
I tend to think the breakout will be downward. Futures markets are predicting that S&P 500 dividends will fall 30% this year, which means that the underlying value of S&P stocks continues to erode even as the price has been rallying. The price is only about 18% off its high, so it looks to me like the dividend drop may not be priced in yet.
If you're going to take a short position, you could enter near resistance at the 20-day EMA and set a stop loss just above it. Or you could wait for the 10-year trend line to break.

PACW PACIFIC WESTERN BANK LONG SET UP (11%) DIVIDENDS ATH $62BUY PACW LONG
ENTRY 1 20.50
ENTRY 2 19.86
SL16.00
TP.1 25.50
TP.2 30.86
TP.3 40.50
TP.4 $48.00
