SWDY Chart AnalysisEl Sewedy Electric stock trend rose last period from the support line 76.249 to the resistance line 83.77, then rebounded to reach the support line 79.001, so the general trend was down by 1.04%. The stock rose and broke the first support line at 78.287, to get the second support line at 78.389, then the third support line at 78.650. On the other hand, when the stock rebounded, it broke the first resistance line at 83.505 to reach the second resistance line at 83.097, then the third resistance line at 82.914. This upward trend is due to the acquisition of the majority of the stake in Thomassen Service, which is 60%. This step unlocks expansion into Europe, the Middle East, and Africa.
Dividends

EURUSD I Weekly CLS I KL - OB, Model 1 target - 50% AMD in playHey, Market Warriors, here is another outlook on this instrument
If you’ve been following me, you already know every setup you see is built around a CLS range, a Key Level, Liquidity and a specific execution model.
If you haven't followed me yet, start now.
My trading system is completely mechanical — designed to remove emotions, opinions, and impulsive decisions. No messy diagonal lines. No random drawings. Just clarity, structure, and execution.
🧩 What is CLS?
CLS is real smart money — the combined power of major investment banks and central banks moving over 6.5 trillion dollars a day. Understanding their operations is key to markets.
✅ Understanding the behaviour of CLS allows you to position yourself with the giants during the market manipulations — leading to buying lows and selling highs - cleaner entries, clearer exits, and consistent profits.
🛡️ Models 1 and 2:
From my posts, you can learn two core execution models.
They are the backbone of how I trade and how my students are trained.
📍 Model 1
is right after the manipulation of the CLS candle when CIOD occurs, and we are targeting 50% of the CLS range. H4 CLS ranges supported by HTF go straight to the opposing range.
📍 Model 2
occurs in the specific market sequence when CLS smart money needs to re-accumulate more positions, and we are looking to find a key level around 61.8 fib retracement and target the opposing side of the range.
👍 Hit like if you find this analysis helpful, and don't hesitate to comment with your opinions, charts or any questions.
⚔️ Listen Carefully:
Analysis is not trading. Right now, this platform is full of gurus" trying to sell you dreams based on analysis with arrows while they don't even have the skill to trade themselves.
If you’re ever thinking about buying a Trading Course or Signals from anyone. Always demand a verified track record. It takes less than five minutes to connect 3rd third-party verification tool and link to the widget to his signature.
"Adapt what is useful, reject what is useless, and add what is specifically your own."
— David Perk aka Dave FX Hunter ⚔️

ORAS Stock Fundamental AnalysisORAS trend was neutral between the support line 266.851 and the resistance line 291.935, the trend was down by 0.14%. The stock rose, and broke the first support line to reach the second support line 267.905, then the third support line 268.432. It's expected to keep rising till reaching the resistance line 290.144, then 290.671, because of the CBE's decision about cutting the interest rate by 2.25% which will have a positive impact on corporates because according to the current reasons behind the economic activity decreasing interest rate will lead to decreasing the cost of borrowing which will decrease the cost of production and will increase the corporates' profit and their monetary value. On the other side, this will decrease the products' price and individuals will have a higher will to diversify their investment beside increasing their purchasing power as well.

Good PalantirianNoticed recently there is very few NASDAQ:PLTR stock for sale on the market. As a good and kind trader I decide to borrow ad sell couple of NASDAQ:PLTR like a good move to provide liquidity to the market and help other traders to obtain so passionately desired Palantir stock.
Dear Palatirians pls don't get me wrong. I'm not betraying our faith, just need to step back for a while

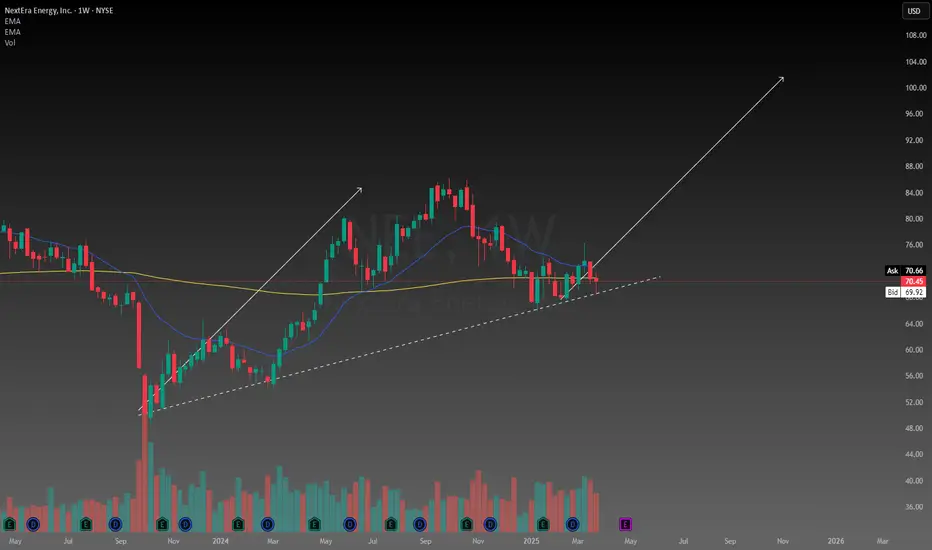
Next Era trade ideaA company dedicated to clean energy, focusing on solar and wind. With a large market cap and operating throughout Canada and the US, this company has proven itself being able to be profitable and grow. It looks like price has found support at the trend line and its possible we can get a second leg up.
BHP - Leading power in the Copper business!Overview of our analysis for BHP!
BHP Group Limited (BHP) is one of the world’s leading diversified natural resources companies, with operations in minerals, oil, and gas. Headquartered in Australia, BHP is a dominant player in the global commodities market, particularly in iron ore, copper, and coal.
Strong Financial Performance
Revenue Growth: BHP has consistently delivered strong revenue growth, supported by rising commodity prices and operational efficiencies.
Robust Profit Margins: The company's disciplined capital allocation and cost management strategies have enabled it to maintain high profit margins.
Dividend Yield: BHP offers an attractive dividend yield, making it a preferred choice for income-focused investors.
Copper Market Leadership
Strategic Copper Operations: BHP’s Escondida mine in Chile is the world’s largest copper-producing mine, providing significant leverage to the rising demand for copper.
Green Energy Transition: Copper plays a vital role in renewable energy infrastructure and electric vehicles, positioning BHP to benefit from the global energy transition.
Investment in Growth: BHP is actively investing in expanding its copper production, further solidifying its leadership in this critical sector.
Diversified Portfolio and Resilience
Balanced Commodity Exposure: BHP's diversified commodity mix, including iron ore, copper, and metallurgical coal, reduces reliance on any single market, providing stability in volatile conditions.
Long-Term Contracts: The company maintains long-term contracts with key customers, ensuring stable revenue streams.
Operational Excellence: Continuous investments in technology and automation have enhanced operational efficiency and safety.
Sustainability and ESG Commitment
Net Zero Commitment: BHP has set ambitious targets to achieve net-zero operational emissions by 2050.
Sustainable Mining Practices: The company implements innovative technologies to reduce its carbon footprint and water usage.
Community Engagement: BHP is actively involved in community development programs, strengthening its social license to operate.
Entry: 49.63
Target: 73.01
SL: 36.30 - We are currently sitting on strong support zone for the company , which gives us a good heads up for a strong uptrend ahead, the SL is set up on the previous low if we see a huge cooldown in the overall commodity market, but at the current low supply of Copper we beleive that this is just deffensive point to protect the trade.

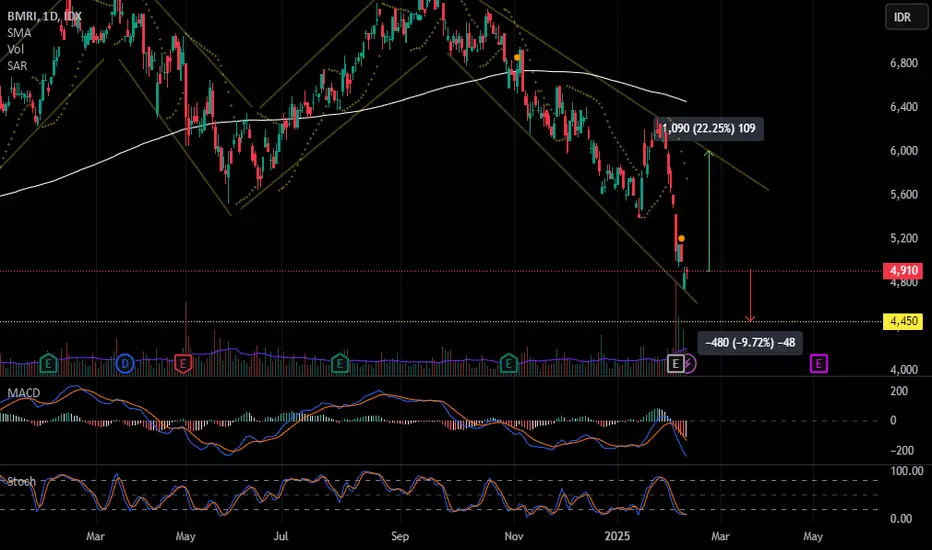
Buy on Weakness BMRI, relatively close to the Bottom.
BMRI has been in a downtrend for 4 months, with the last breaking through the support level of 5400 (January 14, 2025).
cutloss level at support 4450 (-10%) and Target Price 6000 (upper trend line).
Risk and reward ratio 1 : 2.
Buy on Weakness BMRI 4910.

Omnichart - Dividend pays - 2 - DSL,CCIF,JAAA,BUCK,TBIL,BNDJAAA has been the best stable performer. If you want to take risk and earn higher dividend then the right value for them is when their dividend adjusted performance meets JAAA's dividend adjusted performance. Till then stay in JAAA (Its the Janus Henderson AAA CLO ETF), the other closer alternatives are BUCK and TBIL. JAAA and BUCK provide excess returns over risk free return of TBIL. JAAA seems to outperform BUCK.
For a long term investor who wants to come out of equities during market turning events on a long term basis (lets say monthly chart) the following strategy may be help grow your wealth/ earn income :
Transfer from equities or risky assets into JAAA (or BUCK/TBIL depending on your preference) and another turn on a long term basis like on a monthly chart slowly scale out of JAAA back into the risk assets of choice.

BTC HALVING APRIL 2024! 479497$As we approach the impending halving event in 2024, slated to commence in a month, speculation arises regarding its potential outcomes. Historical data provides insights into recurring patterns, yet uncertainty looms regarding whether past scenarios will manifest once again.
We invite your insights:
Do you foresee growth or a departure from traditional trends towards decline?
Your perspectives are welcomed and valued.

chasing $NLY. Can't help myselfI am buying some NYSE:NLY , even though the stock is very overbought in the short term (see Money Flow Indicator at bottom of chart). I like the breakout through the dotted line connecting the highs from Oct 10 and Nov 17. After breaking through this morning the stock pulled back underneath the dotted line, but has now recaptured the high.
I believe that the macro environment supports the idea that the lows may be in for the mortgage REITs. This one trades at roughly 1x book value, while offering a 14%+ dividend. The timing might not be ideal on short time scale (again, it's overbought) but this is intended to be a long-term hold and I don't want NYSE:NLY to completely get away from me.

Microstrategy follows BTC patternWell known crypto bull Michael Saylor and his Microstrategy. Here we are, approaching demand zone as BTC drops. We are early here but keep an eye on it for later entry or DCA on the way down.

FMC - A deep value play for the steel stomach investor The Foxx is back.
After the stellar returns of 2024, and by that I mean triple digits %, the Foxx is back to give out a charity to his followers.
FMC
A deep value agricultural stock with rising inventory and low market demand. But, like the market always does - what goes down - goes up ! the demand is expected to go up in 2026-27 and the invesntory goes down at the same time.
Book value per share is ridiculously close to the price.
The Foxx announces a 10,000 stock position on FMC at an average price of 38.10 as per 10th Feb 2025 830am ET
No lines, no colors, no ATH or no fibonnacci .. Just pure value investing.
Do i sound arrogant ? I do and I am. Because i only give out winners. see my previous ideas and like they say - the rest is history !!
Make money
Foxx

$HSY: A Potential Bargain for Dividend InvestorsThe chocolate giant NYSE:HSY might be approaching a price bottom ahead of Thursday's earnings
The stock of The Hershey Company ( NYSE:HSY ) has now triggered my favorite technical indicator, a Bollinger Bands and RSI oversold signal on a weekly chart (see Chart 1)
This suggests that we might see a price reversal soon if the company effectively addresses its current challenges
Earnings Expectations and Volatility:
The options market anticipates a price movement of approximately +/-3.8% following Thursday's earnings
Recent Price Pressures:
- Surging Cocoa Prices:
Cocoa prices have skyrocketed (see Chart 2), but I believe this might be a bubble ready to burst as such short-term sharp rises are usually not sustainable
- Declining Demand:
There's been a noticeable decrease in sweets consumption, influenced by the rising trend of weight loss medications. I can't imagine that humanity will be deprived of sweets forever 😅
Fundamental Insights:
Chart 3 highlights key financial metrics for NYSE:HSY :
- Market Capitalization: ~$30 billion
- Cash Reserves: Approximately $600 million
- Debt: $5.6 billion, indicating a manageable financial structure for a company of Hershey's stature to weather further market turbulence
- P/E Ratio: Now at 17, which starts to look appealing
- Dividend Yield: At 3.7%, it's particularly attractive for European investors seeking income
Investment Considerations:
Given that this potential reversal signal appears on a weekly chart, expect significant volatility around the earnings announcement
Also the bottoming process can take several months and a capitulation event after earnings could be possible
However, with these signals, an attempt at a price recovery around earnings seems quite probable

BTC is a fat cow IS IT going up or down ?? i forget, i need i furu to come educate me on which rollercoaster ride its going on

I'm banking on this one - LONG @ 24.50I missed this one at the close yesterday and tried to get in after hours at 24.65 but failed. Lucky me- I got in this morning at 24.50 instead. After selling NYSE:NU yesterday I am underrepresented in financials, so I'm in here.
Not the prettiest chart, but it's paying me an almost 4% dividend if I have to wait. I don't expect to have to wait long enough for it to matter, it's just a nice "safety net" in case I have to.
Competing trendlines in play here, but this is is a quick flip, so they are likely not to be significantly influential. Just thought I'd point them out here for the chartists among us.
Per my usual strategy, I'll add to my position at the close on any day it still rates as a “buy” and I will use FPC (first profitable close) to exit any lot on the day it closes at any profit.
As always - this is intended as "edutainment" and my perspective on what I am or would be doing, not a recommendation for you to buy or sell. Act accordingly and invest at your own risk. DYOR and only make investments that make good financial sense for you in your current situation.

On the way to Devidend MomentumThe historical track record indicates that the final dividend share for BBRI typically occurs in March. This presents an opportunity to strategically position our portfolio. We can either aim to capture the dividend payout or capitalize on the potential price pullback that often follows the dividend distribution (At ex-date candle gap). To maximize our entry point, we can wait for BBRI to reach its nearest weekly support level, as it is currently trading close to it and being strong support. This approach allows us to potentially acquire shares at a discounted price, especially considering the current downtrend.

Mishra Dhatun LTDThe company caters to Military Equipments and Its a long Term hold so we should look to buy into this. Overall the company has a long journey to fill can it be a next BDL

NVDA Multi-Asset Income StrategyRecently, I've been looking a lot at Yield Max ETFs and other options-based yield ETFS more generally such as QDTE, XDTE, RDTE, QQQI, SPYI, YQQQ (inverse), etc.
One possible way to outperform SPY & QQQ, may be to consider investing in such ETFs, though this is purely theoretical s tradingview does not provide a quality backtesting software for a complex multi-asset, multi-directional strategy like this. Nothing in this strategy should be considered financial advice and there are various factors to consider, such as beta decay, mismanagement of the ETFs, tax advantages/disadvantages, reinvestment risk, risks associated with options in income-based derivatives, risks with leveraged assets, and the obviously risks with inverse assets.
In this chart, we are looking at the leveraged ETF NVDL, which tracks NVDA. It's important to note that this asset will decay whenever NVDA trades sideways or goes down over substantial periods of time, and when NVDA goes down the negative % returns are multiplied. Therefore a trader or "sophisticated investor" (FINRA term) needs to not only optimize their position size for a trading period, but also optimize the timing of entry's and exits on multiple position. They will also want to model, volatility, decay, and reinvestment risk (arguably the hardest in this case. This post will not discuss the specifics of those and instead, these topics should be considered as a form of "homework" for you, the reader to think about and discuss in the comments as food for thought.
In this theoretical multi-asset income strategy, risk is managed through the use of income based ETFs that are either bullish or bearish, I think of this as " directional income ". In this case, NVDY is the bullish income asset and DIPS is the bearish income asset, both of which pay dividend monthly and their price performance behaves very similar to a leveraged ETF, in the sense that they only really increase when the underlying the underlying asset moves in the direction of the income derivative. Theoretically, by managing position size with the use of a modified Kelly Criterion which accounts for fed rates, the decay of the asset, and timing (through technical analysis, seasonality and quantitative analysis), I wonder if a trader could swing-trade between various income-based derivatives and leveraged assets, in order to optimize both income and grow irrespective of market conditions.
In truth, I'm still not sure if this is a completely degenerate idea no different to the way banks stacked bad loans together in 2008 and slapped a Grade A rating, and in the process over valued quantitative methods (see the book "Quants") as a sort of grad delusion to completely avoid risks, like a doctor wishing to delete pain from the world with an addictive pill, shilled by Big Pharma... Only in this case, instead of CMBS, it's ETF, leveraged ETFs, options on both, creating a derivative, then stacking more derivative on top of that...
Who knows, though... Maybe this could be a way to profit from this madness?
I honestly don't know.
What I do know is, I find the idea of " directional income " as a hedge more appealing than an inverse leveraged ETF and I'm curious how to apply this to either a single asset or multi-asset portfolio. It's a very interesting idea and I plan to spend the year exploring this idea at the cost of my own capital, rather than someone else's capital.

BTC Ultra SNIPER SCALP to 100,000K!!!PLEASE CHECK RELATED PUBLICATIONS BELOW!!!
As mentioned in my earlier (linked below) BTC to 75k chart,
As it happened ditto,
one can sniper it to 100,450 to 101k from CMP with steep SL's to 97,350. remember its a sniper scalp. Stances are marked as such! Follow the new green line marked and link below marks how its been done earlier!

standard fill the wick pattern on ole RIPcoinseen it before many times, now with added typical ex arpee trader stop loss and take profit, dont forget to eat your garlic bread

HAUTO: TP NOK 141,- Generous dividends (+25%) [Pink: HOEGF]Some say Car-carrier (PCTC ) trade macro is challenging in, others claim this comes to pass late '26 or '27. All the while generous dividends are an insurance. Short term movements may meet resistance, must hold +100-ish, looking to medio jan 2025 for more upside.
Conensus TP : NOK 141

Darvas Box Strategy - Break out Stock - Swing TradeDisclaimer: I am Not SEBI Registered adviser, please take advise from your financial adviser before investing in any stocks. Idea here shared is for education purpose only.
Stock has given break out. Buy above high. Keep this stock in watch list.
Buy above the High and do not forget to keep stop loss, best suitable for swing trading.
Target and Stop loss Shown on Chart. Risk to Reward Ratio/ Target Ratio 1:2
Stop loss can be Trail when it make new box / Swing.
Be Discipline, because discipline is the key to Success in Stock Market.
Trade what you See Not what you Think.
