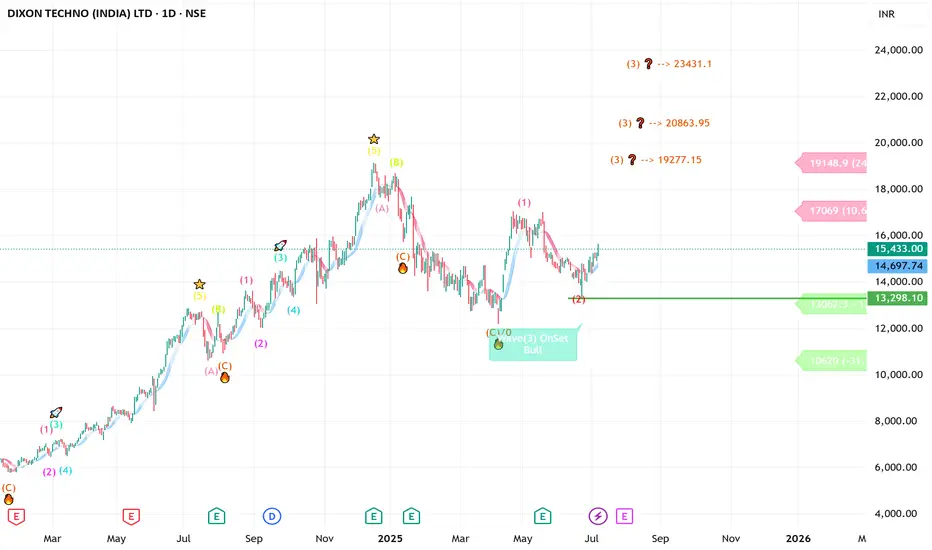
DIXON -----Daily counts Fresh Implus start anytime -UpsideDIXON -----Daily counts indicate Excellent bullish wave structure.
Both appear to be optimistic and this stock invalidation number wave 2 low
target short / long term are already shared as per charts
correction wave leg seems completed
Investing in declines is a smart move for short/ long-term players.
Buy in DIPS recommended
Long-term investors prepare for strong returns over the next two to five years.
one of best counter
Every graphic used to comprehend & LEARN & understand the theory of Elliot waves, Harmonic waves, Gann Theory, and Time theory
Every chart is for educational purposes.
We have no accountability for your profit or loss.
DIXON
Review and plan for 26th June 2025Nifty future and banknifty future analysis and intraday plan.
This video is for information/education purpose only. you are 100% responsible for any actions you take by reading/viewing this post.
please consult your financial advisor before taking any action.
----Vinaykumar hiremath, CMT

Dixon in bearish zoneJadugar and Paka Kam generated signals Becho @ 16217 means sell at 16217, lets see how much it will fall.

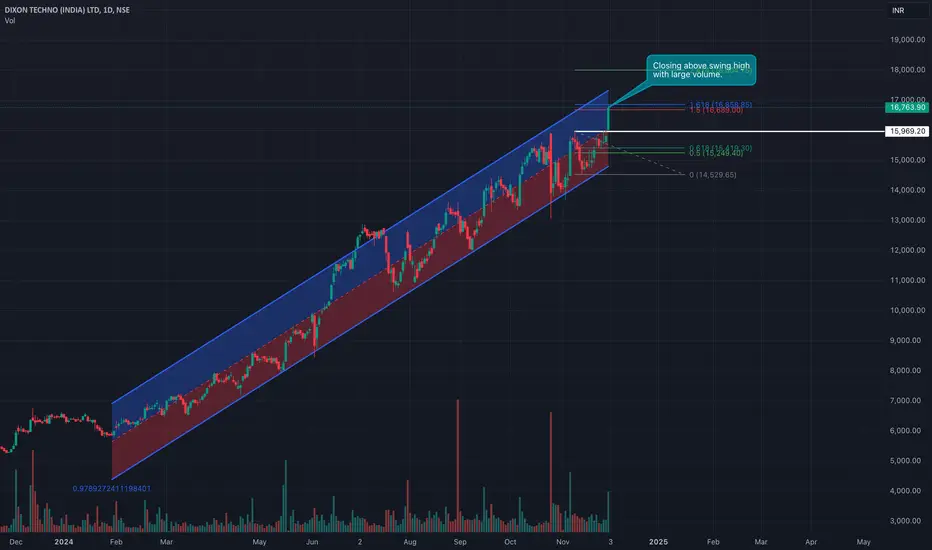
Dixon Tech: Turning bullish in short term swingToday it closed above previous swing high with good volume.
Stock is already in bullish trend since long time. It is in bullish channel.
You can buy at current price around 16800 or lower.
For SL if you turn to 1H timeframe, 16500 close is your SL.
Good for swing trade for short number of days.
Targets not decided as price is ATH but with help of fibonacci 18000 looks like a good target.
Trade looks good with risk reward also.
DIXON Short Setup: Evening Star & Potential HNS with Trendline Weekly Analysis
Pattern Observed: Evening Star on Weekly Timeframe
Additional Insights
- The Evening Star pattern tends to be more reliable on Daily and Weekly timeframes, making this setup particularly noteworthy for swing traders.
Trade Setup
1. Entry: Enter after a decisive break below the low of the third (red) candle in the Evening Star pattern.
- Alternatively, you may enter on the fourth candle if it signals a reversal, with a stop loss set according to your risk tolerance.
2. Stop Loss (SL): Can be set based on your risk preference, usually just above the high of the Evening Star pattern.
3. Target (TGT): Consider scaling out at key support levels or use the measured HNS target as detailed below if the formation completes.
---
Potential Head and Shoulders (HNS) Formation
Trade Setup for HNS Pattern:
1. Entry : Enter when price decisively breaks below the neckline on a closing basis.
2. Target (TGT): Measure the distance from the top of the head to the neckline and project it downwards from the neckline for your target.
3. Stop Loss (SL): Place the stop above the head of the HNS pattern.
---
Additional Confirmation
I've drawn a trendline to monitor for a potential breakdown. If either the Evening Star or HNS pattern aligns with a trendline break, it would serve as an additional confirmation for a short position.
---
This setup combines a confluence of technical factors, making it robust for weekly trading decisions. Comments and thoughts welcome!
IMPORTANT THINGS TO REMEMBER
1. Don't be fooled by opearators Theyll try it take it up to sell
2. Don't be a hero, follow SL with 1% extra loss max. (as setup is on Weekly TF)

Dixon's Bearish Breakdown – All Targets Smashed!DIXON Stock Technical Analysis:
In the 15-minute timeframe, Dixon saw a short trade entry at ₹15,199.60, with prices moving decisively lower, hitting all the predefined targets.
Key Levels:
Entry: ₹15,199.60
Stop Loss (SL): ₹15,349.80
Target 1 (TP1): ₹15,013.95
Target 2 (TP2): ₹14,713.50
Target 3 (TP3): ₹14,413.10
Target 4 (TP4): ₹14,227.45
Observations:
The price plunged after a clear rejection below the Risological dotted trendline, confirming the downtrend.
Dixon met all short targets as it continued its bearish trajectory.
This short trade capitalized on a strong breakdown, with all targets being successfully hit. Traders should remain cautious as the bearish momentum might be slowing down, offering potential reversal signals ahead.

Dixon Daily Trade: 350% Massive Growth SecuredWe entered a long position on Dixon at 3253.30, and the trade has seen a remarkable growth of 358.54% over 511 days. With all targets up to TP4 (5619.40) successfully achieved, the trailing stop is currently at 11,790 to protect and safeguard our profits. This trailing stop will ensure that gains are locked in if the price pulls back to this level.
Target Points Achieved:
TP 1: 3686.05
TP 2: 4386.35
TP 3: 5086.65
TP 4: 5619.40
Trailing Stop: 11,790
Stop Loss (SL): 2903.15
We’ll continue to hold the position as the price trends upward, while the trailing stop secures our profits.
This massive positional trade demonstrates the strength of the Risological swing trading indicator.
Another killer trade caught!

DIXION Break outNSE:DIXON
Long time RS positive stock. retesting the 8200 levels after breaking out.
Heading towards all time high.

DIXON TECHNOLOGIES LEVELSHi, Here i am sharing you upcoming support and resistance of NSE:DIXON .
This is my personal analysis, only to learn stock market behavior. Thanks.

DIXON - Bullish Swing ReversalNSE: DIXON is closing with a bullish swing reversal candle supported with volumes.
Today's volumes and candlestick formation indicates strong demand and stock should move to previous swing highs in the coming days.
The stock has been moving along the horizontal support for the past few days which is indicating demand.
One can look for a 8% to 12% gain on deployed capital in this swing trade.
The view is to be discarded in the event of the stock breaking previous swing low.
#NSEindia #Trading #StockMarketindia #Tradingview #SwingTrade

DIXON BULLISH DIVERGENCE ON DAILY CHART!!!!Hello to everyone,
As we can see there is a Bullish divergence in RSI & PRICE on daily timeframe . This is indicating that price has not much momentum to go downside. We can expect a trend reversal in Dixon.
The price consolidating in a range from last few days. As per the theory of range, the price will go to the side on which the breakout occurs. But here the price is trading in oversold zone and BULLISH DIVERGENCE is also happening between PRICE & RSI on daily chart. So there is higher probability of that breakout will happens upside.
Dixon
👉🏻Added in watchlist✅👍
👉🏻Breakout possible above 2860+ close (Buy abv BO)✅
👉🏻Above breakout gap filling possible 3150 to 3350+🎯
👉🏻Quality stock👍
👉🏻Base support made at 2550👍
👉🏻RSI Bullish Divergence✅
Traders, if you liked this idea or if you have your own opinion about it, write in the comments. I will be glad

{ DIXON } : {ONE LAST BUY FOR THE TREND!!! 1:5}
Price has confirmed an Uptrnd by violating a Potential Supply formed in 4H chart, then formed this Fresh Demand Zone.
Which defines the Reward to Risk Ratio of 5:1, till Price reaches the Fresh Quarterly Supply, Price shoould STRONGLY DECLINE after the Target of BUY Trade is achieved.
CHEERRRRRSSSSS!!!!! ENJOY THE RIDE !!!

DIXON Buy Idea 22.01.2023NSE:DIXON is trading at demand price. My idea is to take entry at level of 3501 with stop loss of 3400 (-100 Points risk). My expected up side target will be 3760.00
Note: This is my personal analysis, only for learning. Thanks.

Dixon in symmetrical triangleFrom 19th October the stock has been consolidating in a symmetrical triangle pattern.
It is near its support.
Wait for the confirmation before entering inro the stock.
Nearly 3 months of consolidation has been there.
Once the stock price leaves the consolidation phase it can give a good moment either side.

Dixon Technologies Continuously moving upwards in a channel and currently is on ema20 support any green candle with nice volume good market sentiment could be a good entry, however if seek support 4845 and 4735 will be immediate and strong support, and anytime breaks channel created with green trendline can result in quick rally and new levels.


DIXON Daily Time Frame AnalysisDIXON Daily Time Frame Analysis
SO given a good breakout with a good volume
- If it continues it rally we can see 5500-5800-6000 within next few sessions
- But may consolidate it is good as long as it is above 5000
-Green Candle are Resistance
-Yellow are support
Let's see where it goes
*Just m views not an investment advice*

Dixon TechDixon Tech
CMP - 4380 good support
Can enter at current levels 4380
1st Target - 4480
2nd Target - 4717
Positive: Above 50 MA
RSI - 59 Good
Daily MACD - uptrend
Alert: if it drops then we might see a fall till 3964
My suggestion - Enter at CMP or buy on dips

Dixon moving after a gapupStrong uptrend from the channel support and the POC.
Moving above the cloud now.
It opened gapup on the 23rd and continued without the gap being filled.
SL just below the gap 4148


DIXON60MINDIXON 60MIN is correcting a little bit and now reversing. It is showing a head and shoulders pattern the bottom pink box is the support and the upper pink box the resistance, also red lines are the resistance can buy after the candle closes in 15MIn timeframe above the upper pink box.


Buy Dixon Target 🎯 4586Buy Dixon Target 🎯 4586 because it's on support and target is its resistance.
