Dow Jones, interpretation of where we areDespite the fact that i calculated the dates, this is just my calculation and correction could easily end in 2033rd, but for now we are monitoring the index and in the future it will be clearer to us where we are, and idea can be updated.
According to my interpretation, the bull market ended in 2021 and now we are in a rising sideways leg, which should end at the beginning or end of summer 2024.
I have two prefered calculation's of target for rising sideway's leg(wave, local rally):
1)39150$ +-500$
2)39950$
Then we go to 1st area(white lines) and bear market within flat should last about 1 year.
Next rally(leg) in the context of the expected flat correction should end around 36000$ in Spring of 2027.
And i hope that all the correction will be finished in March of 2028(Prefered, because it should be fast destroy like tsunami) or December 2029, at the 2nd area(red lines), so we won't be too old by then.)
DJI

US30The Dow Jones Industrial Average Index (US30) on a 1-day timeframe.
Key Elements in the Chart:
1. Entry Zone (40,070 - 39,880):
The recommended entry range for a long position is between 40,070 and 39,880.
2. Target Levels:
Target 1: 40,636.77
Target 2: 41,295.33
Target 3: 42,750.00
3. Stop Loss:
The stop loss level is set at 39,825.
4. Support and Resistance:
Support Zone: Marked in green below the entry range.
Resistance Levels:
First Resistance: 40,636.77
Second Resistance: 41,295.33
Final Cycle Target: 42,750.00
5. Current Price:
The current price at the time of the chart is 40,604.42, which is below the first resistance level but above the entry zone.
Analysis:
1. Entry Strategy:
The recommended entry zone for a long position is between 40,070 and 39,880. Entering within this range allows you to capitalize on a potential upward movement towards the target levels.
2. Target Levels:
The first target level of 40,636.77 is relatively close to the current price, suggesting a short-term target.
The second target of 41,295.33 and the final cycle target of 42,750.00 indicate higher resistance levels and potential profit points for medium to long-term trades.
3. Stop Loss:
A stop loss at 39,825 ensures a predefined risk, protecting the trader from significant downside moves if the market goes against the position.
4. Support and Resistance Analysis:
The support zone indicates a strong buying interest, which can serve as a cushion against falling prices.
Breaking above the resistance levels will be crucial for the continuation of the upward trend.
Trading Plan:
1. Enter Long Position: Within the entry zone (40,070 - 39,880).
2. Set Stop Loss: At 39,825 to manage risk.
3. Monitor Resistance Levels: Watch for price action around 40,636.77 and 41,295.33.
4. Take Profit:
Partial profit at the first target (40,636.77).
Further profit at the second target (41,295.33).
Final profit around the final cycle target (42,750.00).

DJI - Dow JomesPair : DJI - Dow Jones
Description :
Completed " 12345 " Impulsive Waves
Break of Structure
RSI - Divergence
Bullish Channel as an Corrective Pattern in Short Time Frame
Resistance Level

Dow Jones surges to record highs on Fed easing expectationsThe Dow Jones Industrial Average (DJIA) ascended to record highs on July 16th, 2024, fueled by mounting expectations of a Federal Reserve policy shift towards a more accommodative stance.
Fundamental Drivers:
Federal Reserve Policy: The CME FedWatch Tool currently suggests a near-certain likelihood of at least a 25-basis point interest rate cut by September, with the upcoming July FOMC meeting potentially maintaining current rates. This anticipated monetary easing is bolstering investor confidence, particularly in sectors sensitive to interest rate fluctuations, such as industrials and small-caps.
Economic Data: Recent economic data releases, including stable retail sales figures, point towards a potential "soft landing" for the U.S. economy. This reinforces optimism and supports the ongoing market rally.
Sector Rotation: Investors appear to be strategically shifting away from large-cap technology stocks, which have thrived in a low-interest-rate environment, and allocating capital towards sectors anticipated to outperform under rising interest rates.
Confirmation: The significant rise in UnitedHealth Group Inc. (UNH) on July 16th (up 6.11%) exemplifies the strength in non-technology sectors.
Looking Forward: The Dow Jones' momentum remains robust, and further upward potential exists if upcoming economic data continues to align with the Fed's potential easing narrative. Investors will be keenly focused on forthcoming economic releases and the July FOMC meeting for any insights regarding the timing and magnitude of potential rate cuts.

SPX & NDX to SHORT TVC:DJI NASDAQ:QQQ AMEX:IWM NASDAQ:NDX SP:SPX
Rising wedge pattern forming in S&P 500.....big banks price target forecast for fiscal year 2024 were $4800-$5600 ....eventually hitting all PT mid 2024......S&P500 fell last week and DJI rose last week with 4% percentage difference which means investors or big money booking profits from tech and large weighted stocks in S&P 500 and investing in small caps and value stocks because of low inflation and hoping rate cuts soon.
NASDAQ100 just witnessed bearish engulfing candle on thursday 11th july 2024....engulfing previous 4 days candles.
Read:https://www.tradingview.com/news/benzinga:1590409c1094b:0-ai-super-bulls-pay-attention-to-the-biggest-divergence-since-2001-tsla-call-buyers-crushed/

Hellena | DJI (4H): Short to 50% Fibo lvl 39,059.Dear Colleagues, in general I see that the price will still rush upwards, because now the wave "3" of higher order is developing.
But I believe that now there will be a correction to the area of 50% Fibonacci level (39,059) in wave "2".
But before this correction, I believe that the price will complete a 5-wave movement in lower waves.
Manage your capital correctly and competently! Only enter trades based on reliable patterns!


DOW JONES All patterns pointing to a bullish break-out.We have seen today's pattern on one of our previous analyses (June 14, see chart below) but on the 1W time-frame:
Today we make some slight modifications as we view it on the short-term 1D time-frame. Dow Jones (DJI) continues to replicate the sequence of February 14 2023 - May 30 2023 and following the latest 1D MA50/100 Bullish Cross, is ready to break above the (bold dashed) Ascending Triangle.
As you can see there is so far high symmetry between the two patterns. The 2023 one made a Higher High following the Triangle break-out on the 1.382 Fibonacci extension from the bottom. It had two identical Bullish Legs since that Low.
As a result, we are targeting at least 41000 on the medium-term, which is tightly located within the 1.382 Fib and a symmetrical +7.50% Bullish Leg.
-------------------------------------------------------------------------------
** Please LIKE 👍, FOLLOW ✅, SHARE 🙌 and COMMENT ✍ if you enjoy this idea! Also share your ideas and charts in the comments section below! This is best way to keep it relevant, support us, keep the content here free and allow the idea to reach as many people as possible. **
-------------------------------------------------------------------------------
💸💸💸💸💸💸
👇 👇 👇 👇 👇 👇

DOW JONES is on an expansion phase until late 2025.Dow Jones (DJI) closed the 2nd straight green month (1M candle), something that isn't discussed a lot amidst the pessimistic views lately across the market. Technically, since the bounce on the 1M MA50 (blue trend-line), the index entered a new Expansion Leg inside the Channel Up that started after the 2008 Housing Crisis.
Each Bullish Leg has been so far more aggressive than the previous but even if Dow repeats the 'weakest' one, we will still look for a +75.32% rise since the September 2022 bottom. This translates into a long-term Target of 50000, which can extend as long as late 2025.
-------------------------------------------------------------------------------
** Please LIKE 👍, FOLLOW ✅, SHARE 🙌 and COMMENT ✍ if you enjoy this idea! Also share your ideas and charts in the comments section below! This is best way to keep it relevant, support us, keep the content here free and allow the idea to reach as many people as possible. **
-------------------------------------------------------------------------------
💸💸💸💸💸💸
👇 👇 👇 👇 👇 👇

DJO, Dow Jones in a Triangle - Bullish Continuation expectedHey Guys,
Yearly Chart is very Bullish - Broke above ATH and retesting it with this Q2 Candle.
However the Monthly Chart Doji indicates a Balanced Market ahead into the start of Q3.
A break above the highs would indicate a bullish progression - the Triangle could provide fuel for quite a large move - either up or down. Likely to be a move to the upside - given the higher TF Analysis.
37.800 and 42.000 are the Key Levels for the coming Quarter.
Will we see another Quarter of Gains? Or a little pause Pre-Election with some Profittaking under way as well as a ABC Correction towards 35.500?
Thanks for reading…

Hellena | DJI (4H): Short to the support area 37616.32.Dear colleagues, having reviewed the waves I assume that now the price is in a big correction and I expect that the price will continue downward movement to the support area 37616.32 (completion of the wave “C”). Before that a small correction to the resistance area 38978.81 is possible.
Manage your capital correctly and competently! Only enter trades based on reliable patterns!

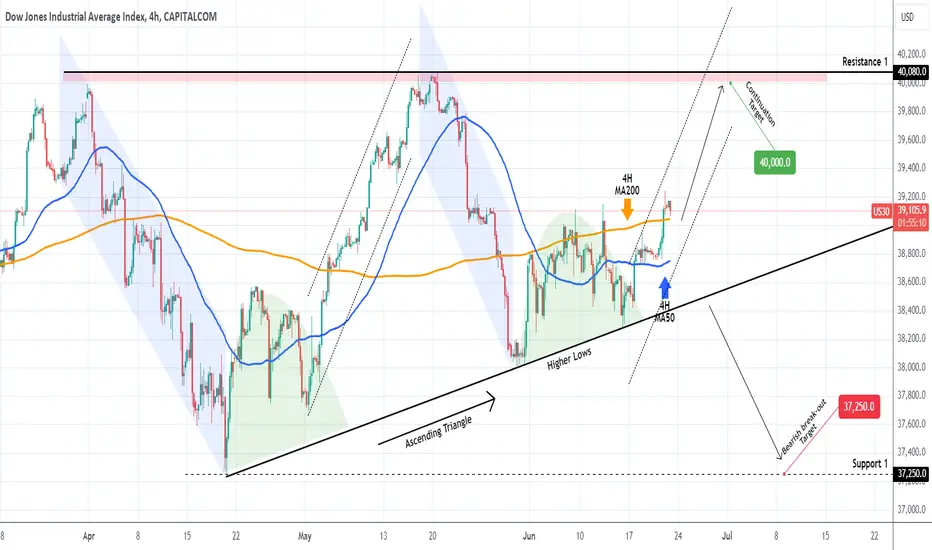
DOW JONES Ascending Triangle on its Bullish Leg.The Dow Jones Industrial Average Index (DJI) broke above the 4H MA200 (orange trend-line) again for the first time in a week, while holding the 4H MA50 (blue trend-line) as Support. The dominant pattern is an Ascending Triangle and the price action appears to be repeating the previous Leg.
As you can see, following the bottom formation and accumulation (green Arc) on the Higher Lows trend-line, which followed the Bearish Leg in the form of a Channel Down, the previous Bullish Leg (dotted Channel Up) posted a strong rally, the 2nd phase of the structure, towards the Ascending Triangle's top at 40080 (Resistance 1) when it broke above the 4H MA200.
As a result, we are bullish as long as the Asc. Triangle holds, targeting 40000 (just under Resistance 1, bottom of the red Zone). If however the price breaks below the Asc. Triangle (Higher Lows), we will take the loss on the buy and open a sell instead, targeting 37250 (Support 1).
-------------------------------------------------------------------------------
** Please LIKE 👍, FOLLOW ✅, SHARE 🙌 and COMMENT ✍ if you enjoy this idea! Also share your ideas and charts in the comments section below! This is best way to keep it relevant, support us, keep the content here free and allow the idea to reach as many people as possible. **
-------------------------------------------------------------------------------
💸💸💸💸💸💸
👇 👇 👇 👇 👇 👇
Dow Jones US30 - Lets attack ATH again!Hi Again,
Today I am sharing opportunity for long positions just before much anticipated FOMC meeting tonight.
Call it a risky trade, but if longing US30 now is risky, what the hell are currencies, gold and especially, NASDAQ and SPX doing ??
The plan is to attack 39700 area and break ATH. Who said 40000 Dow Jones is the limit?
Stop loss up to you. Safe stop loss is in 38400 area and lower due to nature of this structure they built.
Long now and lets talk tomorrow :)
Good luck and play safe!

DOW JONES Bottom next week. 42k long-term Target.Dow Jones (DJI) is about to close a red 1W candle, staying flat basically for the 3rd week in a row. May's Double Top on Resistance 1 (40075) technically calls for an approach attempt on Support 1 (37250) but that doesn't invalidate the long-term bullish technicals as the pattern is a 1.5 year Channel Up.
As a result, with the 1W MA50 (blue trend-line) supporting since the week of October 30 2023, closing in towards Support 1, we expect a bottom to be formed next week when the 1W RSI makes a Lower Low. As you can see, the last 3 long-term buy opportunities have been when a 1W RSI Channel Down (blue) made a Lower Low.
Our long-term Target for Q4 is 42000 (just above the 0.786 Fibonacci Channel level).
-------------------------------------------------------------------------------
** Please LIKE 👍, FOLLOW ✅, SHARE 🙌 and COMMENT ✍ if you enjoy this idea! Also share your ideas and charts in the comments section below! This is best way to keep it relevant, support us, keep the content here free and allow the idea to reach as many people as possible. **
-------------------------------------------------------------------------------
💸💸💸💸💸💸
👇 👇 👇 👇 👇 👇

Dow 'Big Yikes' moment as it gravely lags behind BigTech rallyA stock-market rally concentrated on an ever-narrowing cohort of tech stocks is leaving the Dow Jones Industrial Average behind as the Nasdaq Composite (IXIC), Nasdaq-100 hit records, making investors nervous.
The scope of the divergence on Wednesday, with the Nasdaq-100 finishing posting a 1.33% gain versus a 0.09% fall for the Dow DJIA was particularly troubling.
This is quite rare moment as the Dow posted a daily close more than 1.0 percentage points below Nasdaq-100 Index and more than 0.9% below S&P500 Index.
That is a 'Big Yikes' moment.
It's largely a statement on very bad breadth of the market, as we're incredibly reliant on just a very small number of names.
The rally more recently, he noted, has been driven largely by longtime AI favorite Nvidia Corp. (NVDA), and Apple Inc. (AAPL), which has surged nearly 9% this week as it outlined its own plans to add AI to its products.
The Super concentration is manifested in any number of breadth statistics, which track how many stocks in an index are participating in a move, including the percentage of stocks at 52-week highs versus 52-week lows and the percentage above their 200-day moving average.
For example, just one component of SP500 Index - that is Nvidia.. had accounted for 35% of the increase in the S&P 500's market cap in 2024.
Such a high concentration implies that if NVIDIA continues to rise, then things are fine and dandy.
But if it starts to decline, then the market will be hit hard.
Overall, presidential-election years tend to be strong ones for the market, particularly in the fourth quarter. And years that begin strong also tend to hold up.
But everything could end, earlier or later.
The main chart is the ratio between Nasdaq-100 (NDX) and Dow Jones (DJI) Indices. That indicates that June quarter posting an extremely new historical high between these two Major indices, first time over the past 25 years.
A very historical times we live.

Trade Like A Sniper - Episode 20 - DJI - (6th June 2024)This video is part of a video series where I backtest a specific asset using the TradingView Replay function, and perform a top-down analysis using ICT's Concepts in order to frame ONE high-probability setup. I choose a random point of time to replay, and begin to work my way down the timeframes. Trading like a sniper is not about entries with no drawdown. It is about careful planning, discipline, and taking your shot at the right time in the best of conditions.
A couple of things to note:
- I cannot see news events.
- I cannot change timeframes without affecting my bias due to higher-timeframe candles revealing its entire range.
- I cannot go to a very low timeframe due to the limit in amount of replayed candlesticks
In this session I will be analyzing the Dow Jones Industrial Average Index (DJI), starting from the 6-Month chart.

Hellena | DJI (4H): Short to the support area 37616.32.Dear colleagues, having reviewed the waves I assume that now the price is in a big correction and I expect that the price will continue downward movement to the support area 37616.32 (completion of the wave “C”). Before that a small correction to the resistance area 38978.81 is possible.
Manage your capital correctly and competently! Only enter trades based on reliable patterns!

US30. Weekly trading levels 27 - 31.05.2024
During the week you can trade from these price levels. Finding the entry point into a transaction and its support is up to you, depending on your trading style and the development of the situation. Zones show preferred price ranges WHERE to look for an entry point into a trade.
If you expect any medium-term price movements, then most likely they will start from one of the zones.
Levels are valid for a week, the date is in the title. Next week I will adjust the levels based on new data and publish a new post.
! Please note that brokers have a difference in quotes, take this into account when trading.
The history of level development can be seen in my previous posts. They cannot be edited or deleted. Everything is fair. :)
----------------------------------------------
I don’t play guess the direction (that’s why there are no directional arrows), but zones (levels) are used for trading. We wait for the zone to approach, watch the reaction, and enter the trade.
Levels are drawn based on volumes and data from the CME. They are used as areas of interest for trading. Traded as classic support/resistance levels. We see the reaction to the rebound, we trade the rebound. We see a breakout and continue to trade on a rollback to the level. The worst option is if we revolve around the zone in a flat.
Do not reverse the market at every level; if there is a trend movement, consider it as an opportunity to continue the movement. Until the price has drawn a reversal pattern.
Don't forget to like Rocket and Subscribe!!! Feedback is very important to me!

[Early Warning] Dow Jones showing weakness, will dip furtherTVC:DJI has formed 5 waves down in daily timeframe. Unless this 5 wave structure turn into a 7 or 11 wave (counter-trend) formation, this is likely a beginning of short term down-trend.
Now, this down trend could play out in different ways, 2 of the most likely options are highlighted in the chart. This 5 wave decline could be a larger ABC (or WXY/WXYXZ) which is highlighted in red color. Or worse, this could be beginning on a larger trend down and this is just minor wave i of larger 1. This is highlighted in blue color.
Both of these alternatives are bearish in nature. We can expect a bounce which might go around 61.8% (~39,500) though it doesn't need to be that much.
Just remember that for this scenario to play out, this 5 wave structure shouldn't change into a 7 or 11 wave structure as mentioned above.

$DJI warnings signs but not all is darkGood Morning!!!
Let's dissect a few things.
The DJ:DJI is showing warning signs on the Weekly Chart:
Money has been leaving.
Harder to see on a daily so showing on weekly.
RSI is also weak.
Daily
The DOW is trading under shorter term moving avgs.
The RSI is at an important juncture, 50.
$ flow almost under 0.
-----------------------
There are some positives to the DJ:DJI :
There is an Inverse head & shoulder pattern. Although this pattern is better @ calling lows. Of course, if it holds the 38.5k Support Level.
37.5k & 37k would be the next support areas before the retest of the MAJOR SUPPORT level, which is the old all time highs.
Sell in May go away?
Still bullish but weak spot for the average.

New all time highs in MaySPX is heading to new all time high by May 21. Invalidated if breaks below Apr 19 low.

Stock Market Outlook For 2nd Half of 2022 & 2023we could see another rebound in 2nd half of this year due to easing inflation rate.
july is uncertain.

