OUTSIDE DAY for ALL major averagesWhat a turnaround for ALL the MAJOR averages!
As we've been saying over and over again.......
The END OF DAY IS WHAT MATTERS!!!
*Indices formed an OUTSIDE DAY*
Outside days can signify 2 things:
CONTINUATION
OR
REVERSAL (of the current trend)
Being that the day ended lower, LIGHT VOLUME though, we will take this as a WARNING!!!!!!!
RSI fell pretty hard, #stocks could just experience profit taking for a bit.
__________________________________________
TVC:VIX roaring & seems 2b stronger this time around.
TVC:DXY close to support and seems to be trying to base again.
2 Yr #yield showing positive divergence.
10Yr oversold - don't see anything out the norm in either one of these, yet at least.
DJI

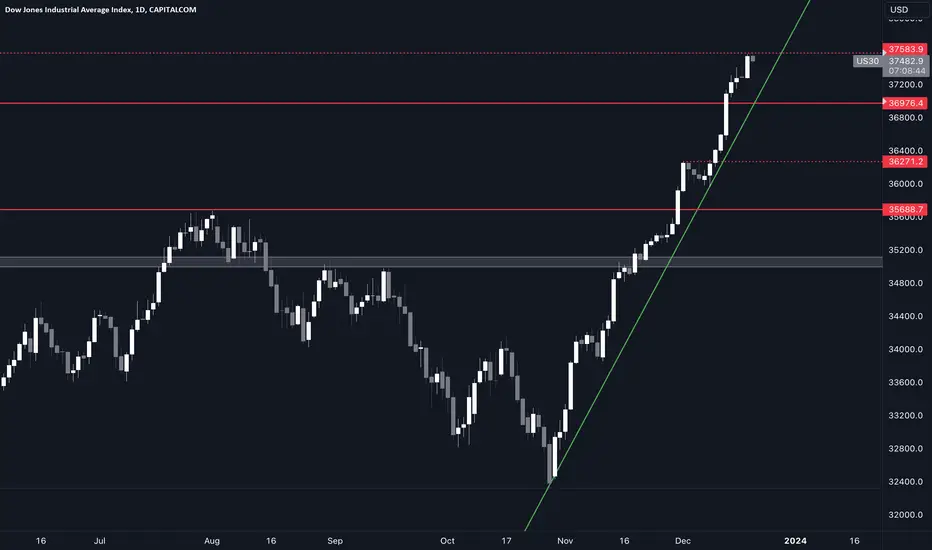
DOW JONES Correction expected due to insanely overbought RSI.Dow Jones (DJI) easily hit last week's (December 12) target (37000) at the top of the 2-month Channel Up (see chart below) with the price grinding ever since on its top:
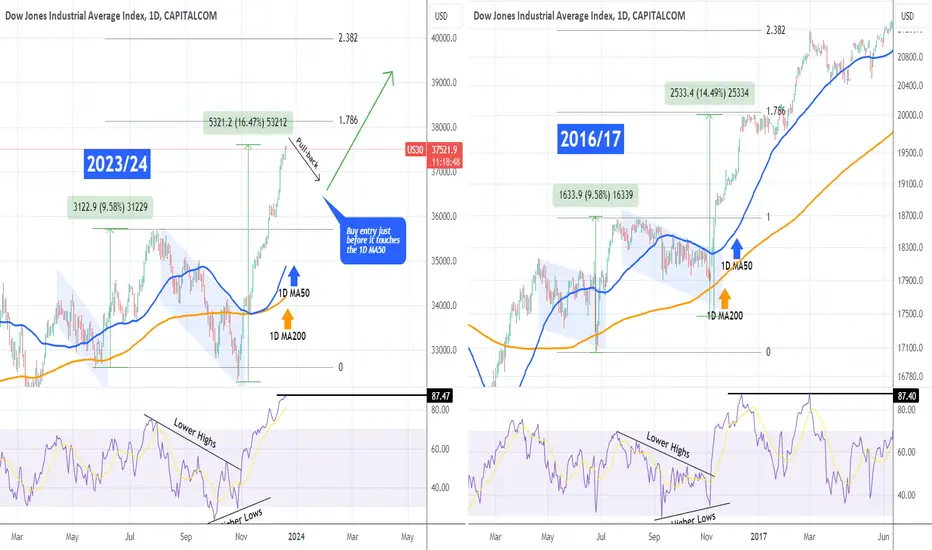
That was a short-term signal, today we shift our attention to the medium-term and the 1D time-frame where the 1D RSI is 'insanely' overbought near 87.50, a level it hasn't touched since January 2018. In fact if we look a little longer, we can see a perfectly fitting sequence with today's price action in late 2016. The 1D RSI got hugely overbought at 87.40 on December 13 2016 and pulled-back to the 1D MA50 (blue trend-line) before resuming the uptrend.
This overbought 1D RSI peak was made after two straight Channel Downs leading to approximately +9.58% and +14.50% rises, which is quite similar to what's been happening since April. This tells us not to engage in any buying any more, even though due to being on the end of year euphoria and post Fed rate cut anticipation, it can rise some more. But the risk is higher now than buying near the 1D MA50 again.
-------------------------------------------------------------------------------
** Please LIKE 👍, FOLLOW ✅, SHARE 🙌 and COMMENT ✍ if you enjoy this idea! Also share your ideas and charts in the comments section below! This is best way to keep it relevant, support us, keep the content here free and allow the idea to reach as many people as possible. **
-------------------------------------------------------------------------------
💸💸💸💸💸💸
👇 👇 👇 👇 👇 👇
$RSP & $RUT performing better at the moment, vs $SPXAMEX:RSP vs AMEX:SPY
Equal weight vs regular #SP500
We can see that equal weight has been performing better
Russell 2000
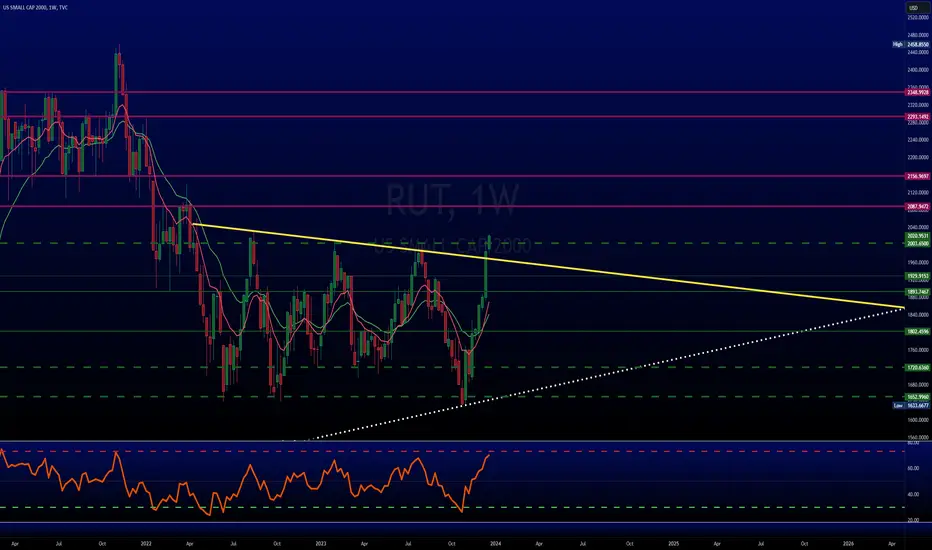
TVC:RUT is no longer stuck in a rut :)
It had a fake breakout in the daily charts in August but look at it now.
That weekly is looking Nicely!
We've stated a few times that we believed these 2 would be moving better than normal averages.
We also said TVC:DJI would keep leading, it has. Another new All time high.
Another call, NASDAQ:NDX should surpass, it's more aggressive.
DOW JONES Channel Up still intact.Dow Jones reached the top of the Channel Up that started in late October and turned sideways.
The longer this pattern stays intact, the more every pull back is a buy opportunity.
The MA50 (4h) is supporting since November 1st, showing the sheer strength of this bullish trend.
Trading Plan:
1. Buy on the current market price.
2. Sell below the MA50 (4h).
Targets:
1. 37800 (under the 1.382 Fibonacci extension which was the target top of the mid November consolidation).
2. 35600 (projected contact with the MA200 4h).
Tips:
1. The RSI (4h) sequences among the two bullish legs are identical, confirming the bullish sentiment towards the 1.382 Fibonacci.
Please like, follow and comment!!
Notes:
Past trading plan:

DJI Dow Jones Index: Either this or thatWell, what do we got?
From EW perspective considering either
1) Leading diagonal since the top and doing some crippled ABC up
2) ABC (3-3-5) down and now having first impulse completed with and expanded fat
32.3 or 35.6 will tell the story
---
If you like my content, if it helps you gain profit, give it a like!
Thanks!
---
Hold my beer pls
----
No financial advice, do your own research, don't be stupid

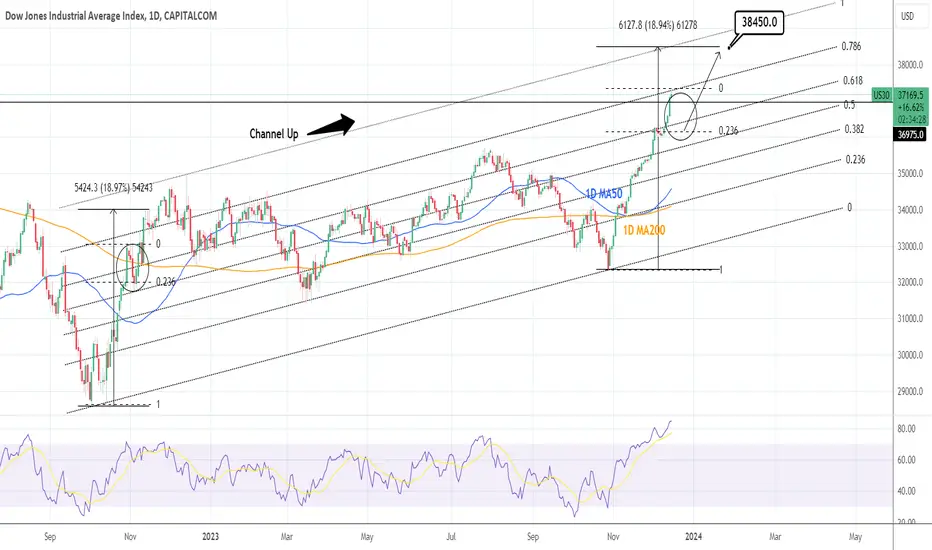
DOW JONES: Correction imminent. Buy at the right time.Dow Jones made new All Time High yesterday and today reached the 0.786 Fibonacci Channel level of the 14 month Channel Up pattern. Needless to say it is massively overbought on the 1D timeframe (RSI = 79.702, MACD = 696.100, ADX = 90.584). The sheer strenght of this rise since the October 27th bottom can only be compared to the first rise of the Channel in October-November 2022.
After almost reaching the 0.786 Channel Fibonacci level, it pulled back to the 0.236 horizontal Fibonacci and then moved to a +19% rise before a consolidation that made the Channel's blow off top. Consequently, we cease our buying at the moment and will wait for that short term correction to the 0.236 Fibonacci (36,160). This will be our next buy entry to target the +19% extension (TP = 38,450).
## If you like our free content follow our profile to get more daily ideas. ##
## Comments and likes are greatly appreciated. ##

Paper #Securities vs #Digital #Property custodial paper vs bearer asset
quantitative easing vs austrian economics
DTCC vs #Blockchain
Wall St vs Main st
Corporations vs Fat protocol
20th century vs 21st century
Interesting double bottom / W forming
But it gives us a powerful clue for the coming year or two

GENERAL MARKET INDICES REACT POSITIVLY TO FOMCFOMC DAY
All Major Market Indices initially making progress higher and reacting positively to the the FOMC meeting. Whilst these are monthly charts I'm sharing the prices are updated as of moments ago.
Main comments from Powell Today:
🔸TODAY AT FED MEETING MANY PEOPLE MENTIONED THEIR RATE FORECASTS
🔸THERE WAS A GENERAL EXPECTATION THAT RATE CUTS WILL BE A TOPIC OF CONVERSATION GOING FORWARD
🔸LITTLE BASIS FOR THINKING ECONOMY IN RECESSION NOW
🔸ALWAYS A PROBABILITY THERE IS A RECESSION IN NEXT YEAR
The Charts
What originally looked like a series of double tops now appear to be showing significant strength. The top 3 charts have a habit of letting us know where the market is going. At present that appears to be higher albeit the Dow Transportation Index is still lagging a little (Chart 1) and technically one would think this would be leading all others.
We should still be on watch for a throw over double top, but for now we have nothing to suggest this is the case.
If these markets can make support on the red line this could be good solid confirmation signal of price moving higher for longer 😉
Stay Nimble and congrats if your in the green
PUKA
PUKA

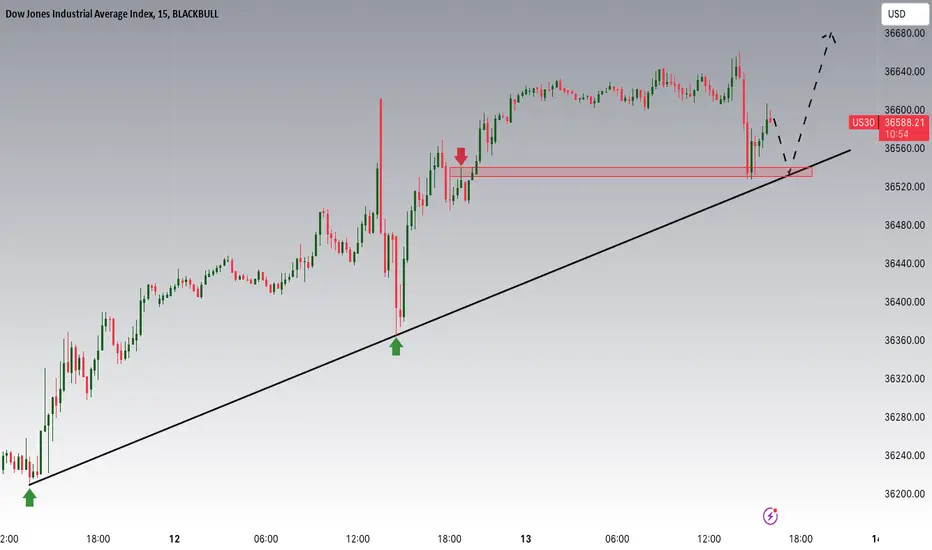
US30 Potential UpsidesHey Traders, in today's trading session we are monitoring US30 for a buying opportunity around 36500 zone, US30 is trading in an uptrend and currently is in a correction phase in which it is approaching the trend at 36500 support and resistance area.
Trade safe, Joe.
DOW JONES Does this rally still surprise you?Two months ago (October 11) we made a bold statement calling for "the start of a new Bull rally under our nose" on Dow Jones (DJI) (see chart below):
Many traders/ investors/ market participants have been surprised by the current November - December rally but in reality they shouldn't as the index is methodically repeating the 2016 - 2017 Rising Wedge pattern, as we've shown on that analysis. We are now at the level where the price is breaking above that pattern (blue circle), which comes after the 1W RSI makes a fake-out break breach below the Higher Lows and then rebounds.
On the current analysis we expand the chart more, in order to show you that the very same Rising Wedge also emerged from May 2011 to December 2012. We are therefore on a +10 year cyclical pattern which the all three Wedges not only displaying identical break-outs/ fake-outs but also similar duration.
The 2011/12 pattern peaked on the 2.618 Fibonacci extension, the 2015/16 a little higher on the 3.0 Fib ext. We can assume that this progression could give a new top on a higher Fib, but if we take the worst case scenario of the model (2.618 Fib), we can expect a High around 42900.
Check out also how the Sine Waves grasp fairly accurately the cyclical movement on those bottoms and peaks during these past +10 years. Another important observation is that after the index broke above the Rising Wedge in 2016, it didn't offer any significant dips to buy. Rare buy entry opportunities existed only on the middle trend-line (orange) of the Bollinger Bands. The 2013 break-out gave significantly more dips buy opportunities, 7 in total all marginally below the Bollinger middle, before the 2.618 Fibonacci peak.
-------------------------------------------------------------------------------
** Please LIKE 👍, FOLLOW ✅, SHARE 🙌 and COMMENT ✍ if you enjoy this idea! Also share your ideas and charts in the comments section below! This is best way to keep it relevant, support us, keep the content here free and allow the idea to reach as many people as possible. **
-------------------------------------------------------------------------------
💸💸💸💸💸💸
👇 👇 👇 👇 👇 👇

DOW JONES Channel Up still holding, aiming at All Time Highs.Dow Jones (DJI) maintains its bullish trade within the Channel Up pattern that started on the October 27 Low. The 4H MA50 (blue trend-line) has been supporting since November 01 and as long as it continues to do so, the index is more likely to test the 36975 All Time High (Jan 05 2022). Especially since it is currently on a 4H MACD Bullish Cross.
The previous two MACD Bullish Crosses have delivered rises of around +2.70% to the top of the Channel Up. Another +2.70% rise will send the price above 37000 and that is our target. If however the index closes below the 4H MA50, we will take the long's loss and reverse to a short immediately, targeting the bottom of the Channel Up. If the price closes below it, we will re-sell and target Support 1 at 35300, where potentially contact with the 4H MA200 (orange trend-line) can be made for the first time since November 02.
-------------------------------------------------------------------------------
** Please LIKE 👍, FOLLOW ✅, SHARE 🙌 and COMMENT ✍ if you enjoy this idea! Also share your ideas and charts in the comments section below! This is best way to keep it relevant, support us, keep the content here free and allow the idea to reach as many people as possible. **
-------------------------------------------------------------------------------
💸💸💸💸💸💸
👇 👇 👇 👇 👇 👇

US30 Daily Projection In daily time frame price going retest the major support area . If price reject this zone and close above then buying favorable.

BTC Week Update: Full Update 12/10/23Bearish on short term. I explain it in the video. Too lazy to type it.

US Economy Has Entered A Potential Parabolic Phase End
I think this is the most important macro trend to pay attention to in our economic history, I see many 1930 comparisons with 2023 saying we are at the "1931" collapse point but all economic data is pointing that we are most likely at the 1927-1928 stage and crazy enough when you compare the macro trends they make the same giant symmetrical wedge pattern.
Now I'm going to share some archives of The New York Times from the same period to see where the mentality is.
--------
November 17, 1927
"98 and interest, to yield about 5.75%"
"temporary bonds"
--------
October 30, 1928
"London Paper Predicts Crash on Change There It Speculation Goes On.
LONDON, Oct. 29.—Speculative activity on the London Stock Exchange which sent prices of certain shares of doubtful value bounding upward, led the Daily Express to issue a solemn warning that a crash was certain to come unless the stock-gambling mania ceased."
--------
November 3, 1929
"SEES WALL ST. REACTION.
Stock Decline Will Aid Real Estate, Says Mandelbaum."
--------
November 25, 1929
"ASKS STATE INQUIRY ON STOCK RECESSION
Senator Hastings Wants the Governor to Name Committee of Business Leaders. MENTIONS SHORT SELLING But Finds Law Passed to Prevent It Failed of its Purpose and Was Repealed in 1857. Sees Short Selling a Factor Doubt As to Remedy."
--------
Here we are again different stages, different cycles.
But the main difference is our system bailed out our crashes since 2001 starting with interest rate cuts, we can clearly see the ups and downs are more violent when the FRED intervenes in the market.
Do I suspect we get a giant crash in a few years? unlikely the FRED will not debase / change the rules but stopping a new parabolic run up is much harder to stop.
They printed too much currency in 2020 now that inflation is halted via the fastest rate cycle in history where is all this capital going to flow into? correct equities and crypto.
Best to remember the 1929 quote of the thought of "Banning Short Selling" my guess is IF this starts to turn into a parabolic secular cycle ending the FRED will start to control the markets and limit ability to sell / short sell or QE / YCC the market during the final stage.
We will know if this is repeating if the wedge breaks out from now to early 2024.

DOW JONES Next stop 37000Dow Jones held the MA50 (4h) today after the initial NFP decline.
This keeps the Channel Up intact on its upper layers, aiming for a new Higher High.
Trading Plan:
1. Buy as long as the MA50 (4h) holds.
2. Sell if it breaks.
Targets:
1. 37000 (Fibonacci 1.78 extension, like the Nov 15th Higher High).
2. 35700 (bottom of Channel Up).
Tips:
1. The RSI (4h) rebounded exactly on the level (Support 1) the Nov 9th did. The two legs are so far very symmetrical and promt to the extension of the Channel Up.
Please like, follow and comment!!
Notes:
Past trading plan:

$SPX at IMPORTANT area! DJ:DJI is fighting to stay above, hang around resistance.
NASDAQ:NDX came back & fighting to chug higher as well.
VERY IMPORTANT AREA for $SPX!!!!!!!
Strength has subsided but it's not down yet.
Could AMEX:SPY retest the highs?
TVC:VIX is holding but doesn't look fully awake. Hmmm...
#stocks AMEX:DIA NASDAQ:QQQ AMEX:SPY

Profitable InflationEvery chart describes a story.
Inflation can be tracked using producer-prices and consumer-prices.
Equities are affected by consumer inflation, while commodities by producer inflation.
Many of the worlds largest companies are selling services, not commodities.
The ratio of the two on the chart above, shows that long-term production cost of commodities is gradually reducing. It also shows periods when production inflation is much more pronounced than consumer one. There is an inherent lag between producers and consumers.
First producers take a short the beating...
...then consumers feel the pain. An eye for an eye.
Investors have limited options. There is energy to invest in, commodities, crypto, bonds, equities and money markets. There are probably many more options, but these are some of the most well-known ones. The method to invest in them may be via a mutual fund or a direct investment.
Let's rate these investment options for their viability.
Gold has proven problematic time and time again.
How high can Gold even get for demand to sustain? With production cost increasing, an investment in Gold becomes a dilemma. Approximate Gold profits, described by the Gold/PPIACO ratio, seems like a hard win.
Crude Oil on the other hand may need some time before it shows its true strength.
On the Crypto world, the big boy Bitcoin may dominate.
Crypto also seems to progress against Bonds.
Bitcoin has survived excellently the rate-hike schedule, keeping it afloat against Bonds.
Similarly in the Equity world, the big guys may overperform.
The Industrial part of DOW seems like it will show strength against the others.
For an investor, few are the viable choices.
Bonds don't go well with increasing rates.
Gold fails proving as an inflation hedge.
Instead, crypto shapes into an equity pillow.
Source: @SpyMasterTrades
When equities underperform, Bitcoin stays put.
Once again, we have reached the same conclusion. The equity market is forced to grow.
This chart is a perspective on how (SPX vs Inflation = actual profits) may overperform (Gold vs Commodity Production Cost = actual profits). This shows that equity-profits-after-inflation may be more than any other type of investment. Equities may in fact completely ignore inflation for some years to come.
Many of my charts, like this one, have taken me back to 1994, in the pre-.com bubble world. A massive equity bubble may be brewing as we speak.
Nothing else besides equities is viable as an option now.
Except perhaps money markets. The massive forgotten one. Dollar.
Money strength has been low for too long. Perhaps the dollar hasn't spoken its last word.
This proves once again that crypto may remain strong. Crypto is currency after all.
Tread lightly, for this is hallowed ground.
-Father Grigori

DJI Dow JonesIn the continuation of the previous analysis scenario, we see the completion of the waves of the diagonal ending pattern. After completing this corrective pattern, I expect the price to drop.

Dow Jones ETF (DIA) ~ December 4H SwingAMEX:DIA chart anaylsis/mapping.
DIA ETF on relative strength compared to recent SPY/QQQ performance, indicating potential market rotation.
Trading scenarios:
Continuation rally #1 = top range of Fib.
Shallow pullback #1 = ascending trend-line (white) / ascending trend-line (green dashed) / gap fill confluence zone.
Shallow pullback #2 = gap fills / descending trend-line (light blue) / 78.6% Fib confluence zone.
Deeper pullback #1 = Golden Pocket Fib / 200MA confluence zone.
Capitulation #1 = 50% Fib / ascending trend-line (light blue).
Capitulation #2 = gap fills / 38.2% Fib confluence zone.
Capitulation #3 = gap fills / 23.6% Fib confluence zone.

$DJI leading stocks BUT at a major resistance level atmOn the flip side...
DJ:DJI is pumping today & leading.
The industrial is at a major resistance level & pushing through, for the moment at least.
AMEX:DIA hasn't been able to trade above this area for almost 2 years!
How will it handle it this time?
Weekly RSI hasn't been much higher than current level since mid 2021.
#stocks AMEX:UDOW AMEX:SDOW

A small push up before the fall?It looks like the DOW is getting ready to fall within the next few days ...let's see
