Bear rallies the most furious, could be in one!Bear rallies tend to be the MOST FURIOUS!!!
Be careful but take ADVANTAGE!!!
SP:SPX upcoming resistance @ 3 areas:
4280
Moving avg is a little above that (weakest resistance imo).
MAJOR = 4330 (it closes above this will post further levels).
Keep an eye as the RSI closes in on 50.
#stocks DJ:DJI TVC:NDQ TVC:RUT TVC:VIX TVC:DXY TVC:TNX #GOLD #SILVER
DJI

$DXY trading alongside $TNX & both divergent to Stocks Post #2TVC:DXY on left in all charts (only DJI shown here)
DJ:DJI & CBOE:SPX & TVC:TNX on right.
Short term we are badly due for some sort of relief rally, we nibbled in this area AMEX:UDOW AMEX:SPXL
Not sure how high this can go so we have been nibbling and will sell in tranches.
#stocks TVC:NDQ AMEX:DIA AMEX:SPY NASDAQ:QQQ

$DXY makes history (Update idea) Post #1Historically, the YELLOW support area NEVER holds when TVC:DXY is on its way back down.
HOWEVER, the US #Dollar is showing strength. (this is vs a basket of currencies that are also weak.) 1st time it bounced back this hard.
This looks like it wants to keep going, longer term. We'll see.
This is NOT good for #stocks (longer term).
TVC:TNX has been trading closely.


UPDATE: Dow hit target 1 - heading to target 2 at 32622The dow broke below the Symmetrical Triangle and it was beautiful text book style.
We set the first target at the bottom of the pattern at 33,607.
Now that the momentum is still negative, we can expect it to head to the next target at 32,622.
The signs are all bearish and this is one of those hold and adjust stop loss if need be.

Dow JonesDJI Chart
Checking some TA, which I should have done more thoroughly on SPY, I would have seen the obvious TA screaming we go higher.
Both the SPY and DJI technicals are stating we go higher. RSI, MACD, MFI, and 50MA are pointing to higher moves in the market. In fact, taking a look at the 10YR is another confirmation of where we're heading.

The Dow DilemmaWe are at a crossroads. As if we have nothing to invest in.
Gold is, in absolute terms, highly overpriced.
Gold is more than 50% above the 24 year average.
And highly diverging...
It still is the massive elephant in the room.
Yield rates are the small rat in the room.
Due to fast rate hikes, the bond market has suffered incalculable losses.
Gold (elephant), just like many people, are afraid of rats (and yield rates).
Current consensus is that yield rates are to grow forever, pushing dollar in all-time highs.
But consensus cannot take us far...
Dollar is showing signs of weakness.
The rate hike party may not last long...
And equities are still problematic.
With massive amounts of money printed in the last 3 years, surely the problems are yet to come.
In the main title I talked about a dilemma.
DJI divided by Money Supply is warning us.
But who is listening? Everyone seems to have disappeared.
I am walking around with a lantern in my hand, looking for people, just like Diogenes the Cynic did.
This is the micro view. Let's see at the macro view.
DJI is joking to us. Short-term it shows clear weakness signals.
Long-term it shows the most bullish of signals.
My opinion? I expect short-term problems in the equity market.
But the problems that may come could be smaller than anyone expects.
A relentless equity bubble may form, trapping investors who brace for a downwards impact.
In the end, things are not as simple as we may think...
And all we are left with is a dilemma.
Tread lightly, for this is hallowed ground.
-Father Grigori

Hellena | DJI (4H): Long to sresistance area 34067.Dear colleagues, I assume that wave 4 is coming to an end and the price is in the area of long positions. I believe that the price will reach the resistance area 34067. Perhaps the price will renew the minimum. Be careful.
Manage your capital correctly and competently! Only enter trades based on reliable patterns!

DOW JONES Bottom formation buy only on the short term.Dow Jones is priting a bottom on the newly emerged Channel Down which calls for a short term buy.
The same kind of formation was witnessed in middle March on the long term bottom pricing when the (recently broken) Channel Up started.
Trading Plan:
1. Buy on the current market price.
Targets:
1. 34400 (MA50 1d).
Tips:
1. The RSI (1d) is on the 30.00 oversold support. Same as on March 13th. An additional buy indicator.
Please like, follow and comment!!
Notes:
Past trading plan:
SPX | Don't fall for the trap...SPX is plowing through higher highs. It is a runaway train.
Have you entered that train yet? You better enter it because SPX will soar!
But runaway trains have the fate of collapsing in on themselves.
Their weight is too much for the foundation to sustain.
Not all is SPX. VIX is also attempting to measure the risk involved in SPX.
And VIX is as bullish as it gets.
But not all is VIX.
It is important to analyze the volatility of volatility. We are really entering inception levels here.
Volatility is too low and too stable . It is as if it is pressured to make all-time-lows. With such a low VVIX reading, we can conclude that VIX is having no second thought on dropping even further.
Curiously, the VVIX/VIX ratio is a neat SPX tracker.
I have posted about it ages ago.
So what can we conclude about volatility?
Historically, similar volatility traps have lead to severe crashes in the stock market.
Will this time be any different?
So what is in for the future?
Perhaps an all-time high for SPX will come first.
It is not that far...
Then, perhaps some SPX divergence against VVIX/VIX. SPX to move higher with VVIX/VIX moving lower. And then darkness.
Tread lightly, for this is hallowed ground.
-Father Grigori

DOW JONES Channel Down bottom buyDow Jones / US30 hit the bottom of the Channel Down that is correcting the index to the Rising Support of the larger Channel Up pattern.
It did cross under the 1day MA200 (bearish) but on the other hand the 1day RSI is rebounding on the Oversold Support (bullish) like on the March 13th low.
Keep a tight SL on the low of the bottom candle and buy. Target 34400 (1day MA50).
Previous chart:
Follow us, like the idea and leave a comment below!!

Make Exxon Great Again. As Here's A Hundred Fold OpportunityElectric vehicles are growing so fast that Exxon Mobil is preparing for a future when "customers don’t need that gasoline".
Exxon Mobil Corp., which operates one of the world’s biggest oil-refining networks, is trying to be more responsive to changing consumer demands as the energy transition gathers pace. The changes it’s considering include potentially replacing some gasoline production with chemicals.
The oil giant has long pursued a strategy of upgrading refineries to expand production and make higher-value products from crude oil such as lubricants and plastic feedstock. But it now sees those projects potentially helping the company to move away from traditional fuels, demand for which is likely to wane in coming decades.
The strategy, discussed in August 2023 by executives at a presentation to investors and media, shows how even Exxon, one of the leading proponents of fossil fuels, is being forced to reckon with a future in which electric vehicles significantly eat into gasoline consumption.
Exxon has already reduced production of fuel oil and high-sulfur petroleum at refineries in Singapore and the UK. Over time, it’s open to cutting output of gasoline, the focus of the company’s refining business since Henry Ford introduced the Model T nearly 100 years ago. The goal is to produce more chemicals, found in everything from paint to plastic, for which there are few low-carbon alternatives.
"We’re planning on modifying some of that yield from gasoline to distillate and chemicals feed," Jack Williams, Exxon senior vice president, said earlier this year at the company’s office in Spring, Texas. "We’ve got projects that we know we would do to take those steps."
Exxon gets most of its earnings from oil and natural gas production but refining has always been in its corporate DNA, right back to its original incarnation as part of John D. Rockefeller’s Standard Oil, which was established in the 19th century.
Refining allows Exxon to earn money right along the fossil fuel supply chain, from the wellhead to the gas tank. But with traditional fuels such as gasoline under threat from EVs, refineries worldwide are being forced to adapt quickly. Some European plants shut down during the pandemic, while others in the US switched to biodiesel.
Exxon wants to take a more nuanced approach by upgrading facilities to switch in and out of products depending on demand. To give an example, an Exxon refinery in Singapore used to produce fuel oil that sold for $10 per barrel below the price of Brent crude, but after a recent upgrade, the facility produces lubricant base stocks that sell for $50 above Brent.
Exxon has upgraded and added to its refineries at Fawley in the UK and Beaumont in Texas to produce more diesel, which is used for heavy-duty transportation and is less vulnerable to competition from electric vehicles.
"You just have more variables now due to the energy transition," said Jay Saunders, a natural resources fund managers at Jennison Associates, which has $186 billion under management. "Having a high-quality refining asset with flexibility will be very important."
Exxon’s refining and chemicals footprint is at least double that of its Big Oil competitors, potentially making it more vulnerable to a speedy energy transition, and especially the growth of electric vehicles. But executives believe the potential for reconfigurations is far greater than that of its peers, providing an opportunity to profit in a low-carbon future.
"This really allows us to pivot as demand evolves," said Karen McKee, President of Exxon’s Product Solutions division.
Biodiesel is particularly attractive to Exxon because reconfiguring its existing refineries costs about half as much as building a new plant, said Neil Hansen, senior vice president of product solutions. Demand for biodiesel, which is manufactured from vegetable oil or recycled restaurant grease, is expected to quadruple to 9 million barrels a day by 2050, he said.
Exxon is halfway through an eight-year plan to overhaul its fuels and chemicals division, which also involves cutting costs, improving operational performance and selling assets that don’t make the grade. Exxon will operate just 13 refineries worldwide by the end of 2023 after selling five in the past four years to focus on the biggest and lowest-cost operations.
Chemicals will be key to the strategy’s success. Exxon sees demand growth for its high-performance chemicals at about 7% a year, contrasting sharply with gasoline, which is expected to peak globally by the end of the decade. To keep up with this demand, Exxon plans to build a new dedicated chemical plant every four to seven years, Williams said.
The company’s refineries provide an additional means to make chemicals, but they will focus on responding to consumer preference rather than making a big bet on any particular product, Williams said.
"We’re not going to do it while the demand is still there," he said. "We’re going to it at a time when the demand trends are clear and customers don’t need that gasoline."
At the same time technical picture in Exxon stocks (dividends adjusted) illustrates Exxon got a huge support of 30-years SMA, and right here is a key Multiyear breakout.
Further a hundred fold growth is right there to come. Make Exxon Great Again.
#MEGA

$DJI @ a support level & oversoldStated a while ago, not sure if we posted here but did elsewhere (see profile), that we had short term Treasury exposure @ 50% but it's 75% atm. (it's a placeholder until trend changes)
Should've been shorting the entire time down.
TVC:DJI @ support but this area has not been a strong level.
However, we are severely oversold so that bounce can be close & it can happen here.
Sticking with the idea that large bounces should be sold of shorted until the technical data changes.
#stocks AMEX:DIA

$DJI at do or die!!!This is where we see how serious the decline in DJ:DJI is.
AMEX:DIA has not been this oversold since March of this year.
2nd Pic:
Right side = 15minute chart
The lower part shows the Relative Strength = RSI
At the moment is shows some positive divergence, higher lows as index falls.
This is the battle ground!!!!!!!
Keep in mind that the index has taken a ton of damage technically which is NOT good longer term. At least for now.
#stocks AMEX:UDOW AMEX:SDOW

Hellena | DJI (4H): Long to sresistance area 34254.Dear colleagues, I think that the price will make a correction to the resistance area 34254. If the price does not update the minimum of wave 1, then it will be wave 4.
Manage your capital correctly and competently! Only enter trades based on reliable patterns!

DOW JONES Approaching a critical Support cluster.The Dow Jones index (DJI) has broken below the long-term Higher Lows trend-line and has transitioned into a Channel Down. The current Lower Lows leg is approaching not just the bottom of the Channel Down but more importantly the 1D MA200 (orange trend-line) and the 1W MA50 (red trend-line). The latter in particular provided a Double Support Bounce on (June 01 and May 25) and hasn't been broken since March 29.
We are waiting for the first 2-day green 1D candle streak in order to buy and target (at least) the 1D MA50 (blue trend-line). Projected contact at 34450 (target). The 1D RSI has hit the 34.80 Support, which provided the bounce on the August 24 bottom.
-------------------------------------------------------------------------------
** Please LIKE 👍, FOLLOW ✅, SHARE 🙌 and COMMENT ✍ if you enjoy this idea! Also share your ideas and charts in the comments section below! **
-------------------------------------------------------------------------------
💸💸💸💸💸💸
👇 👇 👇 👇 👇 👇

This is the Bottom $btc Bitcoin Fibonacci levels from historic lows, to significant tops. Note that at the .786 level, and anything lower, (note as well the potential 30% drawdown lasting up to 2 months that can occur at significant cycle bottoms) has historically been the bottom for the cycle. We might front run the bottom though and fill up before we reach say $10,000 or lower. The 2018 bear market bottom showed no journey into sub .786 levels, which again would almost certainly be the most optimal long entry point (low end of .786 and anything sub.) Further, THE MOST SIGNIFICANT RISK to take in end of the year 2022, would be an under exposure to the brave new asset, or stocks in general as the fed is forced into dovish expression.
the fed has a money printer

September 23 - Week 4: Thoughtsnikjhgfwrhnikwg
Watch video. I am more or less bearish on every timeframe besides the week timeframe. The week timeframe says we go back up to test, because of being oversold, every lower time frame says its ok to keep moving down.
inhgr3bhyigwrnbywrb

September 23 - Week 3: ThoughtsStill a defensive week. We will see what happens with the Fed Reserve stuff tomorrow.

$DJI broke Head & shoulder & long term trend yesterdayDJ:DJI broke the head & Shoulder pattern on daily charts. However, the volume was not heavy.
AMEX:DIA also broke the up trend from the bottom in 2022
SERIOUS DAMAGE has been done the last 30 days.
We can get a bounce here BUT being Friday, not sure.
---
The previous MONTHLY BEARISH moving avg crossover on the DJ:DJI happened in June 2008. We all know that year.
The RSI in 2008 showed clear Negative Divergence & it formed a Doji (cross) at the top.
2008 bear > 14k - 7 = 50%
CV bear market > 30k - 18K = 40%
2022 bear market > 36 - 28 = 22%
---
Using AMEX:DIA as it resembles DJ:DJI pretty decently
IF 2021 was the top, looking more & more likely as:
RSI did not move strongly
2021 showing Negative Divergence
AND the recent rally was SUPER WEAK!
(wanted to see a stronger relative strength)
But rates can now be dropped & they can come and save the day. Very likely scenario in 2024.

Hellena | DJI (4H): Short to support area 33679 (Wave 3). Dear Colleagues, I assume that the price will soon start corrective movement 2, after which I will consider only short positions with the aim to reach the support area 33679.41.
Manage your capital correctly and competently! Only enter trades based on reliable patterns!

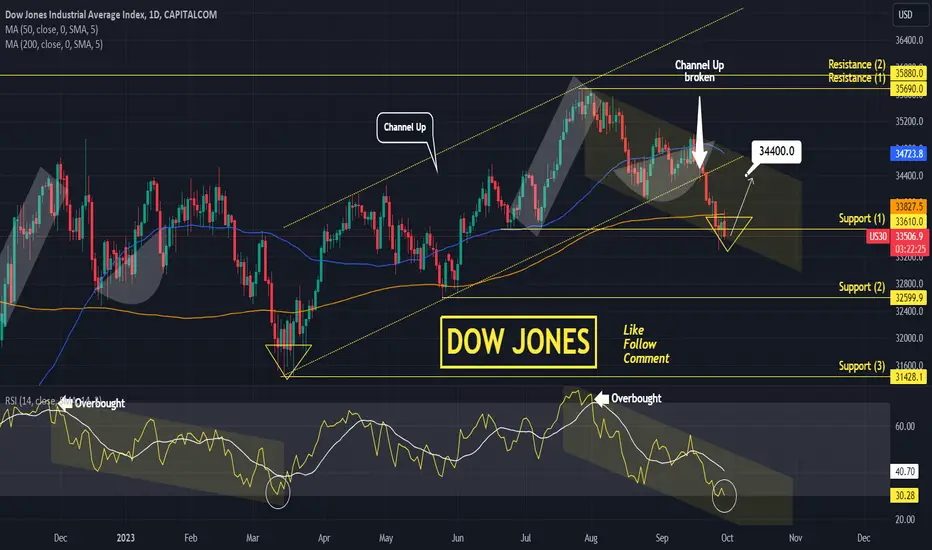
DOW JONES crossed below the 6 month Channel Up.Dow Jones is waving a strong bearish break out signal as it crossed under the bottom of the 6 month Channel Up today and most likely will close that way.
This means that the trend is shifting to bearish on the medium term as a new Channel Down could emerge.
Trading Plan:
1. Sell on the current market price.
Targets:
1. 33840 (MA200 (1d)) and if it breaks after a small bounce target extension 33200 (bottom of Channel Down).
Tips:
1. The RSI (1d) is trading in a Channel Down of its own. Last time it did was from December 2022 to March 2023 and as you see that price action is similar to today's. It bottomed some way under the MA200 (1d), which is consistent with our target extension.
Please like, follow and comment!!
Notes:
Past trading plan:

$TNX $NDX $DJI $SPX $DXY $VIX calls from Sept 11 on pointWe posted an interesting idea September 11th. These are today's notes.
---
The TVC:TNX is pumping higher - "Coincidentally" the SAME time frame that the TVC:NDQ TVC:DJI & SP:SPX are breaking down!
The 2yr has moved a bit & is testing a breakout level.
All shorter time frames from the 2year are STAGNANT!
#stocks #dollar #yield
