CPI, DXY, VIX Down. Stocks Up! Blowoff Top Underway!Traders,
The big news this week was that inflation is now just under 3 percent! This is hugely bullish as any further certainty as to what actions the FED will take in the future only aids in investing confidence. Along with this news, we will cover the dollar decline, VIX 2-year low levels, and stocks beginning to break out even further, confirming my long-held blowoff top theory.
00:00 - CPI, FED rates, Unemployment Rate, DXY, VIX
10:00 - Bitcoin and Crypto
DJI

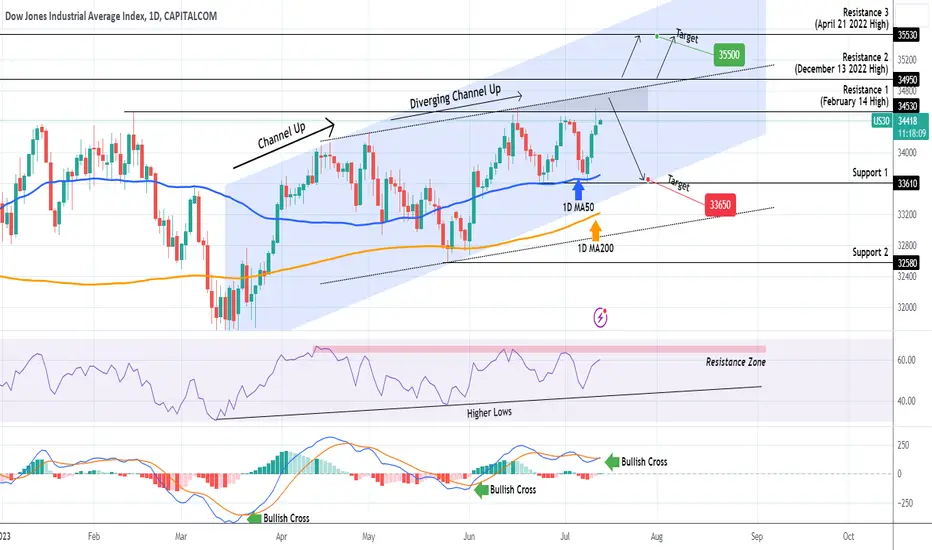
DOW JONES getting closer to Resistance Zone for a technical sellIt's been a while since we looked into Dow Jones (DJI) and made the bottom buy on the Channel Up last Higher Low (chart below):
Right now the index is rising after a rebound on a Double Bottom on the 1D MA50 (blue trend-line). The dominant pattern is a Channel Up and the secondary a Diverging Channel Up (dotted lines) that forms a Higher Highs rejection zone within Resistance 1 (34530) and its top. We will look for a sell on the next candle inside it (ideally with the 1D RSI on its Resistance Zone) and target the bottom of the Channel Up at 33650 near Support 1.
If however the price breaks above Resistance 2 (34950) and the MACD maintains the Bullish Cross it is forming today, we will open a buy and target 33500 (just below Resistance 3).
-------------------------------------------------------------------------------
** Please LIKE 👍, FOLLOW ✅, SHARE 🙌 and COMMENT ✍ if you enjoy this idea! Also share your ideas and charts in the comments section below! **
-------------------------------------------------------------------------------
💸💸💸💸💸💸
👇 👇 👇 👇 👇 👇
Daily Market Analysis - THURSDAY JULY 13, 2023Key News:
UK - GDP (MoM) (May)
USA - Initial Jobless Claims
USA - PPI (MoM) (Jun)
Despite relinquishing some of its gains, the Dow Jones Industrial Average concluded Wednesday's trading session on a higher note. This positive finish was primarily attributed to a decline in Treasury yields and a surge in the tech sector, fueled by data indicating the slowest inflation increase in more than two years. The market sentiment has been uplifted by optimism that the forthcoming rate hike, scheduled for later this month, could potentially mark the conclusion of the tightening cycle.
The Dow Jones Industrial Average experienced a 0.25% climb, translating to a gain of 86 points. Meanwhile, the Nasdaq witnessed a robust increase of 1.2%, and the S&P 500 displayed a notable rise of 0.74%.
DJI indices daily chart
Nasdaq indices daily chart
S&P500 indices daily chart
In June, the consumer price index (CPI) registered a modest uptick, rising by 0.2% following a 0.1% increase in May. Additionally, the annual inflation rate eased from 4% to 3%, reaching its lowest point since March 2021. These figures suggest a reduced level of price pressures in the economy.
While there remains an expectation that the Federal Reserve will proceed with a rate hike later this month, the outlook for additional rate increases beyond July becomes less certain. The uncertainty stems from the possibility of upcoming economic data revealing a continued deceleration in inflation.
US Consumer Price Index (CPI)
Jefferies, in a recent note, highlighted the importance of upcoming economic indicators in determining the trajectory of rate hikes. If indicators such as the Employment Cost Index on July 28, along with employment and inflation data released in August, continue to exhibit a slowdown similar to the recent Consumer Price Index data, it suggests that the rate hike scheduled for July could potentially mark the conclusion of the current cycle.
In line with this sentiment, major technology companies, including Google (NASDAQ: GOOGL), Microsoft (NASDAQ: MSFT), and Meta Platforms Inc (NASDAQ: META), experienced a rebound following a recent downturn. This recovery was fueled by a significant decline in Treasury yields, driven by the expectation that the Federal Reserve's rate hikes are nearing their conclusion.
GOOGL stocks daily chart
MSFT stocks daily chart
META stocks daily chart
Microsoft's shares surged by over 1% as the tech behemoth made significant strides in the completion of its $69 billion acquisition of Activision Blizzard Inc (NASDAQ: ATVI), the renowned game developer responsible for the popular Call of Duty franchise. The acquisition received a boost as a Federal judge dismissed the Federal Trade Commission's request to delay the deal, citing insufficient evidence to support claims of potential competition harm. This favorable development played a crucial role in driving Microsoft's strong performance in the market.
US Dollar Currency Index daily chart
The sell-off of the US dollar gained momentum after the release of the CPI data, leading to a rapid approach towards the 100 level on the dollar index. This consistent and significant movement has positive implications for global inflation dynamics. A weaker US dollar tends to drive down energy and raw material prices, which are often denominated in US dollars. Consequently, lower prices for these commodities can help alleviate inflationary pressures on a global scale. In contrast, a strengthening US dollar contributes to inflationary pressures worldwide. Therefore, the depreciation of the US dollar can provide relief in the face of such pressures.
EUR/USD daily chart
In the currency markets, notable movements were observed. The EUR/USD pair experienced a surge, reaching the 1.1150 level, indicating a strengthening of the Euro against the US dollar. Similarly, the GBP/USD pair surpassed the significant 1.30 level, signaling a rise in the British pound against the US dollar. Conversely, the USD/JPY pair extended its decline, falling below the psychological level of 140, implying a weakening of the US dollar against the Japanese yen. These fluctuations highlight the dynamic nature of the currency markets and the interplay between different currency pairs.
USD/JPY daily chart
The anticipated release of the Producer Price Index (PPI) figures for June today is expected to provide further insight into the global economy's disinflationary trend. Forecasts suggest a significant deceleration in the headline PPI, dropping from 1.1% in May to 0.4% in June. The core PPI is also projected to experience a more modest slowdown, declining from 2.8% to 2.6%.
The weakening figures from the PPI may have implications for future Consumer Price Index (CPI) data, indicating a continued disinflationary environment. This reinforces the notion that the forthcoming rate hike in the United States will likely be the final one in the current cycle.
In summary, the June PPI numbers are expected to confirm the prevailing disinflationary trend in the global economy. The projected slowdown in PPI figures suggests potential effects on future CPI data and supports the belief that the upcoming rate hike will be the last one.

NAS100 Simple Chart Analysis2023 = Recovery Year For Tech Stock ( Come Watch How This Recovery Being Explained )
Nas100 - Highest Rst 16590 Supp 10674
How to view the guidance via chart ( Refer back to pin message guidance if to trade )
Red Line = Support
Blue Line = Resistance
Light Blue = bullish/bearish pattern
Arrow = Double/Trip top/bottom
Red Chip = $$
Green Chip = XX

Hellena | DJI (4H): long to resistanceDear colleagues, before the price reaches the level of 31000, it will complete an ascending diagonal. I anticipate that the price will reach the resistance area at 34449.
Manage your capital correctly and competently! Only enter trades based on reliable patterns!

$DJI $NDX $SPX $RUT all pumping but giving back, what now?DJ:DJI is having hard time here, again.
The RSI is much lower, negative divergence, steam running out?
NASDAQ:NDX is higher but also losing steam, RSI lower.
SP:SPX AMEX:RSP & AMEX:IWM all put higher highs but they're also giving back.
All the #indices have low volume. Kind of normal for this time of year.
TVC:VIX is lower.......
Sell on news?
Lots of GAINS over past few months.
Hmmm, let's see what transpires by end of day.
#stocks

Daily Market Analysis - WEDNESDAY JULY 12, 2023Greetings, traders! Welcome back to our daily Market Analysis. Today, we have gathered the top news and interesting fundamental analysis for your consideration. Let's dive in and stay informed!
Key events:
New Zealand - RBNZ Interest Rate Decision
USA - Core CPI (MoM) (Jun)
USA - CPI (YoY) (Jun)
USA - CPI (MoM) (Jun)
Canada - BoC Interest Rate Decision
USA - Crude Oil Inventories
The energy and large technology sectors were the primary contributors to Tuesday's gains in the stock market, while investors awaited the forthcoming inflation reports with bated breath. The rise in value of the Dow Jones Industrial Average was 317 points, or 0.9%, while the rise in value of the S&P 500 was 0.7% and the rise in value of the Nasdaq was 0.6%.
DJI indice daily chart
SPX500 indice daily chart
As a result of an improved demand outlook, oil prices skyrocketed, which provided a boost to the energy sector. There is a growing expectation that the oil market will tighten in the second half of this year. This expectation is supported by falling crude production as well as Saudi Arabia's commitment to cutting output by one million barrels per day beginning in July. The sentiment surrounding energy stocks was further buoyed by reports of potential stimulus measures in China, which is the largest importer of energy in the world.
The stock of 3M Company (NYSE: MMM), which was upgraded by Bank of America to Neutral from Underperform, increased by almost 5% as a result of the upgrade. It is anticipated that the manufacturer of industrial and consumer products will benefit from the conclusion of legal issues, which is anticipated to enhance the performance of the company. A settlement agreement was reached between 3M and the government last month to resolve allegations that the company contaminated public water systems with PFAS, which are also known as forever chemicals.
MMM stock daily chart
After receiving an upgrade from Hold to Buy from Jefferies, JPMorgan (NYSE: JPM) led the banking sector higher just as earnings season was about to begin on Friday. As justifications for the upgrade, Jefferies pointed to the robustness of JPMorgan's balance sheet as well as the company's potential for earnings. Gains were also seen by regional banks, which have come under increased scrutiny ever since the banking crisis that began earlier this year. After Bank of America reaffirmed its recommendation to buy the company's stock, US Bancorp (NYSE: USB) saw its share price rise by more than 3.5%. US Bancorp is well-prepared to handle sector headwinds, according to Bank of America, and is expected to achieve superior earnings growth and stock performance, according to the statement.
JPM stock daily chart
Amazon (NASDAQ: AMZN), which benefited from its two-day prime day sales event, stood out as one of the few stocks in the technology sector that was trading in the positive territory. During this time, Microsoft (NASDAQ: MSFT) struggled to make gains, despite the growing optimism surrounding the impending acquisition of Activision by Microsoft for $69 billion. Activision is the company that makes the Call of Duty video game. The attempt by US regulators to temporarily block the deal due to antitrust concerns was rejected by a federal judge in a ruling earlier today.
The forthcoming publication of US CPI (Consumer Price Index) data has become the sole focal point of attention for stock futures trading in both the United States and Europe. The majority of speculators are expected to be surprised by the US inflation data, which analysts strongly anticipate will exceed their expectations.
AMAZON stock daily chart
The change in the Consumer Price Index (CPI) for the United States is expected to be 0.3% month-over-month (m/m), while the change in the CPI year-over-year (y/y), which is the most significant change, is expected to be 3.1%, compared to the previous reading of 4.0%.
If the actual number comes close to or matches the forecasted 3.1%, it will be seen as positive news for the market because the inflation target set by the Federal Reserve is 2%. On the other hand, market participants are likely to rejoice if the reading falls below 3.1% because this indicates a significant shift in the trend of inflation. Nevertheless, it is essential to pay close attention to the trajectory that the reading of inflation will take in the future. Although the data that are released today will show a significant drop, which will be driven by tighter monetary policy, an economic slowdown, and lower oil prices, these factors will have less of an influence on the inflation number going forward. As a consequence of this, the gap between the Fed's target and the actual reading might not expand by an additional factor of two from its previous magnitude.
GOLD daily chart
It is anticipated that the price of gold will be volatile throughout the course of the day. Even though the support level at $1,900 is strong, it may be put to a significant test if the inflation data continues to show no signs of easing. Gold prices would be supported by a sizeable decline in the reading of inflation, which could potentially lead to an attempt to test the $1,950 level. On the other hand, if the reading indicates that inflationary pressures will continue for some time, the price of gold may go up even further. As a result, there is a greater chance that the Federal Reserve will raise interest rates, potentially on more than one occasion.

$DJI $NDX $SPX $RUT Long & Short term viewsBringing indices up again, Let's look at the SHORT TERM first.
(Unfortunately can only show 1 chart, see profile for more info)
DJ:DJI longer term still showing an ascending triangle, current pattern is sideways channel, there's some negative divergence.
NASDAQ:NDX maintains the uptrend, HOWEVER - we're seeing SEVERE negative divergence.
SP:SPX also in current sideways channel, and also showing SEVERE negative divergence.
TVC:RUT completes the bunch with a sideways channel and some neg divergence.
----------------------------------------------------
Longer term #indices are interesting. Using weekly.
DJ:DJI showing slight negative divergence, needs to break out FAST
NASDAQ:NDX Extremely overbought, last 3 times; 2 corrections, 1 major drop.
SP:SPX Nothing out of the ordinary, lil overbought, see #NDX notes.
TVC:RUT Severe underperformer and it looks like it wants to catch up to the others.
#stocks

MACRO UPDATE - History is no longer reality since debasement
Take some time to focus on the information and macro movement here and compare it with my notes.
Why are leading economists and leading institutions fumbling? imagine comparing history prior to 2008 where Quantitative Easing did not exist.
No standard macro indicator will be accurate due to the debasement of money that happen during the GFC, compare the SPY to money supply we see that we barely have reached post 2001 levels, 2007 highs.
Jerome Powell will not admit this because the system has basically been debased hence the over compensation for rate rises why did he do it? because the debt situation is worse than it seems.
This is a very unique situation where retail is still majority short on options/futures while money market funds are still in trillions of cash. If this does play out and you're an institution do you wait for the final bubble to melt up? or do you allocate now and try to capitalize or risk missing the market, either way, something interesting is about to happen.
Reminder NO economic indicator can be trusted prior to 2008, its like using map plans for Atlantis you will quickly find out all your indicators are defected.
T10Y2 | Is the indicator the federal reserve uses to find recessions.
USM2 | M2 US money supply
USINTR | USA Interest Rates
WALCL | Federal Reserve balance sheet
SPY/M2SL | SPY adjusted for the debasement
Blue line | Global (major) central bank balances

Combined US Indexes stick sandwichedQuick review... The combined charts appears to be giving a very clear heads up - with a candlestick sandwich !
Together with falling volumes, or in this case a falling VolDiv indicator, once the two red lines are broken, it is going way down, probably close to 600.
MACD is also supporting a weakening rally that is long in the tooth.
A storm is brewing... you know how you can smell it before you see it? That's where we are now, I think.

$VIX call was good, markets weakening a bitCBOE:VIX had a $3 bounce from 13.60 call we made.
#Stocks did move a tad higher from that call but are now at the levels when the call was made
SP:SPX held red 10 day EMA (exponential Moving Average).
Sell volume has been coming in @ the higher levels. Hmmm.
NASDAQ:NDX #SPX $ TVC:DJI are all showing negative divergence. This is interesting. Is the current up trend weakening?

Daily Market Analysis - FRIDAY JULY 07, 2023Key News:
USA - Average Hourly Earnings (MoM) (Jun)
USA - Nonfarm Payrolls (Jun)
USA - Unemployment Rate (Jun)
During Thursday's trading session, the Dow Jones Industrial Average recorded a decline as robust job market data sparked expectations of further interest rate hikes by the Federal Reserve. This development subsequently led to a surge in Treasury yields, which raised concerns among market participants. The Dow Jones Industrial Average experienced a notable decrease of 1.1%, resulting in a loss of 366 points. Similarly, the Nasdaq and the S&P 500 also faced declines of 0.8% and 0.8% respectively.
NASDAQ, SPX, and DJI indices daily charts
Amidst the broader market decline, Microsoft Corporation (NASDAQ: MSFT) bucked the trend and achieved a gain of nearly 1% driven by optimism surrounding its advancements in artificial intelligence (AI). Morgan Stanley, a prominent financial institution, expressed confidence in Microsoft's position within the software industry, particularly in relation to the projected $90 billion growth opportunity in generative AI by fiscal 2025. In light of this positive outlook, Morgan Stanley increased its price target on Microsoft from $355 to $415, indicating a favorable investment potential for the company.
Microsoft stock daily chart
Despite the launch of its Twitter competitor app called Threads and the announcement by Meta CEO Mark Zuckerberg that it had garnered over 30 million sign-ups since its recent introduction, Meta (formerly known as Facebook) faced a reversal of its early-day gains. The company's stock failed to maintain its upward momentum, and the gains dissipated as the trading session progressed. The market response to Threads and Meta's overall performance suggests that investors and traders may have reacted differently to the news, leading to the subsequent decline in the stock price.
Meta Platforms stock daily chart
In the Eurozone, inflation expectations for the medium term experienced a decrease in May. The gauge measuring the 12-month expectation dipped from 4.1% to 3.9%. Despite this decline, the long-term (three-year) inflation expectations, which hold greater significance for the European Central Bank (ECB), remained unchanged at 2.5%. This level is notably higher than the ECB's target inflation rate of 2%.
The latest flash core Consumer Price Index (CPI) estimates for June further strengthen the argument for proponents of tighter monetary policies within the ECB. These estimates provide substantial justification for those who advocate for a more stringent approach to monetary policy, given that inflationary pressures persist in the Eurozone.
The ECB, as the central bank responsible for maintaining price stability, closely monitors inflation expectations and aims to keep them in line with its target. The fact that long-term inflation expectations remain above the ECB's target suggests that there may be a need for increased vigilance and potential policy adjustments to curb inflationary pressures.
The divergence between medium-term and long-term inflation expectations underscores the complexity of managing inflationary dynamics in the Eurozone. The ECB will need to carefully assess economic data, including CPI estimates, to make informed decisions regarding monetary policy and strike a balance between supporting economic growth and maintaining price stability.
EUR/USD daily chart
Today, the economic calendar in the Eurozone is relatively light, implying that the movement of the EUR/USD exchange rate will primarily be influenced by the market's reaction to data releases from the United States.
The market's response to US data is of particular significance, as it has a notable impact on shaping the direction of the EUR/USD exchange rate. Positive data releases from the US could strengthen the US Dollar and potentially lead to a decline in the EUR/USD pair, while weaker-than-expected data could exert downward pressure on the US Dollar, potentially favoring an upward movement in the EUR/USD pair.
Additionally, the market remains highly sensitive to price-related developments. In this context, there is ongoing concern regarding the Bank of England's aggressive tightening expectations. Speculation suggests that the BoE could implement a significant 140 basis point increase in interest rates by January 2024. This projection, if realized, raises the possibility of a reassessment in the market. If investors revise their expectations and perceive the tightening as too aggressive or potentially detrimental to economic growth, it could pose downside risks for the British Pound. Consequently, the GBP/USD exchange rate could experience downward pressure.
GBP/USD daily chart
The EUR/GBP pair has witnessed a decline over the past two sessions; however, it may find support at its current levels and potentially make a move towards the 0.8600 mark once again. This shift in the pair's direction could be driven by the potential threat of a repricing of the previously overbought British Pound, influenced by the actions of the Bank of England.
The recent weakening of the EUR/GBP pair suggests that the Pound has gained strength against the Euro. However, the current levels may act as a support zone, potentially leading to a reversal in the pair's direction. If the support holds, it could provide an opportunity for the EUR/GBP pair to regain some ground and move towards the 0.8600 level.
The potential repricing of the Pound is a significant factor that could influence the pair's movement. If market participants perceive that the British Pound had become overbought or overvalued in relation to its fundamentals, they may adjust their positions accordingly, leading to a corrective move in the currency. This adjustment could contribute to a potential reversal in the EUR/GBP pair, benefiting the Euro and causing the pair to move higher towards the 0.8600 mark.
EUR/GBP daily chart
Yesterday's market sell-off was primarily triggered by the release of the minutes from the Federal Reserve, which revealed a greater inclination for further tightening of monetary policy than previously anticipated. This direction gained further momentum with the release of strong employment-related data, namely the ADP payrolls and ISM services reports, which indicated that the US labor market remains robust and is expected to continue performing well.
The ADP payrolls report for June showcased an impressive addition of 497,000 new jobs. However, it is important to note that a significant portion of these positions were in lower-paid service roles, which could have implications for wage growth and overall economic recovery.
In addition to the employment data, the prices paid component of the ISM services report indicated a slowdown, reaching its lowest level in three years. This decline in price pressures suggests that inflationary pressures might be easing, potentially influencing the Federal Reserve's decision-making process regarding future monetary policy actions.
The combination of the Federal Reserve minutes highlighting a stronger inclination for tightening, along with positive employment data and easing price pressures, contributed to the market sell-off observed. Investors and traders reacted to these factors, reassessing their positions and adjusting their expectations accordingly.
US Employment Change
The resilience of the labor market presents a challenge for the Federal Reserve in its pursuit of achieving its target inflation rate. Despite the possibility of a potential decrease in headline Consumer Price Index (CPI) to 3% in June, the task of returning inflation to the desired level becomes increasingly difficult.
Today's release of the US nonfarm payrolls report for June has the potential to further reinforce optimism about the US economy. A strong jobs report would provide evidence of a robust labor market, indicating economic strength and potential future growth. However, there is also a concern that such a positive report could lead the Federal Reserve to overestimate the economy's resilience and prompt them to raise interest rates more aggressively than necessary.
The market has already priced in these expectations, as reflected by the recent rise in yields. The anticipation of a stronger economy and the possibility of more aggressive rate hikes by the Federal Reserve have contributed to an increase in yields. This pricing-in of expectations suggests that there is a level of caution in the market regarding the potential actions of the central bank and the impact they may have on various sectors.
Balancing the need to support the labor market with the goal of achieving the desired inflation rate remains a challenge for the Federal Reserve. The nonfarm payrolls report for June will be closely watched by market participants and policymakers alike, as it has the potential to shape future monetary policy decisions and market expectations.
As always, it is important to monitor economic data releases, central bank statements, and market sentiment to gain a comprehensive understanding of the current landscape and make informed decisions regarding investments and trading strategies.

DOW JONES: pulling back to the 1D MA50 again.Dow Jones has had a technical HH rejection at the top of the dotted Channel Up and just as quickly, the price is approaching the 1D MA50, which offered support on the June 26th rebound. The 1D technicals are neutral (RSI = 48.089, MACD = 156.460, ADX = 28.256) indicating that the 1D MA50 is now the pivot level: as long as it holds, expect the price to bounce on it again, so we will buy and target the R2 (TP = 34,95) but if it closes a 1D candle under it, sell and target the bottom of the dotted Channel Up (TP = 33.000).
The strongest buy opportunity on a four month basis is when the RSI hits its HL trendline.
## If you like our free content follow our profile to get more daily ideas. ##
## Comments and likes are greatly appreciated. ##
SPX about to touch 4800 in few months, get ready for a big Move SPX about to touch 4800 in few months.
get ready for a big Move in stocks .
index is showing range bound since July 2022 and now breaking out .
stocks always move first

Daily Market Analysis - THURSDAY JULY 06, 2023Key News:
USA - ADP Nonfarm Employment Change (Jun)
USA - Initial Jobless Claims
USA - Services PMI (Jun)
USA - ISM Non-Manufacturing PMI (Jun)
USA - JOLTs Job Openings (May)
USA - Crude Oil Inventories
During Wednesday's trading session, the Dow Jones Industrial Average concluded the day with a decline, driven by the release of the Federal Reserve's meeting minutes for June. The minutes indicated a growing interest among policymakers in resuming interest rate hikes. However, in the tech sector, major players showcased mostly positive performance. Notably, Meta (formerly known as Facebook) soared to a 52-week high as anticipation mounted for its upcoming Twitter competitor.
Specifically, the Dow Jones Industrial Average recorded a decrease of 0.38%, translating to a decline of 129 points. Similarly, both the Nasdaq and the S&P 500 experienced a modest 0.2% decrease during the trading session.
Dow Jones Industrial Average Index daily chart
The release of the Federal Reserve's meeting minutes from June, which occurred on Wednesday, shed light on the members' sentiment regarding future rate hikes. The minutes revealed that a significant majority of the members, described as "almost all," expressed support for the notion of resuming rate hikes. This position was motivated by concerns about persistently high inflation levels, which were deemed "unacceptably high."
Furthermore, the minutes indicated a hawkish stance among some members, with a preference for raising rates rather than pausing during the June meeting. These members highlighted their worries about a tight labor market, recognizing that such conditions could potentially drive up wages and inflation even further.
However, while the discussion expressed a general inclination towards resuming rate hikes, the decision to implement such actions in July will largely depend on upcoming data. Pantheon Macroeconomics suggests that the forthcoming data expected to be released this week and next will play a crucial role in shaping the Fed's decision-making process.
It is worth noting that approximately 90% of traders, as indicated by the Fed Rate Monitor Tool, anticipate that the Federal Reserve will indeed resume rate hikes in July.
Effective Fed Funds Rate
Investor concerns regarding a potential global economic slowdown were heightened due to underwhelming services data from China. However, the impact of these concerns on the broader market was somewhat mitigated by the strong performance of prominent technology companies. Notably, Meta (previously known as Facebook) experienced a significant surge of over 3%, reaching 52-week highs. This impressive performance came ahead of the launch of Meta's rival Twitter app, Threads, scheduled for Thursday. It is noteworthy that Twitter had recently announced its decision to temporarily restrict the number of posts users can read on its platform.
Meta Platforms stocks daily chart
Despite Apple's 0.6% decline, the company's market capitalization remains above $3 trillion, demonstrating its significant value in the market. In contrast, Microsoft experienced a slight increase in its stock price. Wedbush, a prominent research firm, predicts that Microsoft will also join the exclusive $3 trillion club alongside Apple by early 2024. This projection is based on the belief that advancements in artificial intelligence (AI) will be a major driver of Microsoft's growth and valuation. Wedbush noted in a statement on Wednesday that, considering the potential of AI and through a sum-of-the-parts valuation, Microsoft's overall value should propel it to the esteemed $3 trillion club within the next few years.
Microsoft stock daily chart
During the US Independence Day holiday, major currencies displayed a noticeable trend of trading within narrow ranges in relation to the US dollar. Among the G10 currencies, the New Zealand dollar (NZD) emerged as the top performer. This could be attributed to the unwinding of long positions in the Australian dollar/New Zealand dollar (AUD/NZD) pair, which likely contributed to the NZD's relative strength in the market.
AUD/NZD daily chart
Throughout this week, European markets have faced consistent declines, with yesterday's losses being notably significant. The downward trend in the markets is expected to persist today.
The market weakness witnessed yesterday was primarily fueled by concerns surrounding disappointing services Purchasing Managers' Index (PMI) data from both China and Europe. These underwhelming data releases have heightened worries about a potential global economic slowdown. Furthermore, the increasing risks related to interest rates have contributed to weakness in sectors such as basic resources, energy, and financials, amplifying the overall market downturn. These negative sentiments have had a spill-over effect on Asian markets as well, reflecting the widespread concerns about the global economic landscape.
Employed Usually Works Full time Chart
US Employed Persons status
Today's highly anticipated release of the ADP payrolls report is expected to show a robust figure of 225,000, slightly lower than the previous month's 278,000. Despite this slight decrease, it is important to note that the current level of job vacancies suggests that we are unlikely to see a weak jobs report in the upcoming months. Consequently, it is less probable that the labor market will serve as the catalyst for the Federal Reserve to signal a pause in its policies in the near future.
US Purchasing Managers Index (ISM)
The Federal Reserve has expressed concerns regarding the persistence of services inflation, highlighting its potential impact on the economy. Today's ISM services report is anticipated to reveal a modest uptick in headline activity, reaching around 51.3. However, special attention will be given to the prices paid component, which experienced a decline to 56.2 in May, marking a three-year low. This data will provide insights into the pricing pressures faced by service providers.
As for Independence Day, please note that trading hours may be affected due to the holiday in the United States.
The Unemployment Rate is a key economic indicator that measures the percentage of the labor force that is unemployed and actively seeking employment. It provides insights into the health of the labor market and is closely monitored by economists, policymakers, and market participants.

DJI - Dow Jones Next Possible MovePair : Dow Jones ( DJI )
Description :
Impulse Correction
Bullish Channel as an Correction in LTF and Rejection from the Upper Trend Line
S / R Level
Completed " ABC " Corrective Wave and " 123 " Impulsive Wave
Break of Structure
RSI - Divergence

DOW JONES is aiming at a new Low unless the Resistance breaks.Dow Jones is trading inside the corrective wave of the long term Channel Up.
As long as Resistance A (34575) holds, sell and target the Channel's bottom and 1day MA100 at 33500.
If the Resistance A breaks, buy and target 34850.
For a long term buy, always look to buy inside the 4hour RSI's buy zone, which is on oversold territory.
Previous chart:
Follow us, like the idea and leave a comment below!!

DOW JONES Take profit soon. Pull back expected.Dow Jones is almost on Resistance (1) at 34530 with the top of the dotted Channel Up just over it at 34700.
That is a level where the buy profits from the MA50 (1d) buys should be realized and then wait for a break out or pull back in order to continue buying.
Trading Plan:
1. Sell within 34600 - 34700.
2. Buy if the (1d) candle closes over 34700.
3. Buy on the MA200 (1d) at 33500.
Targets:
1. 33500 (MA200 1d).
2. 35400 (near the top of the yellow long term Channel Up).
3. 34900 (Resistance 2).
Tips:
1. The RSI (1d) is posting a sequence similar to the February top. That started a significant medium term correction.
Please like, follow and comment!!
Notes:
Past trading plan:

DJI- Bullish picture overallAfter the recent test of support at 32800, DJI reversed to the upside and tested 34300 resistance.
The recent correction is a higher low and with the price back at resistance there are high chances of an up break.
In such an instance continuation is probable and the index could test the ATH.
I'm bullish as long as the recent low remains intact

$DJI looking good & likely maintains the momentumTVC:DJI has had one weekly CLOSE above 34.4k since April 2022 & another on Friday. of last week.
Daily, the issue is a close above 34.6k.
-
Notice the heavy volume on the down days?
All, except one day has been a solid bottom.
-
The Ascending Triangle forming likely means that we have MORE upside on the Dow Component.
AMEX:DIA AMEX:UDOW #stocks AMEX:SDOW

Combined US Indexes reverses in a rallyIgnoring the candlestick pattern, the week ended on a Friday gap up and rally to close at a high.
Previous expectations of a retracement may be premature.
Currently bullish outlook, for now, as it stretches out of the set range.

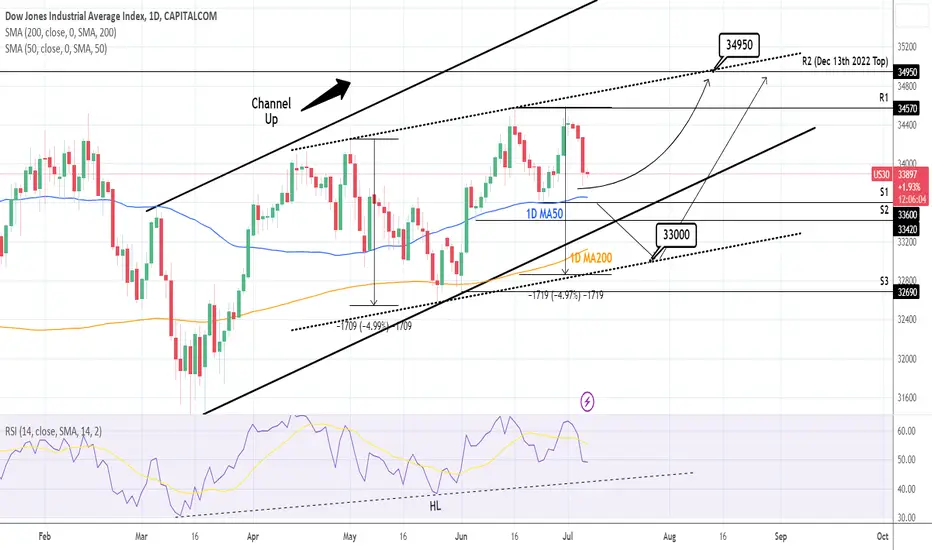
DOW JONES: Bullish as long as 1D MA50 holds. Bearish if broken.Dow Jones turned flat following the rebound on the 1D MA50 three days ago with both the 4H and 1D technicals neutral (RSI = 53.777, MACD = 111.180, ADX = 25.084). As long as the 1D candles closes over the 1D MA50, stay bullish and target the R2 (TP = 34,950). A crossing under the 1D MA50 will most likely target the 1D MA200 and possibly even lower at the bottom of the diverging Channel Up, aiming to complete a -5% decline (TP = 33,000). That can be an excellent long term buy entry. However if the RSI rebounds on its HL trendline, then enter the buy earlier regardless of a 1D MA200 hit or not.
Prior idea:
## If you like our free content follow our profile to get more daily ideas. ##
## Comments and likes are greatly appreciated. ##

Dow Jones globally will fall due to the north node cycleTVC:DJI globally will fall, because the Gann square of 20, built for the New York Stock Exchange indicates the date 2023 (reversal), and since on the monthly chart is now flat, and the market is at high prices, then a fall is more than likely. In 2024, a global strongest crisis is expected in another astrological cycle. There was already a similar crisis in 2008, and then the same cycle worked.
The fall may begin both now and by the second half of 2024, as they can still pump money, or at least say everywhere that there is no stronger economy in the world than the American one, and this will delay the fall for some time.
It will be possible to speak about the end of the crisis no earlier than the beginning of 2028.
