DJI

Bitcoin's Negative Correlation with DXY - Part IIHere's a longer-term look at Bitcoin's negative correlation with the US Dollar Index, in looking at an overlay of the monthly DXY on top of Bitcoin.
CC also displays significant negative correlation, and during the brief periods where it has been positively correlated, that correlation has been insignificant. At least this has been true over the last two major bull runs/corrections and halving cycles.
The two also look like a mirror image of each other, and as mentioned in previous posts - this makes sense. If the dollar is strong, we should expect Bitcoin to weaken, and vice versa.
My previous post about this, here:
The same is true for Gold vs. DXY, as shown below, and for stock markets as well, most of which have been positively correlated with Bitcoin, especially more recently since the 2020 March black swan event. Here are a couple different looks at this:
From the perspective of DXY and its correlation with Bitcoin, Gold, Dow Jones Industrial, and Nasdaq.
And then a look at Gold vs. DXY:
Should DXY move up here, the Bitcoin market and other markets mentioned above may be in for much further and deeper correction. Conversely, should it move down, we could see extended recoveries or even new ATHs as shown in the diagram above. Either way, we should be aware of DXY's movements:
Long-term DXY looks incredibly bullish, with breakout, after re-test, after breakout, after re-test:
Meanwhile Bitcoin could go in either direction as well, and I would imagine it will go in the opposite direction of DXY here, long term. It could first reach 38k to create a new high following DXY's more recent low, and then head back down towards the lower target at 13k should DXY continue up:
Long-term if DXY moves up beyond 112-114 -> 118-120ish, expect blood in the markets.

SPX/DJI: A Peculiar CorrelationPrice action discounts everything.
The most important included. It discounts prejudgement.
Price discounts everything every time...
...except when we don't want to allow it to change our hypotheses.
High yield rates are synonymous with recession.
We are convinced that high yield rates is the thing the majority hates.
From this chart above, we conclude that this may not be happening after all...
The majority (500 SPX companies) is growing against the minority (30 DJI companies) in periods when yield rates consistently rise.
Everything is relative. Recession is relative. Bubbles are relative.
A Big-Tech bubble was formed throughout the last two decades.
Now, in a high-yield environment, this bubble is fed using derivatives.
With incredible correlation, as yield rates increase, the relative density of QQQ derivatives increases. While this is an experimental calculation, only QQQ is showing this kind of derivative filling. SPX and DJI show more stable behavior.
Given that in DJI most companies are Big-Tech, the following chart comes up to prove the long-term fundamentals of big vs small.
Curiously, yield rates target a range of about 8%, similar to the inflationary highs.
Inflation seems to be calming. Many wish rate cuts...
A rate cut schedule however may signal the beginning of a recession for the US.
Cutting rates will push bond prices higher. Thus, a money outflow from equities and into bonds is created. This outflow will be a cause for SPX weakness.
As the SPX*yields chart suggested, a near-term recession may be coming.
For the following few years, SPX seems strong as the yield-SPX/DJI correlation showed.
It can take decades though for balance to shift decisively.
We need both oscillators to get bearish for a convincing move.
While Buffett advised investing into oil, but not all oil is the same...
(High yield rates for the US will drive prices lower. Yield-SPX correlation points us to SPX bullishness in a high-yield environment)
In a progressively higher-yield environment, the outflow from bonds and into equities can get immense.
A US debt default will outright crash bond prices, aiding the potential for SPX to move higher.
Not all is well for the US though. Money is already seeking other ventures...
Don't fall for the news-driven trap.
Tread lightly, for this is hallowed ground.
-Father Grigori
P.S. A US Default might not be as light as I describe.
Who knows how big the scale of such an event might be...
P.S.2. I am posting a link to the indicator I am using:
It is highly experimental, but I am beginning to get a good grip of it. Many adjustments may follow. This indicator can be used in any timeframe, and in charts of any scale.

#us30 will perform an enormous rally today from this point.Us30 will rally by about 680 points today from this point. If/when this pans out give me a like and a comment.

SPX & Dow divergencesI firmly believe the Dow transports are an important leading metric to identifying the overall strength in the economy.
Since the highs in Feb, transports have not participated in the rally to the upside.
What this tells me under the hood of this economy we are seeing weakness.

DOW JONES: Inverse Head and Shoulders on 1W target 34,350.Dow Jones hit again the underlying Support which marked a low on January 16th. That was the Left Shoulder (LF) of a potential Inverse Head and Shoulders pattern and if it holds again, this one will be the Right Shoulder (RS). The 1W timeframe is technically neutral (RSI = 49.180, MACD = 258.440, ADX = 22.862), which makes it a solid buy opportunity on a two month perspective. Our target is the bottom of the R1 Zone (TP = 34,350).
Prior idea:
## If you like our free content follow our profile to get more daily ideas. ##
## Comments and likes are greatly appreciated. ##

DOW JONES Death Cross on 4h after 3 months.Dow Jones posted its first Death Cross on the 4h timeframe since February 22th.
This should prepare us for more selling if Support (1) breaks.
Trading Plan:
1. Sell under Support (1).
2. Buy over the MA200 (4h).
Targets:
1. 32450 (Channel Down bottom).
2. 34500 (Megaphone top and Resistance 1).
Tips:
1. RSI (4h) is posting a price action indentical to the one on the start of the Megaphone.
Please like, follow and comment!!
Notes:
Past trading plan:

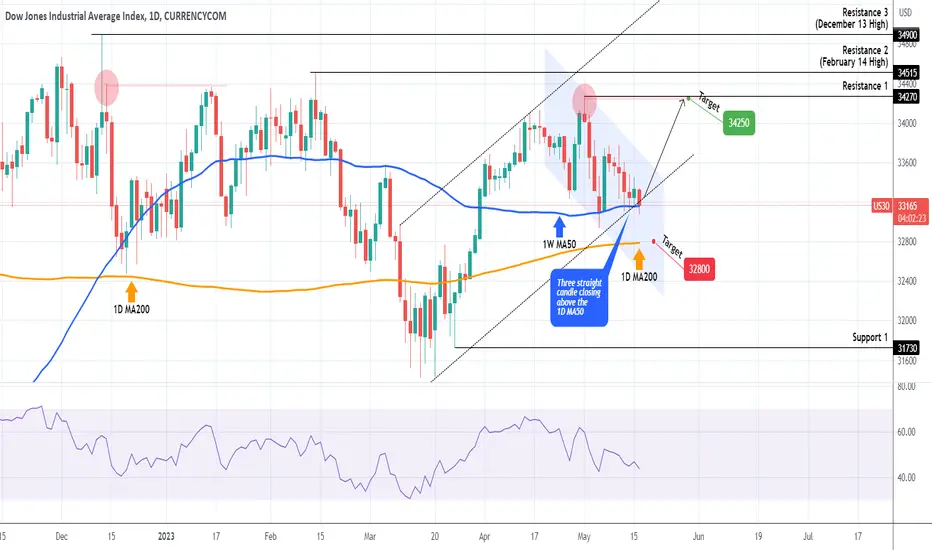
DOW JONES Big Buy signal if it holds the 1D MA50Dow Jones (DJIA) has gone a long way since the efficient buy signal we gave exactly 2 months ago:
The index is right now testing the 1D MA50 (blue trend-line), which has closed 3 straight 1D candles above it and 4 since May 04. Since it broke below the Channel Up, going to the 1D MA200 (orange trend-line) and 32800 is possible but not as long as it keeps closing above the 1D MA50, which has been established as the short-term Support. Instead, as long as it does, we are bullish and targeting 34250.
-------------------------------------------------------------------------------
** Please LIKE 👍, FOLLOW ✅, SHARE 🙌 and COMMENT ✍ if you enjoy this idea! Also share your ideas and charts in the comments section below! **
-------------------------------------------------------------------------------
💸💸💸💸💸💸
👇 👇 👇 👇 👇 👇
SPX | Waiting For The Miracle To ComeThis year has been very boring... Lot's of horizontal movement, not many interesting news.
Well, except of course that "a couple" of banks went bust.
But if I didn't tell you that, you couldn't tell where in this chart this occurred...
SPX, and the market in general, has been too stubborn despite the importance of the events occurring.
On the one hand, this makes sense. This kind of crisis (banking) has come before, so the markets are calm. A crisis comes when nobody expects it to. And by design, a crisis is an unknowing event of unknowing consequences. A bank going bust is not frightening anymore. The market expects the FED to step-in and bail everyone out.
But the FED cannot possibly bail anyone out. They cannot print any more money (we might have reached a debt ceiling), and even if they could, they could be unwilling to print more money. Inflation will get worse.
So no more money.
Dollar has served as the worldwide reserve currency, until now. China amongst other powerful nations, collaborate into creating an alternative reserve currency. One that will be controlled by them, not by a panicking (?) FED.
The FED might not be panicking, even if we believe that they are trapped. I believe that they have very good knowledge of what they do, and of the repercussions. Absurdly high interest rates can be a mechanism to increase the dollar purchasing strength. And you need purchasing power when you have enemies (Russia, China etc.)
Since 2015, this has worked out tremendously well. The Dollar is making higher highs.
Of course, there are many fundamentals (like the Dollar Milkshake) that push the dollar value to new highs. But interest rates are interest-ing (hahaha) to the Dollar.
And the Dollar is winning battles against many countries of the world.
And with lower money supply, it's value is fated to increase even further.
(I like real reality, not augmented reality, that's why I used M2REAL instead of M2SL)
The money supply is vacuumed back into the printer which created it. And the power of the vacuum is not big, it is exponential.
The Dollar Milkshake Black Hole is now open.
But how much can the FED possibly hike?
The discrepancy between the FED's rate and the Market's rate is at it's highest level. The FED may not be able to hike any higher against the market's expectance. Who knows what will happen if the FED overcomes this limit... (is it even fundamentally possible?)
Inflation is high and it is fated to increase even more. I have posted about it extensively.
The preview of this chart idea is broken, oops...
Now, oil is looking substantial signs of strength.
Oil, the main inflation influencer, is showing significant signs of bottoming. Furthermore, it has retested a trendline that followed us since 2008. Long-term, the only way for Crude is up!
And the only way for equities is down! Just to reach the mean, the OIL/SPX ratio has to increase by 75%. So there is much room upwards for commodities...
Have you realized what SPX has shaped into?
Could this be the anatomy of a bubble? And has it already broken?
It seems that the recession is only now just beginning.
During normal times for the US economy, equities could grow even as yields were increasing. Now we are entering a period of weakness for the economy. Something has to give, either the equities go bust, or the yield rates. (Equities have much more room to drop than Yields do)
A crisis is definitely inching towards us...
A final chart for today:
Equities used to grow as money was created. Now this chart has immense dynamics to move downwards. In a sense, equities have MUCH room downwards, even if money gets created. This comes to prove that equities cannot absorb any more money supply. Money printing from the FED cannot possibly help equities, no matter what they do, they are trapped inside the bearish wedge. Only way for equities is down!
And similarly for SPX
Tread lightly, for this is hallowed ground.
-Father Grigori
PS. What could these charts mean? Are they of any meaning after all?
A crisis is definitely itching towards us...
I HAVE to test. All the time. Or I get this... this ITCH. It must be hardwired into the system or something.
-Wheatley, Portal 2

We will live to witness the greatest downward cycle DJI is in 5t wave soon to finish and soon ABC cycle will start.
The downward cycle will lead the prices to previous wave 4 towards 18000 levels
and Weekly chart:
and Daily chart:
Little bit of steam left that can take prices high, and therefore there is chance of up move in the short term

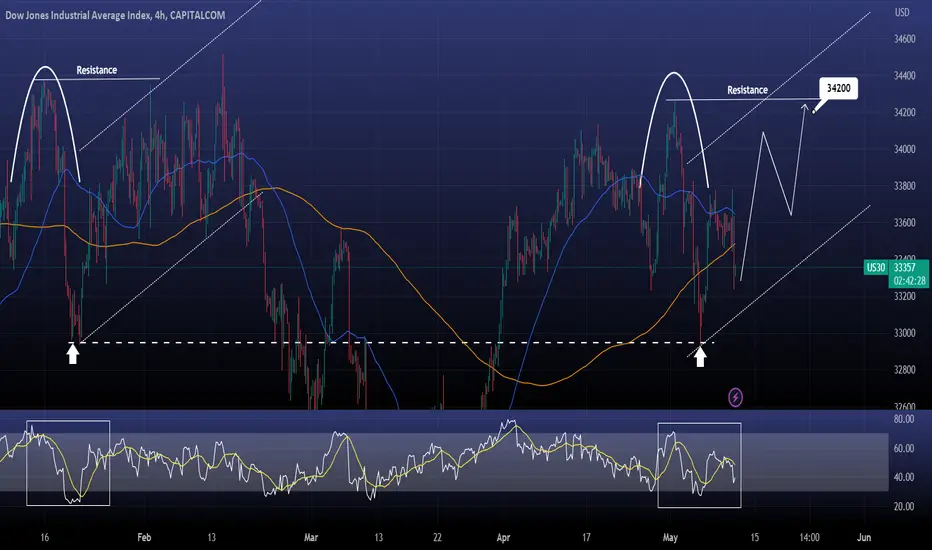
DOW JONES starting a new Channel UpDow Jones is forming a pattern much like January, which after a peak and rejection to a Lower Low, it started a Channel Up.
Both Lows have been formed on the exact price level (32950).
The 4hour RSI sequences are also similar.
The target on January's pattern was the peak's Resistance.
Buy and target 34200.
Previous chart:
Follow us, like the idea and leave a comment below!!
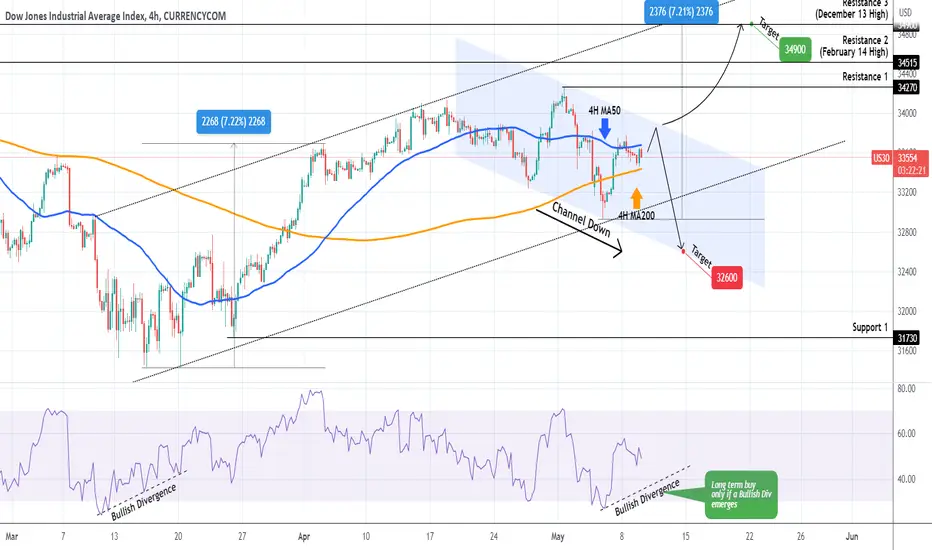
DOW JONES Channel Down emerging. This is its invalidation.Dow Jones (DJIA) is attempting to re-enter the Channel Down pattern that broke upwards, and on the bottom of which we gave the most efficient buy signal almost 2 months ago:
At the moment the index is on the build up of a Channel Down which targets 32600. We will only buy if the price closes above its top (Lower Highs trend-line) and target Resistance 3 at 34900. As far as a long-term buy is concerned, we are only interested in buying if a Bullish Divergence is spotted on the 4H RSI, same as on March 15.
-------------------------------------------------------------------------------
** Please LIKE 👍, FOLLOW ✅, SHARE 🙌 and COMMENT ✍ if you enjoy this idea! Also share your ideas and charts in the comments section below! **
-------------------------------------------------------------------------------
💸💸💸💸💸💸
👇 👇 👇 👇 👇 👇
50 years of chop.good morning,
---
what if i told you right now,
that the stock market was about to enter into a 50 year correction?
you'd probably dismiss it right away and go about your day,
and that's natural,
i get it.
---
i'm not here to appease to your overall bias -
in fact, i am here to directly oppose it.
---
what i'm bringing to you today,
is the idea of the completion of the primary third wave in the stock market.
>if one looks at the yearly picture, one will notice a bearish divergence between the intermediate 3rd and 5th wave, of the primary degree wave (3).
>this is highly indicative that the wave has indeed been completed.
---
i am estimating that the 4th wave takes roughly 50 years to complete, and i theorize that it has begun as of the recent top in 2022.
the original author of this idea was robert pretcher (the writer of elliott wave theory principle),
this idea was initially introduced to me by my mentor, @bitdoctor a few years back.
it has lingered in my mind through out the years, it has haunted me every single day as i have been looking for ways to confirm or find a way to invalidate it.
as of today, i believe i have the necessary data to prove their original theory to be in fact, true.
---
>this doesn't mean that we can't make a new high, in fact that is not what i'm trying to say here at all.
>what i'm simply stating here, is that there's an extremely high probability that the stock market is going to move sideways for the next 50 years.
>i might even be early a few years here, so please don't use this idea as any kind of financial advice, because quite frankly - it is very far from it.
---
the minimum downside target for the macro fourth wave,
is the previous degree wave 4 territory,
which in this case sits between :
$7,000 -12,000.
🍒

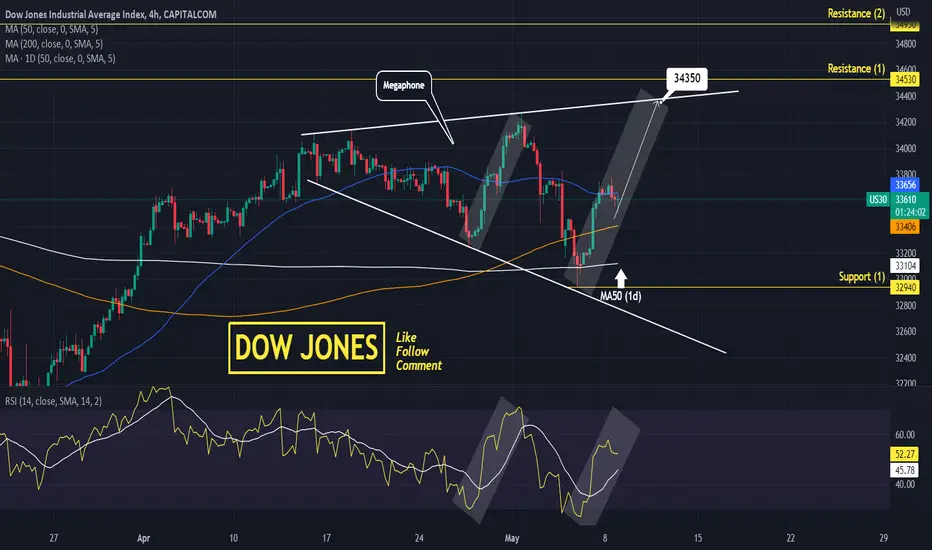
DOW JONES Megaphone targeting 34350Dow Jones is on the 2nd bullish leg of a Megaphone pattern.
The wave started after a closing and rebound on the MA50 (1d).
Trading Plan:
1. Buy on the current market price.
Targets:
1. 34350 (top of the Megaphone).
Tips:
1. The RSI (4h) is identical to the RSI of the 1st Bullish Leg.
Please like, follow and comment!!
Notes:
Past trading plan:
SPX | Of Course I'm Lying (?)I am not lying.
I am completely disproving my latest idea, on how to short SPX. That idea went on Editors' Picks. And I am now killing it.
I am not kidding, April Fools is for fools. I don't consider me or you a fool. So I am being serious.
Chart analysis is not always straightforward. Pinpointing tops and bottoms is the ultimate bet for a trader. As most of you know, this is very hard sometimes.
In 99% of a chart's movement, the trend is continuing. A significant trend change is very rare. Significant evidence for a trend reversal are VERY RARE, and not apparent in all timeframes.
This is a chart that shows clear evidence of reversals. On the weekly timeframe, SPX analysis has showed significant evidence of peaks and bottoms.
Believe it or not, SPX and NDX are showing evidence of going long.
But what about long-term?
Now THAT is a hard conversation.
KST (and many other indicators) can show us incredibly early signs of price stagnation.
Signs of stagnation in long-term charts however, can take DECADES to play out.
SPX/M2SL Technicals were peaking in 1957, but the peak in SPX prices came 6 years later.
For the standard SPX chart, things took even longer to play out.
It is as if we are in 1957. And there is more evidence towards such a realization.
What I did here was basically compare the .com bubble with the Roaring '20s.
The .com bubble was just a very-fast version of the Roaring '20s. If we slow down NDX a little, we end up with the following:
The effect of bubbles is apparent in different periods, and in different scales. The same laws that shaped the 1950-1980 price movement, may be dictating the movement of today's stock market.
The Roaring '20s still has an effect on our moves. We may be living inside the reality-distortion field of the .com bubble.
KST Peaking is an EXTREMELY early sign of stagnation. Price continues upwards, albeit at a slower rate.
Now as we speak, KST reaches this exact point of peaking. This has proved an extremely early sign of stagnation.
Will this time be different, and instead KST is showing an immediate sign, an abrupt crash?
Perhaps things are too simple after all.
Long Live the US!
P.S. Remember, the stock market is for the patient ones, those who plan for decades ahead.
Tread lightly, for this is hallowed ground.
-Father Grigori

SPX | Another LieOrdinarily, I wouldn't contemplate them... but these *are* extraordinary times.
- G-Man
A bank just went broke, oops! It was certainly something we expected. With money literally burning, these kinds of events are expected. So what might be ahead of us?
The rate-hike schedule went relatively smooth sailing until now. But just last week something changed... When the first bank failed, the consensus shifted from calm to fearful.
Now the market is pricing-in the coming yield-peak. This goes hand-in-hand with the yield-curve correcting. At that time, the market expects only short-term yields to increase, while long-term ones will slowly and steadily drop.
Back in 2018, we were begging for the FED to lower the interest rates so as the economy to "grow".
Little did we know, that by lowering rates we were pulling the rug from underneath our own feet.
Equities growing when cutting rates is cheaty...
Now we have the same. We beg for the FED to stop burning money and calm the liquidity crisis that is building-up around us.
This bankruptcy may prove an event that causes even a premature FED pivot. At any rate, both charts and simple logic call for a pause in the rate-hike schedule.
So what can we expect? What I talked about in the original cake. Unsurprisingly, I expect equities to grow next year. Their price will increase while their true "value" will drop. While a sell-off may occur in the weeks to come, this will give the signal that the bottom is in. I believe however that this capitulation will not be the main "event".
The 2018 "Recession" had some violent drops. A sudden 20% drop in 3 months in Q4-2018 was definitely something that conquered the headlines. Passing through that gave the signal that a bottom was already in. The same consensus may be brewing now. Surely the FED cannot tighten further. Surely they will step-in an cautiously calm the financial markets.
The calm will come, and it will stay for some months. Until the calm erodes. And if rates drop, the economy itself will silently erode. Until the building collapses, at a time nobody expects it to.
Tread lightly, for this is hallowed ground.
-Father Grigori
PS.
There are two ways to become rich. Theft and Inheritance.
-Aristotle Onassis, Billionaire
For the rich to get richer, they must rob. They are robbing the unknowing gamblers/investors. In the era of information, in order to rob you must fool the public by changing-up the picture.
Present the eroding building (economy aka. SPX*yields) with a luxurious cover (SPX). And hide the treasure in the dirtiest place of all.
Find the treasure. Don't fall for the trap.

DOW JONES Trade the breakoutDow Jones is rising after the sharp fall earlier today on a pattern that might be an emerging Channel Up.
The 1hour RSI got massively oversold at 13.50.
Buy if the price breaks over the Falling Resistance and target 34250.
Sell if the price breaks under Support A and target 33235 (Support B).
Previous chart:
Follow us, like the idea and leave a comment below!!

DOW JONES The MA100 (1d) is supportingDow Jones has been closing daily over the MA100 (1d) for the past month.
It is making Higher Highs since the March 20th bottom, indicating that the trend remains bullish.
Trading Plan:
1. Buy as long as the price holds Support (1).
2. Sell if it breaks under it.
Targets:
1. 34500 (Resistance 1 and Rising Resistance).
2. 32800 (MA200 1d).
Tips:
1. The RSI (1d) has been rejected on its MA level and is making Lower Highs. That shows a Bearish Divergence that may eventually favour a Support (1) break.
Please like, follow and comment!!
Notes:
Past trading plan:

The Taiwan BRICS War Leading To The Biggest Meltup In History
Can we not see what's happened over the last days? the exact repeat of 2009 instead of QE straight away the FED has resorted to using terms like "BTFP program" and offering zero percent loans to the bigger banks to bailout the smaller banks.
I thought the FRED would have allowed the banks to go down for a market reset "what everyone is expecting" but the response is if the trend line breaks the entire US bond market breaks + the global financial system is in meltdown meaning the FRED and the US Government won't and cannot allow it to happen, oh and the Treasury is almost broke defaulting meaning QE will be turned on within the next months or a "BTFP treasury program".
Lets look at the facts that's got me worried
US dollar dominance will collapse due to QE needed to fund the US government and bailout markets to generate GDP growth
Since 2009 Expenditure on the military in China has gone parabolic from 96 Billion to 293 Billion in 2021 - China also purchases mass gold with Russia (what the hell are they preparing for or doing?)
In 1919 the USA was the top military spending by country
In 1920 the Russian Empire upped military spending passing the USA
In 1922 the Soviet Union was formed spawning the rise of the German dictatorship
What does this mean? it means the Soviet Union is repeating with BRICS and I'm sure the USA is aware of that.
All BRICS nations are printing money like crazy funding gold / military purchases like they are about to disregard the FIAT system.
USA has one option and one option only to defend the global dollar.
Start a counter offense on completely taking Taiwan controlling the entire semiconductor market limiting BRICS economically, and handing over the technology keys to the USA
meaning they can set the rules and prices and force demand back onto the USD system.
If this outcome comes to reality, we will see money printing in the USA disguised flooded into defense and a full NATO move surrounding Taiwan.
Followed by this will be stocks rising + inflation heading up + rates heading lower - -
The goal of this is to devalue the currency and use WAR to take economic assets by force from BRICS causing the wealth to be returned back.
This should answer your question on why the Ukraine War? Why the Red Balloons? both NATO / US + BRICS are using these as a testing ground to predict retaliations for the main goal Taiwan.
If the US / NATO wanted this war to be over in a day it would be. If China / Russia wanted this war to be over in a day it would be nobody ask why its not.
Translation lets steal Trillions from the public and spend 10 billion in Ukraine while storing the rest for R&D for the real event.

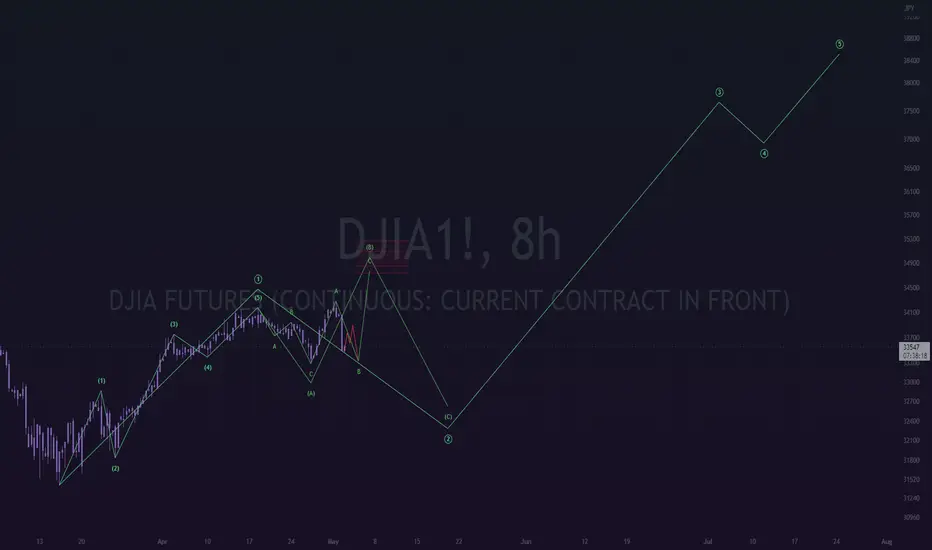
5-2-23 [dow jones]gm,,,
haven't been posting anything public lately - too busy with the private content.
----
created a few minute window today to write this up, and a few others.
----
i am envisioning a massive move to the upside on this dow jones index.
estimating for it to take out the all time highs.
> sounds bananas right?
> maybe to you, anon.
----
og post:
DJI - 15 min BUY SETUP in the makingHi,
I am expecting DJI to reach the area located around the MA. After that will expect a breakout to confirm the uptrend and break yesterdays high once more.
NFA

DOW JONES Small pull-back possible but bullish long-termOne and a half month ago we gave the most optimal buy entry for Dow Jones (DJI) exactly at the bottom of its 4-month Channel Down:
Right now the index is trading inside a shorter term Channel Up that is technically aiming at the 34900 Resistance, which is the December 13 2022 High, as part of its Higher Highs process. If however the 4H MACD currently completes a Bearish Cross, it is more likely to see one last pull-back below the 4H MA50 (blue trend-line) and near the 0.618 Fibonacci retracement level (33600) before the next rally.
-------------------------------------------------------------------------------
** Please LIKE 👍, FOLLOW ✅, SHARE 🙌 and COMMENT ✍ if you enjoy this idea! Also share your ideas and charts in the comments section below! **
-------------------------------------------------------------------------------
💸💸💸💸💸💸
👇 👇 👇 👇 👇 👇

Short - 15M TimelineDear All,
Based on my analysis its a clear short in 15 Minutes timeline for intraday traders.
