DOW JONES Broke above the Channel Down. Nothing can stop it.Almost a month ago we gave the most optimal buy entry for Dow Jones (DJI) exactly at the bottom of its 4-month Channel Down:
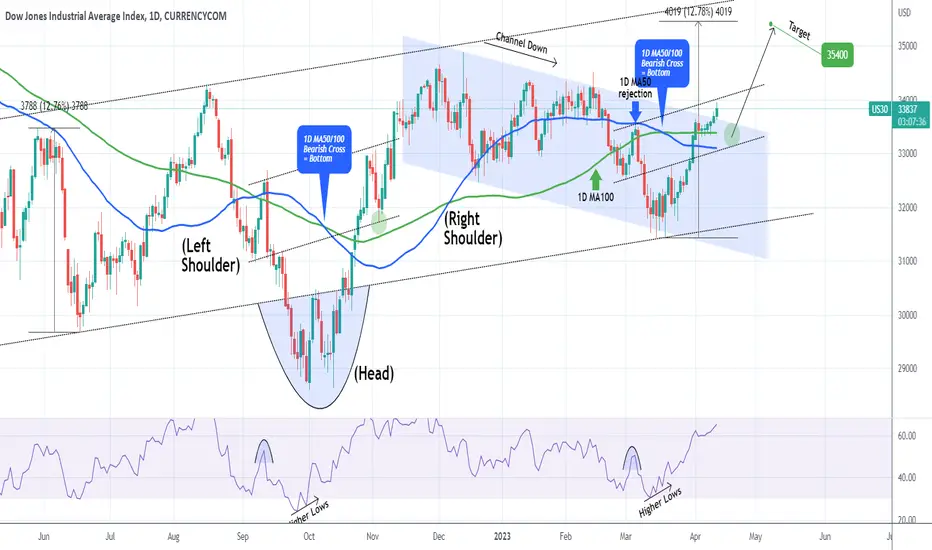
The price has hit our medium-term target and zooming out into the longer term horizon we can see the grand pattern being an Inverse Head and Shoulders (IH&S). This is a bullish reversal formation, in fact it may be characterized as the bottom formation of the 2022 Bear Phase.
The long-term target can be as high as the Shoulders Resistance, the Higher Highs trend-line. If it is inversely symmetrical to June, we can expect a +12.78% rise. This gives us a target for the next 4 weeks at 35400.
Note that if it follows the late October 2022 rally, then it is possible to give one last pull-back within the 1D MA50 (blue trend-line) and 1D MA100 (green trend-line) before our target is materialized.
-------------------------------------------------------------------------------
** Please LIKE 👍, FOLLOW ✅, SHARE 🙌 and COMMENT ✍ if you enjoy this idea! Also share your ideas and charts in the comments section below! **
-------------------------------------------------------------------------------
💸💸💸💸💸💸
👇 👇 👇 👇 👇 👇
DJI
DJI target is getting delivered!Getting close to the perfect touchdown target!
#NDX and #SPX have been in consolidation mode since Mar 31st.
No need to be always in trade; cash is a position too!

#yields - $TNX at important juncture1Yr is still holding better than 2yr & 10Yr
IMO Still look like they're fighting to bottom, HOWEVER, TVC:TNX has a history of breaking current support level.
Monthly RSI looks 2b weakening.
While in theory falling #yield is good for #TECH it historically has NOT been good for #stocks


➖15% S&P500 Index drop by H&S pattern💣The S&P500 index is moving near the resistance line and 🔴resistance zone($ 4,200- $ 4,100)🔴.
The S&P500 index also seems to be forming the right shoulder of the Head and Shoulders pattern in the 🟡Time Reversal Zone(TRZ)🟡.
I expect the S&P500 index to drop to the 🟢support zone($ 3,590-$ 3,490)🟢 after breaking the neckline.
S&P500 Index (SPXUSD) Analyze Daily time frame⏰ (Log Scale).
Do not forget to put Stop loss for your positions (For every position you want to open).
Please follow your strategy, this is just my idea, and I will gladly see your ideas in this post.
Please do not forget the ✅' like'✅ button 🙏😊 & Share it with your friends; thanks, and Trade safe.

DOW Jones New Week Possible MovePair : DJI Dow Jones
Description :
Bullish Channel as an Corrective Pattern in Long Time Frame
Divergence
Break of Structure
Exp Fiat in Short Time Frame
Completed " ABC " Corrective Waves

SGML is ready for next big movebuy in rang of 34-36.
target 70-80 in year.
price is slowly consolidating in the range .

dji h3 IHS bulls buy low after pullback target 36 000🔸Hello guys, today let's review 3 hour price chart for DJI . Speculative Inverse H*S setup in
progress. This pattern was recently covered in the reversal technical patterns overview,
details see below.
🔸Strong V-shape recovery in progress should complete later near neckline at 34 230.
Then we should get a decent pullback to form the RS of the IHS pattern structure.
🔸Recommended strategy bulls: after re-test of the neckline of the structure and subsequent
pullback bulls should be ready to buy low near 32 700, which is also the RS of the pattern.
Normally, we should target at least 36 000 based on measured move price projection.
🎁Please hit the like button and
🎁Leave a comment to support our team!
RISK DISCLAIMER:
Trading Futures , Forex, CFDs and Stocks involves a risk of loss.
Please consider carefully if such trading is appropriate for you.
Past performance is not indicative of future results.
Always limit your leverage and use tight stop loss.

DOW JONES: Inverse Head and Shoulders possibleDow Jones may be close at completing an Inverse Head and Shoulders pattern while being bullish both on the 4H (RSI = 60.932, MACD = 165.930, ADX = 34.060) and the 1D timeframes. A pullback to 32,800 and then rebound would confirm that. Even without it, we are ready to buy the breakout above the Channel Down, targeting the bottom of the R1 Zone (TP = 34,350).
If the Inverse Head and Shoulders is indeed confirmed, we will target R3 and Fibonacci 2.0 by late May (TP = 35,900).
Prior idea:
## If you like our free content follow our profile to get more daily ideas. ##
## Comments and likes are greatly appreciated. ##

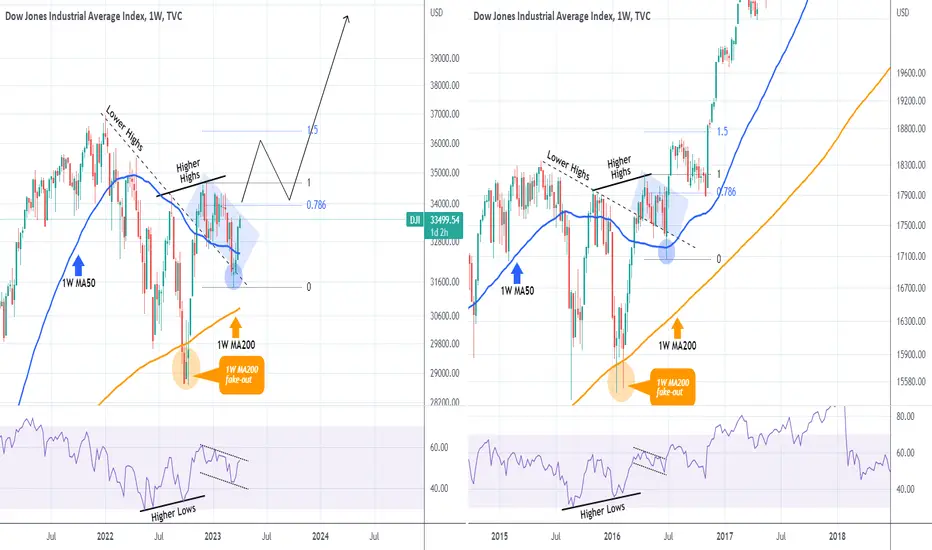
DOW JONES has started a rally that will amaze mostDow Jones is currently on the 3rd straight green 1W (weekly) candle above the 1W MA50 (blue trend-line), testing the top of the 4-month Channel Down. We have previously seen almost the same pattern during the 2015-2016 correction (E.U./ China/ Oil crisis). A fake-out below the 1W MA200 (orange trend-line) initiated a rebound above the correction's Lower Highs trend-line and formed a Channel Down.
This Channel Down in 2016 was nothing but a Bull Flag pattern which after another fake-out, this time below the 1W MA50, it rebounded and almost reached the 1.5 Fibonacci extension with a final pull-back on Fib 0.786 that kick-started a very aggressive rally. Even the 1W RSI patterns match. Do you think that's the blue-print for Dow?
-------------------------------------------------------------------------------
** Please LIKE 👍, FOLLOW ✅, SHARE 🙌 and COMMENT ✍ if you enjoy this idea! Also share your ideas and charts in the comments section below! **
-------------------------------------------------------------------------------
💸💸💸💸💸💸
👇 👇 👇 👇 👇 👇
Customized Ichimuku-With SignalsToday tried to customize the ichimuku indicator.
The output is in your screen...
Pls like if you liked it.

$VIX @ lower level & indices closing in to MAJOR RESISTANCEApril has been the most profitable month over the last 2 decades for #stocks.
The SP 500 has been positive 80% of the time with a 2.5% return.
Posted on this yesterday, but not here.
ATM we're @ the lower end of the $VIX & close to resistance levels for indices; $DJI $NDX $SPX $VIX

DJI Dow headed for a correction.. More pain ahead...If we look at the DJI we can see that on the chart the current price is jumping WAY outside the upper Bollinger Band and the 50 MA is actually above the midline of the Bollinger Band. That can signal a couple things.
1st the pricing being so far beyond the upper band means is due for a sharp downward correction towards the Midline at best and to the bottom band at worst.
2nd, with the 50 MA being above the midline of the Bollinger Band can signal that the local trend support is actually now future resistance. The trend of the bands has the midline the more likely of the 2 targets and that would put the dow in a local down trend in the short term.
Based on what the chart is showing me right now, I would say 31.5k Dow is way more likely to be hit before 34k dow. Depending on how long the correction last, it could be a catalyst for a bigger down trend with a much larger correction still to come later this year. Fed rate decisions, earnings data, lay offs, and a few more international trade issues like Yuan settlements, will play a large factor in the future larger correction timing.

SPX | Let The Roaring '20s Begin!As the famous billionaire said in December 2021 (elon), the "prophet" who is apparently loved and trusted by everyone. I don't know why...
Disclaimer, SPX by itself will probably not follow this path, things are quite complex as you will soon find out.
First of all, Recession is not something simple. Everyone talks about it, but it is not always meaningful.
This year, equities weren't in a recession. While on the one hand the prices dropped, the denominator (dollar value) increased.
The 2022 "Recession" is not apparent, we have just hit the mean. Note that the channel is automatically drawn from 1950 using the Log-scaled Linear Regression indicator.
Taking note of the above, we can interpret that instead of SPX following the 1920's bubble, the pair SPX*yields will.
These charts above give us a valuable lesson. Until now, a .50 increase in yields had little effect on the direct equity value.
A monthly rate hike of 100 points had little meaning in the 80s. A change from 15% to 16% on yields for example, is just a 6% increase in the immediate price of money.
A change from 0.25% to 4.50% in 2022, is an 18x increase.
This means that the immediate effects of such an increase are dramatical. The 2022 "recession" occured just because price was so rapidly revalued. The change in dollar value is "effective immediately", when a rate-hike comes. Everything measured in dollars is immediately repriced accordingly. Even if price may take time to show it, cost does change.
The USOIL true price changed immediately. US investors enjoy a massive discount in oil price, while the rest of the world "enjoys" a bull-flag.
But this phenomenon will not last forever. Rates will eventually hit a ceiling and the FED will pivot. I will now try to "estimate" when the tightening schedule might end.
Had the 2020 crash not happened, this would be an average rate-hike schedule. It lasts 7 years.
This puts the end of the tightening schedule to the end of 2023.
So to add these together, we expect a QT environment until the end of 2023, and stable decrease of yield rates starting in 2024. Now I will try to make sense of them all, and try to find a probable behavior of SPX based on the yield hike-drop schedule. For simplicity, I pretend that the terminal rate is already here (or priced in). After all, the US10Y chart shows signs of peaking. We can conclude that even if this is not the terminal rate today, and based on the FED announcements, the market has already priced in the full extent of the tightening schedule.
I will return to the modified USOIL chart. We have seen that in reality, the price for oil (the main contributor to inflation) dropped a lot thanks to the tightening schedule. The USOIL/yields chart is like a time machine. It shows the final price equities/commodities will take when the dollar-repricing (rate hike) circles around the economy. We can conclude that the rate hike schedule was successful and will cool down inflation (inside the US)
With all of the above, it is safe to assume that:
Inflation has peaked (for now?).
The rate-hike schedule / QT environment will persist until the end of 2023.
From 2024 we can expect rates to drop.
By multiplying or dividing with yields, we can make conclusions for the reason why we were not in a recession this year. Since equities and yields are multiplied to calculate the true equity value, we don't have a clear indication on why the true value is increasing. Charting SPX/yields can help us understand "thanks to who is the true SPX chart increasing".
By analyzing them, we can get more indications on the future movement of SPX.
We assumed that yields have nearly peaked. They will remain constant or increase a little for the months to come.
Equities have no reason to continue a sell-off now that yields have almost peaked and the worst of inflation has passed. So we expect equities to increase compared to steady yields in the following months.
Taking all of that in account, we can end up with the following charts:
A probable scenario:
An improbable scenario:
More about the trends in the following idea:
Moral of the story, always have a plan B. Make sure not to waste it creating a bubble.
When inflation drops and equities bubble, there will be no reason for rates to increase. Just like in the 2018-2020 Recession, we will beg for the FED to drop rates to feed the bubble. When there is no more room for yields to drop, equities will. The equity market is infested with weapons of mass destruction (derivatives). It is bound that we see a burst of this long-term bubble.
Final question of the night: Why would anyone print an astronomical amount of money to make so little in the end?
Tread lightly, for this is hallowed ground.
-Father Grigori
PS. I've talked about how the 2018-2020 Recession no-one remembers is a micrography of the 2008-2009 Recession.
For reference, look at the rate-hike schedule, and notice the little "step" that appears in the end of the 2008 rate-drop schedule. The same appeared in the 2020 crash.
On the left, the modified-GFC is visually similar to the standard GFC chart (with and without yields transformation). On the right, the bubble SPX experienced in 2018-2020 now looks like an actual recession.
PS2. This crazy idea I posted may not be so crazy after all...
PS3. In 2025, Nostradamus (another pseudo-prophet) told that WW3 would come. The same I heard from many others.
endtimeheadlines.org
PS4. The two sources of wealth are theft and inheritance. -Aristotle Onassis
PS5. I am not a trader, I am a father. Take what I say with a grain of salt.

The USA MilkshakeMy recent posts were super bearish... well not this one.
Imagine if you will, somehow, an impossible scenario. With nuclear war looming, food crisis and monetary tightening, something is triggered takes us to the moon, literally and metaphorically.
One of them, which got quite popular (for a man my size), shows an imminent VIX explosion. Maybe the VIX explosion will push everything upwards incredibly fast.
DXY fundamentals are bullish, perhaps dollar-milkshake-bullish.
If we are relieving 1996 (btw I love this year), the repercussions could be completely opposite to what everyone believes.
Take this thought experiment. A sky-rocketing dollar, and with energy bull-flagging, this could be the ideal scenario for certain companies. There are certain aspects of our daily lives that will continue to function (hopefully) no matter what happens, and no matter the cost. Food production, clean energy investments in places like here in EU (solar, wind parks), electricity production are things that will continue no matter what.
I mentioned energy bull-flagging. Oil looks that is has reached a bottom here. The following months look very bullish to it.
Footnote: This chart is about DXY*SPX. These two are behaving like opposite poles. This year had rapid bull runs and painful bear drops, all of which were caused by the immense speed of DXY. By charting this pair, we see the net-effect of cash + equities. All-in I guess??? But what should we bet on???
I am not a trader. Don't take my tinfoil-hat-nonsense as investment advice.
Tread lightly, for this is hallowed ground.
-Father Grigori

DOW JONES above the 1D MA50 for the first time in monthDow Jones hit (and closed over) the 1D MA50 on Friday for the first time in more than a month (Feb 20th last closing over it). With 1D technicals on very healthy bullish levels (RSI = 60.420, MACD = 12.500, ADX = 35.536) this is a very positive sign on the long-term. Especially since the RSI crossed over the 4 month LH trendline.
Our TP (33,450) from our trade idea 2 weeks ago (see below) is almost hit, however short term traders need to start and consider the immediate Reistance levels that the index needs to break in order to extend the long term rally. This is firstly the 33,550 High of March 6th and secondly the top of the December Channel Down pattern. A 1D closing above each would be a bullish continuation signal that would target the next level of Resistance. Primarily we look for a closing above the Channel Down in order to target R1 (TP = 34,350). Conversly a rejection and closing under the 33,550 Resistance would target the lower Symmetrical Support (TP = 32,600).
Prior idea:
## If you like our free content follow our profile to get more daily ideas. ##
## Comments and likes are greatly appreciated. ##

AW Dow Jones Analysis Suggests That It Will Collapse To Zero...Since I created AriasWave I have been trying to figure what we are seeing in the Dow Jones.
I think that I may have finally found the right path towards understanding the most likely potential.
This analysis looks at data going back to 1500AD, where the European data is joined onto the US data.
It has become clear that the whole series of data on that chart indicates an end to the entire pattern is very close.
That long-term Weak 5-Wave move is what I believe will be completely retraced which will equal zero on our modern charts.
I have used this data alongside the long-term bond yield analysis data going back to 1100AD which suggests we are entering an era of extremely negative yields.
Remember to use Disciplined Money Management Principles to ensure longevity as a trader.
If you don't know the long term pattern shouldn't you be doing your research instead of just following the crowd?
Just remember: I am not a financial adviser; I suggest using this only as a guide. Always do your own research.
***AriasWave is not the same as Elliott Wave so your counts may differ to mine if you happen to use it.***

NASDAQ NEXT TARGET 16000 AROUND DECNASDAQ ON A MOVE .
GET READY FOR BIGGER MOVE IN LARGE CAP STOCKS .
DEC TARGET 16000 APRROX.
different and new stocks starts to move in new bull market

Bias more on upside for coming DJI1st April 2023
Bias on the upside with my view sharing in the video.
Resistance: 33500 / 34000 / 34300
Support: 32800 / 32000 (break below may not be a good sign for the bull)

The DOW Road has Ended. Now Welcome Hyperinflation.The market has chosen a way to profit throughout all these years. This is the end of this way, QE lead us here... in this dead end. Equities was the "gold" of the time that passed. Now this is changing...
If you read until the end of this idea, you will realize that a lot is changing.
I will briefly analyze this chart and what it tells us. This is the ratio of equities compared to yields. I have modified yields using an equation I made up. This channel is drawn from 01/01/1950. This is a date I use since this is the day America 2.0 was born. I have talked about it on the MV = PQ idea linked in the end of this idea.
Well, we have just missed this trend... Right now we could be witnessing the very beginning of US 3.0. Long-term technicals on this chart are deadly for DJI.
So this chart above suggests that the new big thing is bonds.
As you will now realize, this is not the entire story...
The following are IMPORTANT:
There are some things that trouble me...
SPX compared to energy is showing signs of stagnation. There is substantial drop for equities ahead of us.
So okay, energy cost is going to increase compared to equities, that is something we have taken for granted the past few months. We have talked about this a myriad times... This is not the entire story.
This chart below shows that energy increases will overperform yield increases.
So in a sense, inflation (calculated from commodity cost) will overperform yields.
Inflation is poised to increase much more than yields. Until now yields were consistently decreasing, now there is no more room down for yields.
Even if yields remain stable on today's levels, this chart suggests that energy prices will still increase. If yields increase, energy prices will increase more compared to yields.
This is a recipe for hyperinflation...
This chart below, shows more evidence towards the same conclusion...
Basically, "long-term inflation" (PPIACO*GOLD) is creating bull-flags compared to "total money created from yields" (mod-yields*CURRCIR). This means that the cumulative price of production cost and gold cost, will substantially increase compared to what bonds yield in total.
Conclusion: Chaos. No matter what politicians want, things are out of control right now. These charts suggest that. This is a long-term phenomenon which cannot change from free will. Nature is more powerful than we could ever hope to be ourselves. These charts are simply scary. I don't have the words to explain much. The charts speak for themselves.
I am sorry for the rushed post, and any mistakes that I might have done. I began writing about DOW, and I found out that there is much more happening right now... We all knew that we could have increased cost of energy, and stagnating equities. I couldn't put the scale of them in perspective. I hope that these charts gave you some perspective, they certainly gave me a clear perspective.
PS. While we cannot avoid what is coming, we have the power to choose what boat to take. The stranger told us that we cannot be in two different boats. We are basically obliged to choose our path.
Tread lightly, for this is hallowed ground.
-Father Grigori

Intraday Buy DJI (31 MAR 2023)DJI intraday trading alert
3 simple steps to find a quality setup!
Risk Reward Ratio 1:2
Anyone same idea with me?
BUY DJI
Good luck traders...

DOW JONES almost on our target. What's next?Two weeks ago, we gave the most optimal buy entry for Dow Jones (DJI) exactly at the bottom of its 4-month Channel Down:
The price has almost hit our 33100 Target and we think it is time to look into the longer term. We made a case on the idea above that Dow is currently repeating the October - November rally, as the RSI pattern is identical. In addition, that larger pattern could be an Inverse Head and Shoulders, which is a bullish reversal formation, in fact it may be characterized as the bottom formation of the 2022 Bear Phase.
As a result the target can be as high as the Shoulders Resistance, the Higher Highs trend-line. If it is inversely symmetrical to June, we can expect a +12.78% rise. This gives us a target for the next 4-6 weeks at 35400.
-------------------------------------------------------------------------------
** Please LIKE 👍, FOLLOW ✅, SHARE 🙌 and COMMENT ✍ if you enjoy this idea! Also share your ideas and charts in the comments section below! **
-------------------------------------------------------------------------------
💸💸💸💸💸💸
👇 👇 👇 👇 👇 👇

The Case for UnemploymentUnemployment is tricky. You just cannot announce high unemployment. The political damage is too much to take. But unfortunately, the time comes when unemployment just increases...
Every sane person would want the economy to remain calm for as long as possible. This is not sinister or bad.
After all, it is in the duty of Governments and Central Banks to keep our daily lives as calm and peaceful as possible.
Bad unemployment data is inherently bad. It is worse than bad inflation data. So it is always a tricky situation...
After the inflation chaos, calm has return to the financial world. Volatility and inflation is lower, equities are higher! So all is well!
Not only inflation is lower, but also unemployment! With an ultra-low rate of 3.4%. News just couldn't be better!
Initial claims is also breaking down, signaling better days ahead...
After all, low unemployment is good! Right?
Not so fast fella!
Low unemployment is good for, well, employees! But it is bad for corporations! Finding skilled personnel is incredibly hard. So much so, that most companies underperform. They just can't grow!
I believe that unemployment does not necessarily break the economy. And the economy does not necessarily break the unemployment. It is a mixed bag... Sometimes, businesses benefit from high unemployment. If the antagonists fail, others get their workers, and most importantly, the piece of the pie! Some companies grow while others fail...
Believe it or not, low unemployment is risky. Especially when it is in a 54 year low... It just cannot go lower!
Recent unemployment data is perfect. However, Continuous Jobless Claims (USCJC) may give us a new perspective...
It is at times like these when we see conflicting data. Continuous Claims increase while unemployment rate is decreasing.
At that period, the official unemployment rate was making lower lows!
This is deeply concerning. Especially when it is eerily similar to 2020. Perhaps it is a shift of balance right before a crisis.
Perhaps a period when long-term employees lose their jobs since companies attempt to cut down costs. Instead, they hire less skilled workers with lower wages, perhaps for part-time jobs. This may be the last attempt of companies to stay afloat. It is also the last attempt for families to stay afloat. High food prices necessitate work at all costs, no matter how low...
A crisis may be brewing... A Black Swan one, just like 2020.
The Big Tech bubble is literally hollow, full of derivatives aka weapons of mass destruction.
And the scale and the ramifications of such a crisis are still unknown.
(By inflation pressure I mean the amount of work the FED does to fight inflation. While this chart increases, inflation gets out of hand)
Perhaps all of this is meaningless. Only time will tell what will happen... WW3 commence I guess?
Tread lightly, for this is hallowed ground.
-Father Grigori
