DJI

DOW JONES: Ranged until it breaks the 4H MA200 and turns bullishDow Jones remains neutral on the 1D technicals (RSI = 47.239, MACD = -227.510, ADX = 31.577) as the price has been mostly ranging for 2 weeks between the 32,600 Symmetrical Resistance and 31,800 Symmetrical Support.
Todays rejection should give one more pull back to the Symmetrical Support if the 4H MA50 breaks. On the other hand, a full 4H candle closing over the Symmetrical Resistance, will most likely cross over the 4H MA200 too and target long term P1 at 33,450.
Prior idea:
## If you like our free content follow our profile to get more daily ideas. ##
## Comments and likes are greatly appreciated. ##

dow is about to go down againdow was strong for 6moths.
But looks like final bull run is about to over soon.
All governmets are trying to hide the factor of banking crisis.
This systematic problem will lead the great crash soon.
MACD lost its power.

$NDX leads but has had issues in this area beforeBeen away for a week, needed time off. Visited family. Did some light trading, mostly closing closing puts sold as most of them expired worthless = We kept PREMIUM! 🙂
-
Let's see how markets fared.
-
As we expected, $NDX has done decently & has kept retesting the upper boundary hit in February. It's breaking above today. BULLISH if accompanied with volume. As we've stated for months, markets don't act as most believe. They are irrational much of the time.
-
$DJI has not fared as well BUT will LIKELY join #NDX in the upward movement. The issue was 2 #banks on the #DJI. The #DowJones fared much better during the beginning of the year but lost leadership in February.
-
$VIX has stayed in the middle part of the Symmetrical Triangle. Which tends to be the case until as extreme direction ensues. As stated countless times this can stay the case until mid 2024! Most likely not but it can. We believe it will touch the bottom part of the trend, higher probability, before, IF, it hits the top part again.
#stocks #stockmarket #vix

Grbk trending highbuy @ 33-34.
Target 60-70 in 6 month.
this stock is one the few winners in recent corrections.

SPX - DJI - NDX - Going higher after small pullback ?Interest rate decision is in less than 15min and a 25bps hike is expected.
Markets have run ahead of it this week so a small pullback is likely but as long as prices stay above the dotted Invalidation levels, there's nothing to worry and we should resume higher tomorrow probably.
From a risk/reward perspective, I think it's a good idea to look to go long, may it be relatively strong individual names or simply buying the indexes.
It's also a good idea to go for some select names in the crypto space, like BTC, ETH or some newer ones like OP, CFX and VIB.

$VIX has sold off after top call, now what? The $VIX is trading within the symmetrical triangle, still. As mentioned many times over the last year this pattern can take many months to resolve. Long term traders have to be patient until this revolves.
Short and intermediate time frame traders can use the tops and bottoms to implement buys and sells to maximize profit. It's what we've been doing.
At the moment it looks like the bottom part of the trend is calling. Not to pat ourselves in the back, again and again, we did call this to be a volatile year. Don't see a resolution to that until the triangle is broken.

DJI - End of the Grand Super Cycle? Dow Jones wave 5 cycle from 1896 to 2022.
DJI perfectly tags Waves 1-2 and 4, with 3 and 5 being overextended. Wave 3 went to the 200% and Wave 5 went to the 223%.
For those who do not understand Elliott Wave Theory I would recommend reading EWT Principle by Robert R. Prechter Jr.
A controversial issue is whether the severe economic recession accompanying the termination of the current Grand Supercycle will take the form of either a deflationary depression or a hyperinflationary period. Robert Prechter has repeatedly stated that the collapse will take the form of a deflationary depression probably followed by hyperinflation. In an October 2006 interview, when asked to make his case for deflation and the key factors that supported it, Prechter said:
The credit bubble: the fact that we do not have currency inflation as much as we have credit inflation. And credit bubbles have always imploded. The amount of dollars out there that are greenbacks – actual cash – is minuscule compared to the dollar value of credit instruments. So in my view the Fed is utterly powerless to prevent the ultimate deflation of the credit bubble. And some people say, "Well, they can print money." Fine, that would just make the credit bubble collapse faster as soon as bond holders realize that's what they were doing. There's no way out of it. So that's the argument.
Well, the hyperinflation part is a pure guess based on politics. It has nothing to do with reading markets. I think the markets are telegraphing deflation, and I'm very confident about that. Hyperinflation to me is going to be the natural political response. I mean these people in Congress are so irresponsible – except to themselves and their families, of course. They always get re-elected so they're doing that correctly. I mean, it's working for them as individuals but it's not working for the country. Anyway, to save their own skins I think the most likely thing is that they will turn to the Treasury, whether they keep the Federal Reserve System or not, and say, "Let's print, let's get the machines going and print those greenbacks and spread them around."
Happy reading!
Brad

Yellow Brick Road Gold & Orange brick road Bitcoin Through-out the history of finance time decay happens, people forget its human nature.
Federal funds climbs the wall, people panic followed by entering the market causing a return to normal, everything is fine this time is different.
Whats that? the Federal funds start to fall faster than the Berlin wall, this is good right, cheaper effective cash.
As the layoffs rise, the inflation falls, as inflation falls governments can't generate income taxing deflation.
Easy money starts to flow as rates continue to fall, SPY must rise tall!, continues to fall, follow the yellow brick road with Gold, follow the orange brick road with Bitcoin.
Yellow rises fast, orange even faster and more violently! which asset will declare victory?
When the wizard drops the rates, be careful shorting Bitcoin and Gold sometimes reality is hard to understand.
\\ Signing off

DOW JONES Sell the rejection, buy the breakout.Dow Jones is above the MA50 (4h), approaching the Falling Resistance of the February 14 Top.
It also is on the 0.382 Fibonacci level, so a rejection is quite probable.
The long term bottom though is in as the price is rising on a Triple Bottom.
Trading Plan:
1. Sell the Resistance rejection.
2. Buy a break over Fibonacci 0.5 and MA200 (4h).
Targets:
1. 32100 (MA50 (4h)).
2. 33600 (Resistance 1).
Tips:
1. The RSI (4h) is rising steadily on Higher Lows. This shows a sustainable move and serious attempt to break the Falling Resistance this time.
Please like, follow and comment!!
Notes:
This is a continuation of this long term trading plan:

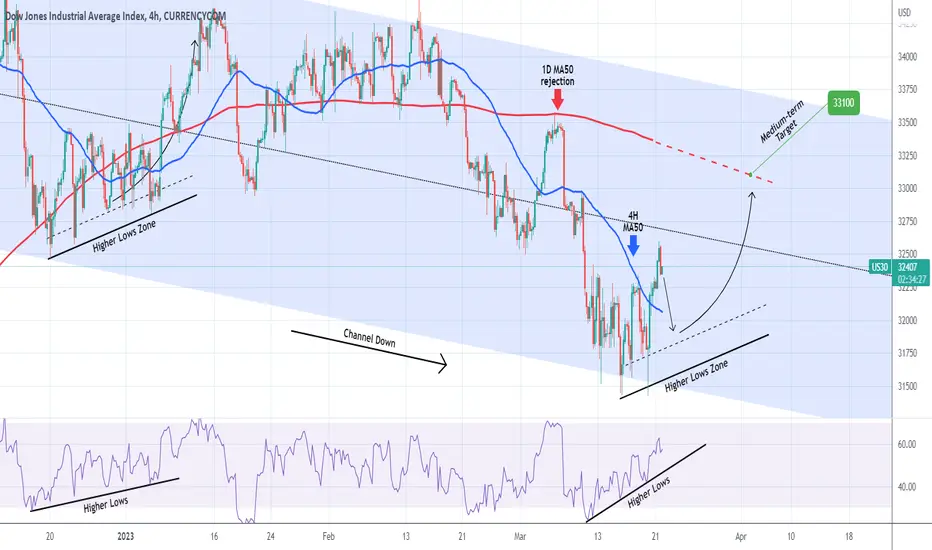
DOW JONES has started the new bullish wave.This is basically to last week's buy signal at the bottom:
As you see Dow Jones (DJI) made a new Lower Low (bottom) on the 4-month Channel Down and broke above the 4H MA50 (blue trend-line) again. The move is supported by a Higher Lows Zone (as is the RSI), similar to the previous Channel Down Low in late December. With the Fed Rate Decision tomorrow always unleashing volatility, we can see one last pull-back and then rebound towards the 1D MA50 (red trend-line) and our 33100 Target.
-------------------------------------------------------------------------------
** Please LIKE 👍, FOLLOW ✅, SHARE 🙌 and COMMENT ✍ if you enjoy this idea! Also share your ideas and charts in the comments section below! **
-------------------------------------------------------------------------------
💸💸💸💸💸💸
👇 👇 👇 👇 👇 👇
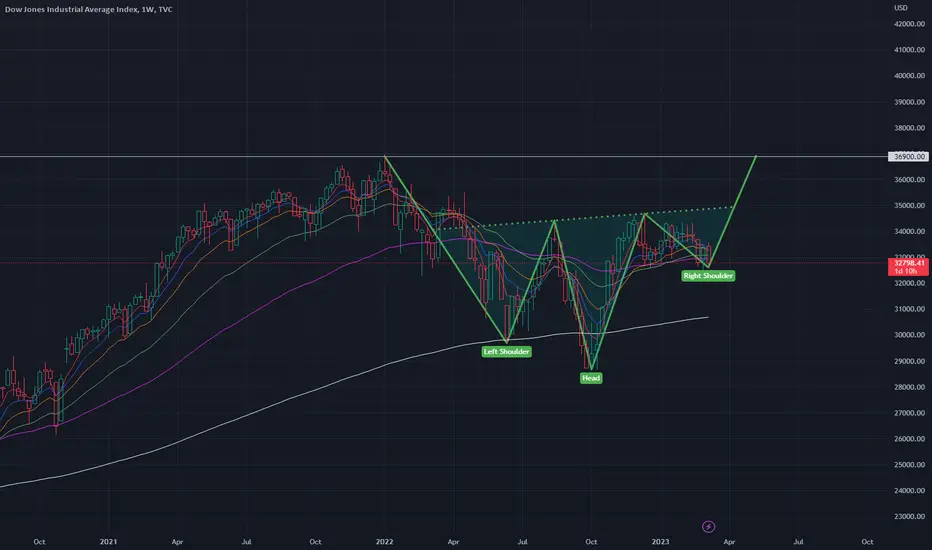
Head and Shoulders Bottom in Dow Jones Dow Jones Industrial Average (DJI) has formed Head and Shoulders bottoming pattern and has broken out of the H&S neckline resistance zone. We can expect a retracement back to the neckline and if buying strength continues, price can meet measured move target of 33300.

DJI May be surprising you and in lower time it looks in the 4th Hey guys can see the moves made by dow jones from 13 march....each leg looking a 3 wave structure....
In my view it is in 4th wave of lower time frame and would show you much deeper levels...
This is not a trade idea but for educational purpose....
abcde patter in formation...!
Regards

forget about the economic dataRecently investors started to care about economic data too much.
Always advanced economic data is making the market, not the current data.
Of course right now is very bearish cycle.
But Dollar is getting weak and Powell is very dovish and stating the disinflation's possibility.
We have to predict May's data not the March's.
Data dependant investing always lead to the failure.
I think the economy will move as what the Fed is wanted now near future.
I see a reversal Head and shoulders pattern from DJI.
I am bullish from now on.
Will explain why market will go upPlease, look at the chart that SPX broke the long term downside trend since this year early-January .
If you see my previous analysis I was very bearish since middle of 2022.
Normally long term down trend reversal last at least 6months.
Upside has shown for 3months now.
I personally belive that one more quarter is left to play bullish further more.
1st. the gold price is holding strongly.
2nd. the copper price is holding strongly.
3rd. goverment yield is falling sharply.
4th. Dollar index is indicating bearish signs now.
I saw lots of positivie signals in 2020 march despite the covid crashing destroyed all equities.
This pattern looks similar now.

DJIAfter a good upward trend, the index shows its inability to continue the upward trend and accumulation in the range of 34600-32500. The evidence indicates that there is no potential force to exit this area and continue the upward trend, and if the price stabilizes below the indicated purple area, we can see a fall to the indicated areas in the coming weeks. TVC:DJI

AW Dow Jones Analysis - How The Next Crisis Will Unfold...In this video I talk about the larger pattern and also what is going on at the highs since March 2020.
I believe we are only months away from a systemic collapse which will be the largest in modern history.
It is my assertion that the move up since 2009 was a Type-2 Expanded Zig-Zag Wave D.
This Wave D is now nearing it's final move within Wave (C) which cannot go above a certain level without breaking an important rule.
I believe that towards the end of the year we are going to see a final all-time-high top which will signify the end of this move.
This whole move up since 2009 was just a bubble however the same can be said about the entire economic system.
I guess it all comes down to relativity, after all we know that without stimulus, the whole system would crumble.
Remember to use Disciplined Money Management Principles to ensure longevity as a trader.
If you don't know the long term pattern shouldn't you be doing your research instead of just following the crowd?
Just remember: I am not a financial adviser; I suggest using this only as a guide. Always do your own research.
***AriasWave is not the same as Elliott Wave so your counts may differ to mine if you happen to use it.***

Dow Jones - DJI 20 March - 24 March Pair : Dow Jones - DJI30
Description :
Impulse Correction Impulse
Break of Structure
Flag Pattern
Bearish Channel in Long Time Frame and Short Time Frame as an Corrective Pattern
Divergence
Completed " 12345 " Impulsive Wave " ABC " Corrective Wave

The Fed's Pivot - What to Expect in the Months Ahead In this video, I explain what to expect in the months ahead, following the Fed's pivot back to monetary easing.
Also, I wanted to make several notes:
When I said that it's almost never better to own derivatives than holding an asset outright, I do realize the importance that derivatives can play with leverage and risk management.
When I said that fear is always highest at the +2 standard deviation of the log-linear regression channel, this was confusing because typically fear is highest when price reaches the -2 standard deviation. In this particular ratio chart, fear over the Grayscale Bitcoin Trust was highest when Bitcoin outperformed it enough for the BTC/GBTC ratio to reach the +2 standard deviation.
When I said that the log-linear regression channel is one of the best indicators, I do realize that compared to other statistical methods, this indicator is quite rudimentary. Nonetheless, I find it to be quite useful.
I apologize for the poor audio, this seems to be a matter of how TradingView is uploading my audio. On my end, my audio is very clear.
Important Disclaimer
Nothing in this post should be considered financial advice. Trading and investing always involve risks and one should carefully review all such risks before making a trade or investment decision. Do not buy or sell any security based on anything in this post. Please consult with a financial advisor before making any financial decisions. This post is for educational purposes only.

DOW JONES: Rejection on the 4H MA50 keeping it neutralDow Jones found Support on the S1 Zone as we called last week (see idea at the end) and closed 4 straight candles inside it. The 1D time-frame remains technically red (RSI = 37.784, MACD = -381.660, ADX = 48.656) and the rejection on the 4H MA50 is keeping the price at bay. This appears to be like the rejection on December 21st 2022, which kept the price inside an Ascending Triangle before a rise to the top of the Channel Down. We will maintain our bullish persctive within this patternand target P1 (TP = 33,450).
Prior call:
## If you like our free content follow our profile to get more daily ideas. ##
## Comments and likes are greatly appreciated. ##

DJI Crash RSI PatternFrom a study last year identifying RSI patterns during major market crashes.
All hypothetical but I saw an interview today where someone said they were confident all is fine, saying banks are "too big to fail". Let's hope so.
Best, Hard Forky

$NDX looks good, better than $DJIRecently we made a post on how $NDX would outperform $DJI being it lacked #banks & #oil & it has done this.
As we have stated for some time, we're still CAUTIOUS BULL on the #stockmarket. Even after this latest fiasco.
CAUTIOUS is the key word.
Daily $NDX broke channel to upside AND longer term downtrend!!!!!!!!!!!!!!!!!!!!
Weekly chart shows #NDX holding above the weekly moving avg's & there was a bullish moving avg crossover, yellow circle, & has held.
12900 is an important level for #NASDAQ 100. Breaks that 13700 is next target.
$DJI looks okay. It held well until recently. It is close to forming a bearish crossover but we'll see. IMO likely not. While #DJI is much weaker as a whole cherry picking individual #stocks on the index should be okay. We stated $MSFT $AAPL have done well & newbie $AMGN & $VZ for yield.
#msft #aapl #amgn #VZ

DJI - World's End Scenario - short to 200 MMARevisiting this scenario where 1929 style crash fractal is overlayed with current market structure.
It was just an excercise and not a prediction but having reviewed the data again and considered Robert Prechter's Fibonacci predictions about the end of Super Cycle wave 5 I am giving it another chance with a speculative short.
The short initiate at break of support and will initially act as a hedge to target the 200 Monthly MA / $18k (50% drawdown). Stop at $35,500 (3%)
Best, Hard Forky
The scenario set out last year with some minor corrections breaks down as follows:
- Monthly Chart, 200 Monthly MA
- Crash time frame in 1929 to 1932 lasted about 3 years - Today I would estimate this as 10 year period based on the fractal .
Interesting outcomes from the experiment assuming the DJI has topped:
- DRAWDOWN: 1929-1932 drawdown was 90% setting market back 14 years. From Point A to C, this will take us to $3,500. That sets us back by 25 years (no clear correlation).
- FRACTAL: The fractal is close to the present day formation assuming the DJI has topped out (close correlation).
- MA: The MA is pacing at a relatively similar trajectory - from the touch in 2009 to today's position at $18,000. Coincidently $18,000 is the bottom of the March 2020 crash at point B. (Interesting coincidence)
- SUPPORT: The immediate crash period from point A to Point B would take place around (correction) Feb/March 23
- BEARISH DIVERGENCE : The RSI structure is very similar on lead up and localised formation, (correction) with an uptick in RSI on the retrace. In 2020 we had the covid pandemic which delivered the recent low point on the RSI but the 1929 has the same structure, just a more stable price. Can we trust the 1929 data? (coincidence)
- TRADING: Whilst a crash of this magnitude would require some form of major catalyst destroying a generation of wealth, it offers amazing trading conditions both long and short for swing traders on longer timeframes. There are about 6 swing long opportunities during the 10 year crash, each lasting over 1 year and offering 40-50% upside
Is it likely, of course not. It's only happened once in a century :)
Is it possible, well it has happened before :)
... hmm, that bearish divergence don't look good... it might be time to look at shorts again?
Best, Hard Forky
DJI - World's End Scenario
