DJI Potential For Bullish ContinuationLooking at the H4 chart, my overall bias for DJI is bullish due to the current price being above the Ichimoku cloud , indicating a bullish market. Price has tapped into my buy entry at 33418.59, where the 23.6% Fibonacci line is. Stop loss will be at 32581.97, where the recent low is. Take profit will be at 34595.51, where the recent swing high is.
Please be advised that the information presented on TradingView is provided to Vantage (‘Vantage Global Limited’, ‘we’) by a third-party provider (‘Everest Fortune Group’). Please be reminded that you are solely responsible for the trading decisions on your account. There is a very high degree of risk involved in trading. Any information and/or content is intended entirely for research, educational and informational purposes only and does not constitute investment or consultation advice or investment strategy. The information is not tailored to the investment needs of any specific person and therefore does not involve a consideration of any of the investment objectives, financial situation or needs of any viewer that may receive it. Kindly also note that past performance is not a reliable indicator of future results. Actual results may differ materially from those anticipated in forward-looking or past performance statements. We assume no liability as to the accuracy or completeness of any of the information and/or content provided herein and the Company cannot be held responsible for any omission, mistake nor for any loss or damage including without limitation to any loss of profit which may arise from reliance on any information supplied by Everest Fortune Group.
DJI

DOW JONES On familiar 1W MA50 Support, ready for a +50% rally.The Dow Jones Industrial Average (DJI) has been holding the 1W MA50 (blue trend-line) as Support, closing all weekly candles above it since November 07 2022. This on its own is a major bullish pattern, but if we look on a much long-term, decade long perspective, we can see an even higher significance it historically has on the price action.
As you see on this 1W time-frame, ever since Dow's recovery from the 2008/09 Housing Crisis and the first touch of the 1W MA200 (orange trend-line) on August 2011, every time it bounces and recovers the 1W MA50, holding it as Support (blue circles), the index has grown from that bottom to the next top a minimum of +50% (with 55% of January 2018 being the maximum).
At the same time, the 1W RSI breaks above a Lower Highs trend-line. This time the RSI broke and even held and bounced off that Lower Highs trend-line (green arrow).
This chart shows that Dow Jones is no stranger to this pattern and technically, as long as the 1W MA50 holds, we should be treating it as a major bullish signal. A potential new +50% 2-3 year rally puts the target at 49000.
-------------------------------------------------------------------------------
** Please LIKE 👍, FOLLOW ✅, SHARE 🙌 and COMMENT ✍ if you enjoy this idea! Also share your ideas and charts in the comments section below! **
-------------------------------------------------------------------------------
💸💸💸💸💸💸
👇 👇 👇 👇 👇 👇

$DJI leading the pack & Bear close to be done🚨🚨🚨🚨🚨🚨🚨
Not sure how this was missed!😱
$DJI looks VERY VERY VERY good
Went FULL BULL late Sept/early Oct
Mid Nov went neutral to short term bear
Mid December turned cautious bull
NOW
GOOD signs that September was BOTTOM!
-
This is daily & weekly
Inverse head & shoulder pattern = 1 of the best bottom forming patterns
IF right shoulder forms here = HUGE
We've spoken on light blue box area many times
Weekly $DJIA still looks GREAT
-
BONUS
$DJI monthly almost gave up BUT HELD
Did trade below the avg's but fought back
NO Bearish moving avg crossover
$DJIA movement can buy more time
Maybe year or 2
RSI looks ok
$DIA $UDOW $SDOW #stocks

$NDX means risk coming to playCopy post & continuation from posts not done here
Letting trades sit for moment
Called #risk coming, $NDX vs $DJI
#NDX almost 4x the performance today
NOT SAYING it's "over" but risk reward = GREAT #Bullish
For Friday volume was GOOD
Overall buying coming in last few days
Still like value but have lots of $TQQQ
#stocks
Hard to post all we write here, sorry!

DJI Potential For Bullish ContinuationLooking at the H4 chart, my overall bias for DJI is bullish due to the current price being above the Ichimoku cloud, indicating a bullish market. Looking for a buy entry at 33418.59, where the 23.6% Fibonacci line is. Stop loss will be at 32581.97, where the recent low is. Take profit will be at 34595.51, where the recent swing high is.
Please be advised that the information presented on TradingView is provided to Vantage (‘Vantage Global Limited’, ‘we’) by a third-party provider (‘Everest Fortune Group’). Please be reminded that you are solely responsible for the trading decisions on your account. There is a very high degree of risk involved in trading. Any information and/or content is intended entirely for research, educational and informational purposes only and does not constitute investment or consultation advice or investment strategy. The information is not tailored to the investment needs of any specific person and therefore does not involve a consideration of any of the investment objectives, financial situation or needs of any viewer that may receive it. Kindly also note that past performance is not a reliable indicator of future results. Actual results may differ materially from those anticipated in forward-looking or past performance statements. We assume no liability as to the accuracy or completeness of any of the information and/or content provided herein and the Company cannot be held responsible for any omission, mistake nor for any loss or damage including without limitation to any loss of profit which may arise from reliance on any information supplied by Everest Fortune Group.

DJI Open Long (eng) Hello Friends.
Unfortunately, the final way down did not wait
A big player closed his short position and got a new one in the range of 32800-33200.
Yesterday before the close of trading fixed the volume impulse in the market, which finally signaled a trend reversal
Forced to close the Short position at -2.57% from 32840.
Opened Long from 33680
From 06.01.2023 20:12 (GMT)
The arrow shows only the direction of the open trade - without the final target
I'm a bit upset that the deal spoiled the statistics of my analysis method
But this case only confirms the correctness of my approach
Now the statistics is represented by 9 positive trades and 1 negative
or 64.88% profit for the period from 08.07.2021
Thank you all for attention and have a nice trade in the New Year!

DJI, NQ and S&P : 30% DropRevisiting the upward trendline as of 2008 for both DJI, NQ and S&P would result in a 30% drop from current price levels.
These levels coincide with the Covid19 lows.

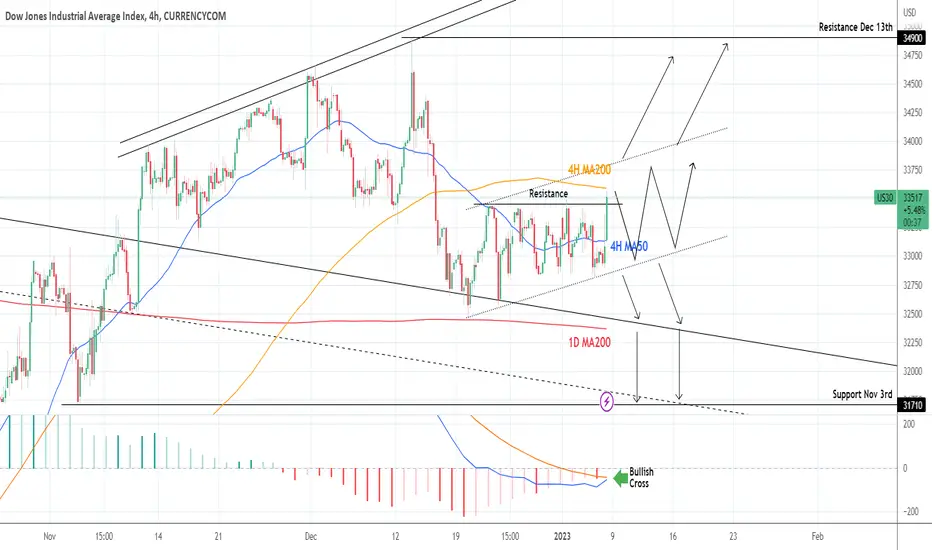
DOW JONES: Testing the 4H MA200 for the 1st time in 3 weeksDow Jones broke today the 33,460 - 33,500 Resistance Zone that was intact since December 22nd. At the moment it is attempting a test of the 4H MA200, the first since December 15th. Trading within a Channel Up and with 4H technicals bullish (RSI = 62.540, MACD = 15.660, ADX = 24.447) while the 1D MACD is about to make a Bullish Cross, we expect a strong bullish trend if the price breaks and closes above the 4H MA200, with 34,900 (December 13th Resistance) the Target. Preferably we would like to see a break above the Channel Up as well.
A break below the Channel Up will be a short-term sell opportunity with the 1D MA200 as the target, while further break below it, will target the 31,710 Support (November 3rd).
## If you like our free content follow our profile to get more daily ideas. ##
## Comments and likes are greatly appreciated. ##
## Also DONATIONS through TradingView coins help our cause of increasing the daily ideas put here for free and reach out more traders like you. ##
US30 Liquidity on bot sides of range. When will it dissolve?The tight range serves for alot of stop losses above and under both these key levels.
One side will get taken first, and probably serve as a trap, after which we see a reversal to the actual direction.
(my bias is currently to the downside as the final direction due to fundamentals and broader trend(s))
Although I by no means recommend trading off my bias or trading off this idea at all, especially if you're unfamiliar with the ideas put forth.
The red line should also not be seen as a prediction, merely as a drawing to indicate what I mean by reversal to actual direction with my bias.
It could just aswell take bottom-side liquidity first and then run to the upside.
Don't predict, react.

No Christmas rally this year - new lows are aheadOld target 3392 (pre-Covid high) is in play by EoY/1st week of Jan '23

Dow, potential Sell oportunity!DJ1 Index - The Dow
Weakness likely on the asset, sell idea!
Heed your DD!

CF Industries Holding Analyze!!!🌿CF Industries Holdings, Inc. is an American manufacturer and distributor of agricultural fertilizers, including ammonia, urea, and ammonium nitrate products, based in Deerfield, Illinois, a suburb of Chicago. It was founded in 1946 as the Central Farmers Fertilizer Company.
After growth of about 500%😱 in the last two years, CF Industries Holding has finally exited its ascending channel.
I expect CF Industries Holding to decline to the minimum support zone (about 15% down).
🔅CF Industries Holding Analyze ( CFUSD ) Timeframe 2Days⏰.
Do not forget to put Stop loss for your positions (For every position you want to open).
Please follow your strategy, this is just my idea, and I will be glad to see your ideas in this post.
Please do not forget the ✅' like '✅ button 🙏😊 & Share it with your friends; thanks, and Trade safe.

DJI Potential For Bearish ContinuationLooking at the H4 chart, my overall bias for DJI is bearish due to the current price being below the Ichimoku cloud, indicating a bearish market. Looking for a sell entry at 33462.65, where the 38.2% Fibonacci line is to clear out the liquidity hotspot. Stop loss will be at 34243.87, where the 78.6% Fibonacci line is. I am looking to take profit at 32485.23, where the previous lows and liquidity lies.
Please be advised that the information presented on TradingView is provided to Vantage (‘Vantage Global Limited’, ‘we’) by a third-party provider (‘Everest Fortune Group’). Please be reminded that you are solely responsible for the trading decisions on your account. There is a very high degree of risk involved in trading. Any information and/or content is intended entirely for research, educational and informational purposes only and does not constitute investment or consultation advice or investment strategy. The information is not tailored to the investment needs of any specific person and therefore does not involve a consideration of any of the investment objectives, financial situation or needs of any viewer that may receive it. Kindly also note that past performance is not a reliable indicator of future results. Actual results may differ materially from those anticipated in forward-looking or past performance statements. We assume no liability as to the accuracy or completeness of any of the information and/or content provided herein and the Company cannot be held responsible for any omission, mistake nor for any loss or damage including without limitation to any loss of profit which may arise from reliance on any information supplied by Everest Fortune Group.

Will the dollar continue to plummet in 2023? Plus, a look at...Traders,
Happy New Year! It's been a terrible year for crypto, the markets, and the global macroeconomic environment. But the good news is that I believe we have left most of the negative declines behind us ...at least for a bit.
So, in this video, I'm going to look at what I see in 2023 for the U.S. dollar, the housing market, Bitcoin dominance, the stock markets (DJI, SPY, Nasdaq), and more.
Stew


DOW JONES Critical session tomorrowThe Dow Jones Industrial Average (DJI) remains within the medium-term Triangle pattern that is trading since December 16 and broke today above both the 1D MA50 (blue trend-line) and 4H MA100 (green trend-line). The two have formed a Bearish Cross and the last two times this pattern emerged was on September 12 and May 04, both Lower High rejections that led to new market Lows.
The 1D RSI pattern however shows that we may already be on a market Low and if we close a 2nd straight green 1D candle (tomorrow), it invalidates all prior bearish bias. In that case, we will target again the 34300 Resistance (August 16 High) and the 34910 Resistance (December 13 High).
The index turns bearish if it breaks below the 1D MA200 (orange trend-line), which made a perfect bounce on December 20. In that case we will target 31725 (Support 1) on the short and 30100 (Support 2) on the long-term.
-------------------------------------------------------------------------------
** Please LIKE 👍, FOLLOW ✅, SHARE 🙌 and COMMENT ✍ if you enjoy this idea! Also share your ideas and charts in the comments section below! This is best way to keep it relevant, support me, keep the content here free and allow the idea to reach as many people as possible. **
-------------------------------------------------------------------------------
You may also TELL ME 🙋♀️🙋♂️ in the comments section which symbol you want me to analyze next and on which time-frame. The one with the most posts will be published tomorrow! 👏🎁
-------------------------------------------------------------------------------
💸💸💸💸💸💸
👇 👇 👇 👇 👇 👇


DJI 4H Short term looking like it is going to turn bearishAs above.
Rally fading with obvious RSI divergence on the 4Hr chart. Will Follow.
Good Luck traders!

BA Simple Chart AnalysisBA - Resistance 195 & 229 area. Support 172 area. Red chip does appear aggressive here. Since China had already open their border, individual can look into it.
How to view the guidance via chart ( Refer back to pin message guidance if to trade )
Red Line = Support
Blue Line = Resistance
Light Blue = bullish/bearish pattern
Arrow = Double/Trip top/bottom
Red Chip = $$
Green Chip = XX

$VIX in middle of pattern2 From $DJI recent post
While most media & people ARE RIGHT, they tagged along @ end, too much neg
I'm contrarian, this much negativity raises flags, especially when media 24/7
Still think $VIX #VIX in between pattern gives opportunity for swings before the eventual breakout
#stocks #crypto

$DJI & lagging $SPX & $NDX - in decent positionsWe're NEUTRAL but with drop of cautious bull
Messed up another other post :)
Why cautious bull?
We've been warning since late Oct 21, were RIGHT
Went bull few times #stocks & #crypto but overall, BEAR
Sept 22 noticed shift
Mid Oct early Nov we went FULL BULL, till recently
This was part of a few posts
See $VIX next post

S&P trend lines to watch in the new yearAnother big picture view like my idea on the NASDAQ. Right now, it looks like on the monthly that the S&P has been testing the the purple trend line, but no success. From the looks of it, there is still a good size drop to come down to at least the bottom of the blue channel ($350) to test previous low, maybe even the center line of the purple channel around $325. Let's hope that holds, because if the dot com crash or the financial crisis repeat, then we could still fall all the way down to $240 range.
Weekly with 20 and 200 SMA
Daily with 20 and 200 SMA

DJI supply and demand levelsin 4h timeframe, we could consider 31730 to 34700 distributed range with some fakeouts.
