Dow Jones: Explosive US30 Trade Setup – Entry,Trap & Exit Mapped💎 Dow Jones Robbery Blueprint: The US30 Vault Crack Plan 💎
(Maximized for reach — within TradingView title limit)
🌟Hi! Hola! Ola! Bonjour! Hallo! Marhaba!🌟
Dear Market Robbers & Money Movers 🕵️♂️💰🚨
This ain't your average analysis — it’s a Thief Trader-style 🔥tactical mission🔥 aimed at the mighty "US30/DJI" (Dow Jones Industrial Average). We're talkin' about a precision heist with a full blueprint: entry zones, trap setups, and escape exits. Read carefully — this ain’t for the faint-hearted traders! 🧠🦾
🧠 Entry Zones (The Break-In) 📈
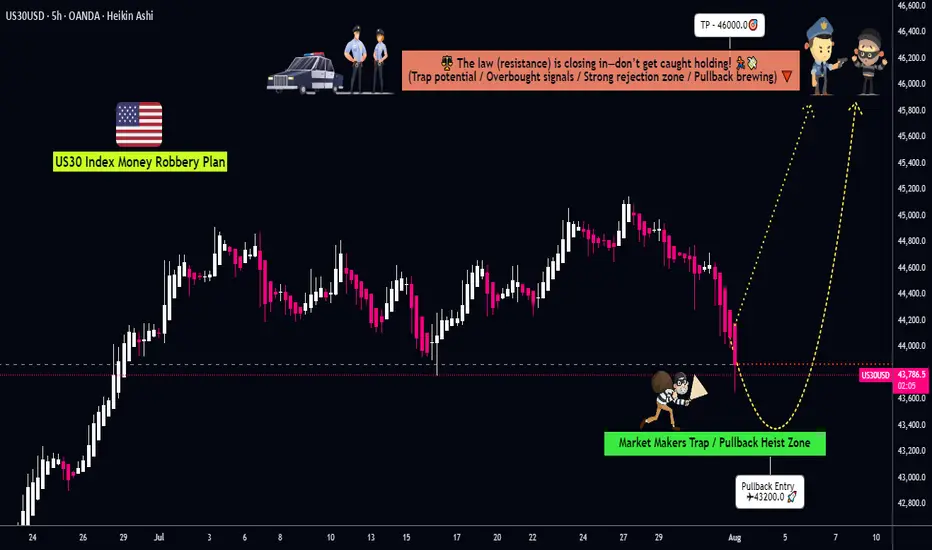
🛠 ENTRY 1: Candle wick near 44200.0 – that’s the resistance gate. Wait for confirmation.
🎯 ENTRY 2: Sneak in at the Market Makers’ Trap around 43200.00 – a dirty zone where retailers get baited. Perfect time to strike long!
🧱 DCA/Layering strategy recommended. Stack those buy orders like a thief layering explosives on a safe. 💣💸
🛑 Risk Levels (Escape Routes/Stop Loss)
🔊 "Listen up, vault raiders! Never drop your SL until breakout is confirmed. If you jump early, you might land in a bear trap! 🪤"
🔐 Stop Zones (Based on Strategy):
🔐 Max Risk SL (5H TF): If you're deep, your last stand is at 43000.0
☝️ SL depends on your position sizing, number of entries, and risk appetite. Trade like a thief, not a gambler.
🎯 Heist Target (Profit Exit)
🏁 Escape Point: 46000.0 — or exit before heat rises! Don’t be greedy. Rob and vanish. 💨💰
🔥 Market Mood: Why the Heist Is On
"US30/DJI" is bullish AF — thanks to:
📊 Macro-Economic Wind at Our Back
📈 Institutional momentum
📰 Strong sentiment and intermarket flows
Check your chart radar: Fundamentals + technicals aligning = green light for robbery! 🟢
⚠️ Tactical Reminder: News Can Jam the Plan
📵 Avoid new entries during major economic releases
🛡 Use trailing SLs to protect running trades
Stay alert, stay alive. 💡
❤️ Support the Robbery Crew
Hit that 💥BOOST💥 — your love fuels our next mission.
Join us and ride daily heist plans with Thief Trading Style 🏴☠️🚀💰
Dji30
US30 Robbery Blueprint: Breakout, Pullback, Escape Setup💎 Dow Jones Robbery Blueprint: The US30 Vault Crack Plan 💎
(Maximized for reach — within TradingView title limit)
🌟Hi! Hola! Ola! Bonjour! Hallo! Marhaba!🌟
Dear Market Robbers & Money Movers 🕵️♂️💰🚨
This ain't your average analysis — it’s a Thief Trader-style 🔥tactical mission🔥 aimed at the mighty "US30/DJI" (Dow Jones Industrial Average). We're talkin' about a precision heist with a full blueprint: entry zones, trap setups, and escape exits. Read carefully — this ain’t for the faint-hearted traders! 🧠🦾
🧠 Entry Zones (The Break-In) 📈
🛠 ENTRY 1: Crack the wall near 44700.00 – that’s the resistance gate. Wait for confirmation.
🎯 ENTRY 2: Sneak in at the Market Makers’ Trap around 43500.00 – a dirty zone where retailers get baited. Perfect time to strike long!
🧱 DCA/Layering strategy recommended. Stack those buy orders like a thief layering explosives on a safe. 💣💸
🛑 Risk Levels (Escape Routes/Stop Loss)
🔊 "Listen up, vault raiders! Never drop your SL until breakout is confirmed. If you jump early, you might land in a bear trap! 🪤"
🔐 Stop Zones (Based on Strategy):
📌 Swing Buy SL (2H TF): Place at 44100.00 for the stealth buy.
🏦 Institutional SL (Swing Zone): Drop it around 43000.00
🔐 Max Risk SL (3H TF): If you're deep, your last stand is at 39200.00
☝️ SL depends on your position sizing, number of entries, and risk appetite. Trade like a thief, not a gambler.
🎯 Heist Target (Profit Exit)
🏁 Escape Point: 46200.00 — or exit before heat rises! Don’t be greedy. Rob and vanish. 💨💰
🔥 Market Mood: Why the Heist Is On
"US30/DJI" is bullish AF — thanks to:
📊 Macro-Economic Wind at Our Back
📈 Institutional momentum
📰 Strong sentiment and intermarket flows
Check your chart radar: Fundamentals + technicals aligning = green light for robbery! 🟢
⚠️ Tactical Reminder: News Can Jam the Plan
📵 Avoid new entries during major economic releases
🛡 Use trailing SLs to protect running trades
Stay alert, stay alive. 💡
❤️ Support the Robbery Crew
Hit that 💥BOOST💥 — your love fuels our next mission.
Join us and ride daily heist plans with Thief Trading Style 🏴☠️🚀💰

Market Heist in Progress! US30/DJI Long Trade – Ride or Escape?🔥 "The US30/DJI Heist: Bullish Loot & Escape Before the Trap!" 🔥
🌟 Hi! Hola! Ola! Bonjour! Hallo! Marhaba! 🌟
Dear Money Makers & Market Robbers, 🤑💰💸✈️
Based on the 🔥Thief Trading Style🔥 (technical + fundamental analysis), here’s our master plan to heist the US30/DJI (Dow Jones Industrial Average). Follow the strategy on the chart—long entry is the play! Aim to escape near the high-risk RED Zone (overbought, consolidation, potential reversal). The bears are lurking, so take profits and treat yourself—you’ve earned it! 💪🏆🎉
🚀Entry (The Vault is Open!)
"Swipe the bullish loot at any price!"
For precision, place buy limit orders within 15-30min timeframe (recent swing lows/highs).
Set alerts! Don’t miss the heist.
🛑 Stop Loss (Safety Net)
Thief-style SL at nearest swing low (3H timeframe) → 41,400 (adjust based on risk/lot size).
🏴☠️ Target 🎯: 44,200.00
Bullish momentum is fueling this heist—ride the wave but exit before the trap!
📰 Fundamental Backing (Why This Heist Works)
Macroeconomic trends, COT data, geopolitics, and sentiment align for bullish moves.
Full analysis? Check our bio0 linkk! 👉🔗🌎
⚠️ Trading Alerts (News & Risk Mgmt)
Avoid new trades during high-impact news (volatility = danger).
Use trailing stops to lock profits and dodge sudden reversals.
💥 Boost This Heist!
Hit 👍 (Boost Button) to strengthen our robbery squad!
More heists = More profits—stay tuned for the next steal! 🚀🤑
See you soon, fellow thieves! 🤝🎉

Surprising ups and downs in global indicesJune brought contrasting moves across global stock markets: while the U.S. and Asia posted gains, Europe struggled under pressure. Rising tensions between Iran and Israel, political instability in the EU, and shifting rate expectations fueled volatility. In search of stability, investors turned to U.S. tech and exporters — pushing the S&P 500 (#SP500) and Nasdaq 100 (#NQ100) higher.
Key market movers in June:
• #SP500 (+0.96%), Dow Jones (#DJI30) (+0.89%), #NQ100 (+0.94%) – buoyed by dovish Fed tone and Iran’s restrained response to U.S. strikes. #Tesla surged 8.2%, with #IBM also among top gainers.
• Hong Kong 50 (#HSI) (+3%) – lifted by strong retail data and hopes of new stimulus from China.
• Australia 200 (#ASX) (+1.25%) – boosted by RBA rate cut expectations and strong tech sector performance.
• France 40 (#CAC40) (–2.76%) – weighed down by political risks and weakness in luxury stocks.
• Europe 50 (#ESTX50) (–1.8%) – hurt by soft ECB tone and weaker business activity.
• DAX 30 (#DAX30) (–3%) – pressured by weak industrial data and fading Chinese demand.
S&P 500 and Nasdaq 100 continue to rise on solid macro data, a softer Fed stance, and strong earnings from major tech players. Analysts at FreshForex believe investor confidence in the U.S. recovery supports the ongoing bullish trend.

"US30/DJI" Index Market Bullish Robbery (Swing Trade Plan)🌟Hi! Hola! Ola! Bonjour! Hallo! Marhaba!🌟
Dear Money Makers & Robbers, 🤑 💰💸✈️
Based on 🔥Thief Trading style technical and fundamental analysis🔥, here is our master plan to heist the "US30/DJI" Index Market Heist. Please adhere to the strategy I've outlined in the chart, which emphasizes long entry. Our aim is to escape near the high-risk YELLOW MA Zone. It's a Risky level, overbought market, consolidation, trend reversal, trap at the level where traders and bearish robbers are stronger. 🏆💸"Take profit and treat yourself, traders. You deserve it!💪🏆🎉
Entry 📈 : "The vault is wide open! Swipe the Bullish loot at any price - the heist is on!
however I advise to Place buy limit orders within a 15 or 30 minute timeframe most recent or swing, low or high level. I Highly recommended you to put alert in your chart.
Stop Loss 🛑:
Thief SL placed at the Nearest / Swing low level Using the 3H timeframe (39200) Day/Swing trade basis.
SL is based on your risk of the trade, lot size and how many multiple orders you have to take.
🏴☠️Target 🎯: 42400
💰💵💸"US30/DJI" Index Money Heist Plan is currently experiencing a bullishness,., driven by several key factors. .☝☝☝
📰🗞️Get & Read the Fundamental, Macro Economics, COT Report, Geopolitical and News Analysis, Sentimental Outlook, Intermarket Analysis, Index-Specific Analysis, Future trend targets with Overall outlook score... go ahead to check 👉👉👉🔗🔗🌎🌏🗺
⚠️Trading Alert : News Releases and Position Management 📰🗞️🚫🚏
As a reminder, news releases can have a significant impact on market prices and volatility. To minimize potential losses and protect your running positions,
we recommend the following:
Avoid taking new trades during news releases
Use trailing stop-loss orders to protect your running positions and lock in profits
💖Supporting our robbery plan 💥Hit the Boost Button💥 will enable us to effortlessly make and steal money 💰💵. Boost the strength of our robbery team. Every day in this market make money with ease by using the Thief Trading Style.🏆💪🤝❤️🎉🚀
I'll see you soon with another heist plan, so stay tuned 🤑🐱👤🤗🤩

"US30 Heist Alert: Thief Style's Bullish Plan to Steal Profits!"🌟 Salut! Ciao! Hola! Konnichiwa! 🌟
Dear Wealth Raiders & Market Bandits, 🤑💰✈️
Here’s our slick *Thief Trading Style* heist plan for the **US30 / Dow Jones Industrial Average Cash** Index, crafted with sharp technicals and fundamentals. 💥 Stick to the chart’s long entry strategy and aim to slip out near the spicy Yellow ATR Zone—a risky, overbought level where bears and traps lurk. 🏆💸 *Grab profits and treat yourself, you’ve earned it!* 💪🎉
**Entry 📈**: The heist kicks off! Watch for a breakout above the MA line (42600.0) to jump in—bullish riches await! 🤑 Set *buy stop orders* above the MA or *buy limit orders* near the most recent 15/30-min swing low/high for pullback entries. 🚨 Set an *alert* to catch the breakout signal!
**Stop Loss 🛑**: Yo, thieves, listen up! 🗣️ For buy stop orders, hold off on placing that stop loss until the breakout confirms. 🔊 Place it at the 8H recent/swing low (40850.0) for day/swing trades. Adjust SL based on your risk, lot size, and number of orders. Play it smart, or it’s your loot on the line! ⚠️🔥
**Target 🎯**: Aim for 44500.0 or bail before the target hits. 🏴☠️
**Scalpers, eyes here 👀**: Stick to long-side scalps. Big bankrolls can dive in; smaller ones, join the swing trade heist. Use *trailing SL* to lock in your haul. 💰
💸 **US30 Market Heist Outlook**: The index is neutral but leaning bullish, fueled by key drivers. ☝ Check the fundamentals, macroeconomics, COT reports, geopolitics, sentiment, intermarket analysis, and future trend targets for the full score. 🌎🔗
⚠️ **Trading Alert: News & Position Management** 📰🚫
News can shake the market hard. To protect your loot:
- Skip new trades during news releases.
- Use trailing stop-loss orders to secure running profits.
💖 Boost our heist plan! 🚀 Hit that *Boost Button* to power up our robbery squad. With *Thief Trading Style*, we’re snatching profits daily. 🏆🤝 Stay sharp for the next heist plan! 🤑🐱👤🤩
---
### Latest Real-Time Data (UTC+1, May 16, 2025) 📊
*Data sourced from reliable platforms like Financial Juice and official market feeds.*
**Indices** 📈
- US30 (Dow Jones): 42580.0 | +0.18% 😊
- S&P 500: 5720.5 | +0.12% 😄
- NASDAQ 100: 20150.2 | +0.25% 😊
- FTSE 100: 8250.3 | -0.05% 😐
---
### Latest COT Data (Updated Friday, May 9, 2025) 📑
*Commitment of Traders (COT) report for US30/Dow Jones futures, sourced from CFTC.*
- **Non-Commercial (Speculators)**:
- Long: 45,200 contracts | +2,500 😄
- Short: 38,900 contracts | -1,200 😊
- Net Position: +6,300 (Bullish bias) 🟢
- **Commercial (Hedgers)**:
- Long: 82,500 contracts | -1,000 😐
- Short: 90,700 contracts | +800 😐
- Net Position: -8,200 (Bearish hedge) 🔴
- **Open Interest**: 165,400 contracts | +1,200 😊
- **Key Insight**: Speculators are increasing bullish bets, while hedgers lean bearish, signaling potential volatility near resistance levels like the Yellow ATR Zone. ⚠️
---
💥 Join the *Thief Trading* crew, boost the plan, and let’s raid the markets together! 🤑🚀

"US30/DJI30" Index CFD Market Heist Plan (Scalping/Day Trade)🌟Hi! Hola! Ola! Bonjour! Hallo! Marhaba!🌟
Dear Money Makers & Robbers, 🤑 💰💸✈️
Based on 🔥Thief Trading style technical and fundamental analysis🔥, here is our master plan to heist the "US30/DJI30" Index CFD Market. Please adhere to the strategy I've outlined in the chart, which emphasizes long entry. Our aim is to escape near the high-risk MA Zone. Risky level, overbought market, consolidation, trend reversal, trap at the level where traders and bearish robbers are stronger. 🏆💸"Take profit and treat yourself, traders. You deserve it!💪🏆🎉
Entry 📈 : "The heist is on! Wait for the MA breakout (40800) then make your move - Bullish profits await!"
however I advise to Place Buy stop orders above the Moving average (or) Place buy limit orders within a 15 or 30 minute timeframe most recent or swing, low or high level for Pullback entries.
📌I strongly advise you to set an "alert (Alarm)" on your chart so you can see when the breakout entry occurs.
Stop Loss 🛑: "🔊 Yo, listen up! 🗣️ If you're lookin' to get in on a buy stop order, don't even think about settin' that stop loss till after the breakout 🚀. You feel me? Now, if you're smart, you'll place that stop loss where I told you to 📍, but if you're a rebel, you can put it wherever you like 🤪 - just don't say I didn't warn you ⚠️. You're playin' with fire 🔥, and it's your risk, not mine 👊."
📍 Thief SL placed at the recent/swing low level Using the 1H timeframe (39200) Day trade basis.
📍 SL is based on your risk of the trade, lot size and how many multiple orders you have to take.
🏴☠️Target 🎯: 42700 (or) Escape Before the Target
🧲Scalpers, take note 👀 : only scalp on the Long side. If you have a lot of money, you can go straight away; if not, you can join swing traders and carry out the robbery plan. Use trailing SL to safeguard your money 💰.
💰💵💴💸"US30/DJI30" Index CFD Market Heist Plan (Day / Scalping Trade) is currently experiencing a bullishness🐂.., driven by several key factors.👇👇👇
📰🗞️Get & Read the Fundamental, Macro, COT Report, Quantitative Analysis, Sentimental Outlook, Intermarket Analysis, Future trend targets... go ahead to check 👉👉👉🔗🔗
⚠️Trading Alert : News Releases and Position Management 📰 🗞️ 🚫🚏
As a reminder, news releases can have a significant impact on market prices and volatility. To minimize potential losses and protect your running positions,
we recommend the following:
Avoid taking new trades during news releases
Use trailing stop-loss orders to protect your running positions and lock in profits
💖Supporting our robbery plan 💥Hit the Boost Button💥 will enable us to effortlessly make and steal money 💰💵. Boost the strength of our robbery team. Every day in this market make money with ease by using the Thief Trading Style.🏆💪🤝❤️🎉🚀
I'll see you soon with another heist plan, so stay tuned 🤑🐱👤🤗🤩

US30/DJI "Dow Jones" Index CFD Market Heist Plan (Day or Swing)🌟Hi! Hola! Ola! Bonjour! Hallo! Marhaba!🌟
Dear Money Makers & Robbers, 🤑 💰💸✈️
Based on 🔥Thief Trading style technical and fundamental analysis🔥, here is our master plan to heist the US30/DJI "Dow Jones" Index CFD Market. Please adhere to the strategy I've outlined in the chart, which emphasizes long entry. Our aim is the high-risk Red Zone. Risky level, overbought market, consolidation, trend reversal, trap at the level where traders and bearish robbers are stronger. 🏆💸Book Profits Be wealthy and safe trade.💪🏆🎉
Entry 📈 : "The heist is on! Wait for the MA breakout (42200) then make your move - Bullish profits await!"
however I advise to Place Buy stop orders above the Moving average (or) Place buy limit orders within a 15 or 30 minute timeframe most recent or swing, low or high level.
📌I strongly advise you to set an alert on your chart so you can see when the breakout entry occurs.
Stop Loss 🛑:
Thief SL placed at the recent/swing low level Using the 1H timeframe (41400) swing trade basis.
SL is based on your risk of the trade, lot size and how many multiple orders you have to take.
🏴☠️Target 🎯: 43100 (or) Escape Before the Target
🧲Scalpers, take note 👀 : only scalp on the Long side. If you have a lot of money, you can go straight away; if not, you can join swing traders and carry out the robbery plan. Use trailing SL to safeguard your money 💰.
US30/DJI "Dow Jones" Index CFD Market Heist Plan (Swing/Day) is currently experiencing a bullishness,., driven by several key factors.
📰🗞️Get & Read the Fundamental, Macro, COT Report, Geopolitical and News Analysis, Sentimental Outlook, Intermarket Analysis, Index-Specific Analysis, Positioning and future trend targets.. go ahead to check 👉👉👉
📌Keep in mind that these factors can change rapidly, and it's essential to stay up-to-date with market developments and adjust your analysis accordingly.
⚠️Trading Alert : News Releases and Position Management 📰 🗞️ 🚫🚏
As a reminder, news releases can have a significant impact on market prices and volatility. To minimize potential losses and protect your running positions,
we recommend the following:
Avoid taking new trades during news releases
Use trailing stop-loss orders to protect your running positions and lock in profits
💖Supporting our robbery plan 💥Hit the Boost Button💥 will enable us to effortlessly make and steal money 💰💵. Boost the strength of our robbery team. Every day in this market make money with ease by using the Thief Trading Style.🏆💪🤝❤️🎉🚀
I'll see you soon with another heist plan, so stay tuned 🤑🐱👤🤗🤩

"US30 / DJI" Indices Market Bearish Heist Plan🌟Hi! Hola! Ola! Bonjour! Hallo!🌟
Dear Money Makers & Robbers, 🤑 💰🐱👤🐱🏍
Based on 🔥Thief Trading style technical and fundamental analysis🔥, here is our master plan to heist the "US30 / DJI" Indices Market. Please adhere to the strategy I've outlined in the chart, which emphasizes short entry. Our aim is the high-risk Green Zone. Risky level, oversold market, consolidation, trend reversal, trap at the level where traders and bullish thieves are getting stronger. 🏆💸Book Profits Be wealthy and safe trade.💪🏆🎉
Entry 📈 : "The vault is wide open! Swipe the Bearish loot at any price - the heist is on!
however I advise placing Sell limit orders within a 15 or 30 minute timeframe. Entry from the most recent or closest low or high level should be in retest.
Stop Loss 🛑: Thief SL placed at (44200) swing Trade Basis Using the 4H period, the recent / swing high or low level.
SL is based on your risk of the trade, lot size and how many multiple orders you have to take.
Target 🎯: 42200 (or) Escape Before the Target
🧲Scalpers, take note 👀 : only scalp on the Short side. If you have a lot of money, you can go straight away; if not, you can join swing traders and carry out the robbery plan. Use trailing SL to safeguard your money 💰.
📰🗞️Fundamental, Macro, COT, Sentimental Outlook:
"US30 / DJI" Indices Market is currently experiencing a Bearish trend., driven by several key factors.
🟣Fundamental Analysis
Earnings: Q4 2024 EPS growth strong (e.g., 16.9% for S&P 500 proxies)—bullish, but US30 firms face tariff uncertainty.
Rates: Fed at 3-3.5%, no cuts signaled—real yields ~1% (10-year Treasury 3.8%) pressure equities—bearish.
Inflation: PCE 2.6% (Jan 2025)—persistent inflation supports Fed stance, bearish for stocks.
Growth: U.S. consumer spending wanes (Schwab)—mixed, neutral impact.
Geopolitics: Trump tariffs (25% Mexico/Canada, 10% China)—short-term volatility, long-term bullish for U.S. firms.
🟤Macro Economics
Federal Reserve Policy: The Federal Reserve has been raising interest rates to combat inflation, which has led to a strengthening of the US dollar.
US Economy: The US economy has been showing signs of slowing down, with GDP growth rates decreasing.
Global Economy: The global economy has been experiencing a slowdown, with many countries experiencing recession.
⚪Commitments of Traders (COT) Data
Speculators: Net long ~55,000 contracts (down from 65,000)—cooling bullishness.
Hedgers: Net short ~60,000—stable, locking in gains.
Open Interest: ~125,000 contracts—steady global interest, neutral.
🔴Market Sentimental Analysis
Bullish Sentiment: Some analysts believe that the US30 will break above the resistance at 45,000 and continue rising.
Bearish Sentiment: Many investors expect a correction, with a potential target of 42200.
Risk Aversion: The market is experiencing risk aversion, with investors seeking safe-haven assets.
🔵Positioning Analysis
Long Positions: Some investors are holding long positions in US30, expecting a breakout above 45,000.
Short Positions: Many investors are holding short positions in US30, expecting a correction.
🟠Quantitative Analysis
Technical Indicators: The 14-day Relative Strength Index (RSI) is at 45, indicating a neutral sentiment.
Moving Averages: The 21-day Simple Moving Average (SMA) is at 44,404, providing resistance for US30 prices.
🟡Intermarket Analysis
DXY: 106.00—USD softness aids equities—bullish.
XAU/USD: 2910—gold rise signals risk-off, bearish for US30.
NDX: ~20,000, tech softening—correlated pressure on US30—bearish.
Bonds: U.S. 10-year 3.8%—yield stability neutral.
🟢News and Events Analysis
Federal Reserve Meeting: The Federal Reserve is scheduled to meet on March 15-16, with investors expecting a potential rate hike.
US Economic Data: The US economic data, including the Non-Farm Payrolls report, is being closely watched for its impact on US30 prices.
🟣Next Trend Move
Bullish Trend: Some analysts believe that the US30 will break above the resistance at 45,000 and continue rising.
Bearish Trend: Many investors expect a correction, with a potential target of 42,200.
🔴Overall Summary Outlook
Bullish Outlook: Some analysts believe that the US30 will break above the resistance at 45,000 and continue rising.
Bearish Outlook: Many investors expect a correction, with a potential target of 42,200.
📌Keep in mind that these factors can change rapidly, and it's essential to stay up-to-date with market developments and adjust your analysis accordingly.
⚠️Trading Alert : News Releases and Position Management 📰 🗞️ 🚫🚏
As a reminder, news releases can have a significant impact on market prices and volatility. To minimize potential losses and protect your running positions,
we recommend the following:
Avoid taking new trades during news releases
Use trailing stop-loss orders to protect your running positions and lock in profits
💖Supporting our robbery plan 💥Hit the Boost Button💥 will enable us to effortlessly make and steal money 💰💵. Boost the strength of our robbery team. Every day in this market make money with ease by using the Thief Trading Style.🏆💪🤝❤️🎉🚀
I'll see you soon with another heist plan, so stay tuned 🤑🐱👤🤗🤩

DJIDJI - Dow Jones Index
Break of Structure
Symmetrical Triangle as an Corrective Pattern in Short Time Frame
Demand Zone
Fibonacci Level - 38.20% / 50.00%
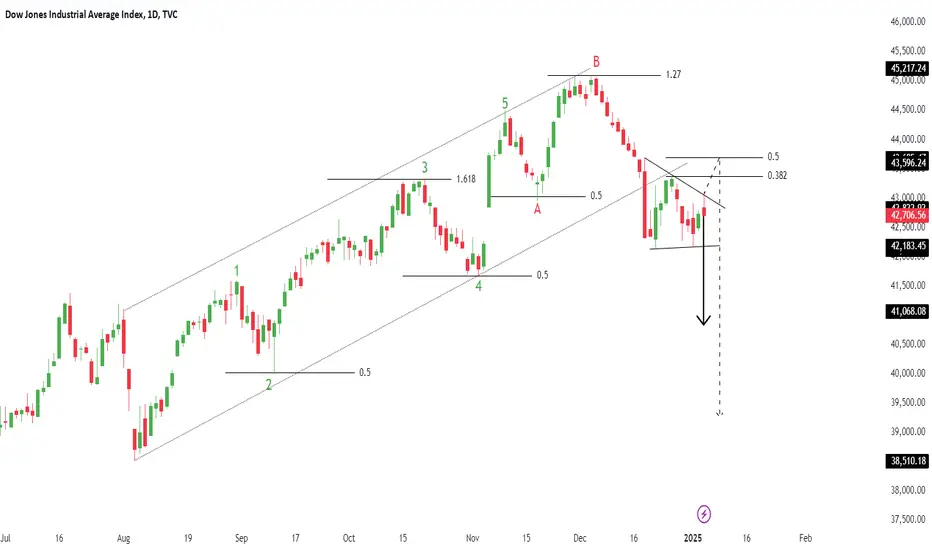
Completed " 12345 " Impulsive Waves and " AB " Corrective Waves
Dow Jones Industrial (DJI) Short Trade: TP1 DoneThe DJI (15-minute timeframe) chart presents a well-executed short trade setup, delivering substantial initial profits and paving the way for the remaining targets to be achieved.
Key Trade Insights:
Entry Point: Positioned at 44,159.10, as identified by the bearish crossover and resistance from the downward EMA.
Stop Loss: Strategically placed at 44,322.02 to safeguard against upward reversals.
Targets:
TP1: 43,957.73 ✅ Achieved
TP2: 43,631.88
TP3: 43,306.04
TP4: 43,104.67
Technical Breakdown:
Bearish EMA Structure: The red EMA ribbon suggests sustained downward pressure, reinforcing the bearish sentiment.
Volume Confirmation: Declining upward retracements signify reduced buying momentum, increasing the likelihood of hitting deeper targets.
Trade Outlook:
With TP1 secured, market momentum and bearish patterns strongly favor hitting TP2 and beyond. Traders using the Risological Indicator are positioned to capitalize further on this move.
Stay vigilant and let the profits roll in!

Dow JonesDJI - Dow Jones
Completed " 12345 " Impulsive Waves. Bullish Channel as an corrective pattern in short time frame and rejection from Upper Trend Line at Fibonacci Level - 261.8%. Strong Divergence with Break of Structure

US30 / DJ30 / DJI Market Money Heist Plan on Bullish SideHola ola My Dear,
Robbers / Money Makers & Losers,
This is our master plan to Heist US30 / DJ30 / DJI Market based on Thief Trading style Technical Analysis.. kindly please follow the plan I have mentioned in the chart focus on Long entry. Our target is Red Zone that is High risk Dangerous level, market is overbought / Consolidation / Trend Reversal at the level Bearish Robbers / Traders gain the strength. Be safe and be careful and Be rich.
Attention for Scalpers : If you've got a lot of money you can get out right away otherwise you can join with a swing trade robbers and continue the heist plan, Use Trailing SL to protect our money.
Note: If you've got a lot of money you can get out right away otherwise you can join with a swing trade robbers and continue the heist plan, Use Trailing SL to protect our money.
Entry : Can be taken Anywhere, What I suggest you to Place Buy Limit Orders in 15mins Timeframe Recent / Nearest Swing Low
Stop Loss : Recent Swing Low using 30m timeframe
Warning : Fundamental Analysis comes against our robbery plan. our plan will be ruined smash the Stop Loss. Don't Enter the market at the news update.
Loot and escape on the target 🎯 Swing Traders Plz Book the partial sum of money and wait for next breakout of dynamic level / Order block, Once it is cleared we can continue our heist plan to next new target.
Support our Robbery plan we can easily make money & take money 💰💵 Follow, Like & Share with your friends and Lovers. Make our Robbery Team Very Strong Join Ur hands with US. Loot Everything in this market everyday make money easily with Thief Trading Style.

US30 / DJ30 / DJI Market Money Heist Plan on Bullish SideMy Dear Robbers / Money Makers & Newbies,
This is our master plan to Heist US30 / DJ30 / DJI Market based on Thief Trading style Technical Analysis.. kindly please follow the plan I have mentioned in the chart focus on Long entry. Our target is Red Zone that is High risk Dangerous level, market is overbought / Consolidation / Trend Reversal at the level Bearish Robbers / Traders gain the strength. Be safe and be careful and Be rich.
Note: If you've got a lot of money you can get out right away otherwise you can join with a swing trade robbers and continue the heist plan, Use Trailing SL to protect our money.
Entry : Can be taken Anywhere, What I suggest you to Place Buy Limit Orders in 15mins Timeframe Recent / Nearest Swing Low
Stop Loss : Recent Swing Low using 2h timeframe
Warning : Fundamental Analysis comes against our robbery plan. our plan will be ruined smash the Stop Loss. Don't Enter the market at the news update.
Loot and escape on the target 🎯 Swing Traders Plz Book the partial sum of money and wait for next breakout of dynamic level / Order block, Once it is cleared we can continue our heist plan to next new target.
Support our Robbery plan we can easily make money & take money 💰💵 Follow, Like & Share with your friends and Lovers. Make our Robbery Team Very Strong Join Ur hands with US. Loot Everything in this market everyday make money easily with Thief Trading Style.

US30 Market breadth EMA200 [IAS]Introducing our Market Breadth Indicator, specifically designed for traders looking to gain a deeper understanding of the overall health of the Dow Jones Industrial Average (DJIA). This indicator tracks how many of the 30 Dow Jones stocks are trading above their 200-day Exponential Moving Average (EMA), giving you a quick snapshot of market momentum.
Traders typically use market breadth indicators to assess whether the market is broadly strong or weak. When more stocks are trading above their 200-day EMA, it suggests a healthy, bullish environment. Conversely, fewer stocks above this threshold could indicate a weakening market or a potential downturn. Our indicator takes this concept and visualizes it in an easy-to-read histogram, ranging from 0 to 30, where 0 represents no stocks above the 200-day EMA and 30 represents all stocks above this key level.
🔶Usage
Using the Indicator in your trading is straightforward, you can simply implement it by looking for:
1. Bullish Signals: When there are higher number of stocks highlighted in red (e.g., 25-30) trading above their 200-day EMA, it’s a strong signal that the market is in a robust uptrend.
2. Bearish Signals: When the histogram starts declining towards the lower end (e.g., 0-10, where below 6 is highlighted in green). This can be use as a warning sign that the market might be entering a bearish phase.
3. Confirming Trends: The indicator is also useful for confirming trends. For example, if the overall market is rallying but the histogram is showing a decline in stocks above the 200-day EMA, it could be a sign of underlying weakness. This divergence can alert you to potential trend reversals.
This indicator is versatile and can be adapted to various trading styles, whether you’re an intraday trader, or a longer-term investor.
Intraday Trading:
For intraday traders, this tool can be use to find short-term lows or peaks. As the histogram rises above the green zone in the session it may indicate increasing buying pressure, suggesting opportunities for quick long positions from the low. Conversely, if the histogram declines from a red zone, it could be a signal to explore short setups. Using this indicator alongside your usual intraday strategies can help you fine-tune your entries and exits, reducing risk and enhancing your trading precision.
Longer-Term Trading:
For longer-term investors or those looking to position trade on a weekly basis, Market Breadth is an excellent tool to assess the overall health of the market. A histogram consistently near its upper range (e.g., 25-30) over several weeks signals a strong, sustained uptrend, making it a good time to add to positions or initiate new ones. On the other hand, a gradual decline in the histogram over time may indicate that the market is weakening, suggesting a more cautious approach, such as rebalancing your portfolio or exploring defensive strategies. This longer-term perspective can help you stay aligned with the broader market trend, reducing the risk of being caught on the wrong side of a major market move.
By using the indicator across different timeframes, you can better align your trading strategy or even plan your risk management with the underlying market conditions, making more informed decisions whether you’re trading by the minute or planning for the months ahead.

DJI Pair : DJI - Dow Jones
Description :
Completed " 1234 " Impulsive Waves
Break of Structure
RSI - Divergence
Exp FIAT as an Corrective Pattern in Short Time Frame
Fibonacci Level - 38.20%

DJI - Dow JomesPair : DJI - Dow Jones
Description :
Completed " 12345 " Impulsive Waves
Break of Structure
RSI - Divergence
Bullish Channel as an Corrective Pattern in Short Time Frame
Resistance Level

DJI30 39000 looking weakAs I posted earlier about DJI30. It’s now tested 39000 multiple times and looks extremely weak. A break of this will accelerate a sell off. Look at my previous posts for major levels.
THIS IS NOT FINANCIAL ADVICE.

DJI - Dow JonesPair : Dow Jones - DJI
Description :
Bearish Channel as an Corrective Pattern in Short Time Frame
RSI - Divergence
Break of Structure
Completed " 123 " Impulsive Waves
Support Level

DOW JONESPair : DJI - Dow Jones
Description :
Bullish Channel as an Corrective Pattern in Short Time Frame
Break of Structure
RSI - Divergence
Completed " 12 " Impulsive Waves

NASDAQ WITH 13000+ SWING BULLISH PIPSNasdaq has been on a steady rise in price and the most recent pull back that touched 50/618% Fib region is except and would likely in the coming month take the stock price to 16800 dollar bench mark
According to DANCOLNATION CAPITAL TRADING STRATEGY,
We shall on the SWING perceptive join the trend after a retest to this most recent break out level to take an advantage of this amazing 13000+ pips

DJI (Dow Jones Industrial Average) Index Analysis 05/01/2022Fundamental Analysis:
As we can see the Index has shown a very strong come back after the Covid-19 pandemic of March 2021 which caused the market to fall and create a panic to the world.
Since then there are lots of changes to the world and the way companies are operating, such as releasing of their premises and offices as they should have discharge lots of their employees and the work from home schemes was the main reason to cut the expenditure of these companies drastically down.
From the other hand, the market administration and governments including Banks has injected lots of funds and so called Rescue Packages and the market stimulant's packages to protect the Market from its Hard and Drastically fall to the lower levels and prevent a gigantic Global Markets Crises.
These funds and injection of the cash to these companies along side of cost deduction due to their risk measurement policies, forced these companies to invest the receiving funds in to the companies assets to protect themselves from the Pandemic Crises and hedged their exposed risks instead of investing these funds to the new Projects or renovations which could Couse their Share prices to appreciate intrinsically but instead these investments in the assets made an inflation to the prices of the assets and created a bobble in their share value and Prices without having any inheritance or intrinsic values.
so we can easily have a decision derived from the current situation that there has to be an other market fall and crises soon so the Price and its relevant intrinsic values get converged and market comes to its correct values.
we can observe the same situation in many different centralized markets such as US500 and even other Stock Exchanges around the world like London and rest European market places to be in the same inflated status.
there exist a huge chance of an other Global Market Crises coming soon which has the domino effect and Couse the entire markets to fall for some times .
This fall of the market shall remove off the liquidity from the equity and debt market and streamflow them to some green heaven Asset classes including Gold and silver or even newly invented Technologies such as decentralized markets and Cryptocurrencies and DeFi.
if we have a look at the Current crypto's Total Crypto Market Capitalization we can see it has a very good chances of Rally Continuation to some very high levels such as 5 to 6 Trillion dollars or even much higher.
Gold even can see higher Prices such as 2500 USD per ounce which is currently ranging at 1800 USD.
we even can some how speculate a 3 world War to be the initiator of this Market fall which is even not so far from the reality as the situation in middle east is not very stable due to the Iran and Israel disputes and new anti-covid's restriction social movements in Europe and America continent.
we can see the same situation in US500
we shall analyze few other markets and indices and ultimately Propose some Assets which are at their low Points Currently and can be counted as under values at present times.
Technical Analysis:
we have used the Fibonacci retracement and Expansion from the low to the Highest point before the Covid pandemic to have a better vision of the Higher expansion levels for the post retracement's rallies and identify the Potential Price levels and resistance zones. where the market can show some stagnation and starts its retracement and price correction to the lower levels.
There exist a Bearish Divergence of Price and MACD where Price has made higher high levels but MACD made lower Highs which is the most significant and strong Bullish Trend Reversal and start of Market fall and Price retracement and Value corrections.
there are total of 2 Targets defined which have a very strong Support tendencies which can be interpreted as the maximum retracements points.
there are two Resistance level are also defined to have a better vision incase of Current Rally Continuation which eventually can be counted as the Trend reversal points.

Dow Jones Next Possible MovePair : Dow Jones ( DJI - US30 )
Description :
Bullish Channel as an Corrective Pattern in Long Time Frame
Impulse Correction
Completed " abc " Corrective Wave
Resistance Level
Divergence - RSI
