US30 Robbery Blueprint: Breakout, Pullback, Escape Setup💎 Dow Jones Robbery Blueprint: The US30 Vault Crack Plan 💎
(Maximized for reach — within TradingView title limit)
🌟Hi! Hola! Ola! Bonjour! Hallo! Marhaba!🌟
Dear Market Robbers & Money Movers 🕵️♂️💰🚨
This ain't your average analysis — it’s a Thief Trader-style 🔥tactical mission🔥 aimed at the mighty "US30/DJI" (Dow Jones Industrial Average). We're talkin' about a precision heist with a full blueprint: entry zones, trap setups, and escape exits. Read carefully — this ain’t for the faint-hearted traders! 🧠🦾
🧠 Entry Zones (The Break-In) 📈
🛠 ENTRY 1: Crack the wall near 44700.00 – that’s the resistance gate. Wait for confirmation.
🎯 ENTRY 2: Sneak in at the Market Makers’ Trap around 43500.00 – a dirty zone where retailers get baited. Perfect time to strike long!
🧱 DCA/Layering strategy recommended. Stack those buy orders like a thief layering explosives on a safe. 💣💸
🛑 Risk Levels (Escape Routes/Stop Loss)
🔊 "Listen up, vault raiders! Never drop your SL until breakout is confirmed. If you jump early, you might land in a bear trap! 🪤"
🔐 Stop Zones (Based on Strategy):
📌 Swing Buy SL (2H TF): Place at 44100.00 for the stealth buy.
🏦 Institutional SL (Swing Zone): Drop it around 43000.00
🔐 Max Risk SL (3H TF): If you're deep, your last stand is at 39200.00
☝️ SL depends on your position sizing, number of entries, and risk appetite. Trade like a thief, not a gambler.
🎯 Heist Target (Profit Exit)
🏁 Escape Point: 46200.00 — or exit before heat rises! Don’t be greedy. Rob and vanish. 💨💰
🔥 Market Mood: Why the Heist Is On
"US30/DJI" is bullish AF — thanks to:
📊 Macro-Economic Wind at Our Back
📈 Institutional momentum
📰 Strong sentiment and intermarket flows
Check your chart radar: Fundamentals + technicals aligning = green light for robbery! 🟢
⚠️ Tactical Reminder: News Can Jam the Plan
📵 Avoid new entries during major economic releases
🛡 Use trailing SLs to protect running trades
Stay alert, stay alive. 💡
❤️ Support the Robbery Crew
Hit that 💥BOOST💥 — your love fuels our next mission.
Join us and ride daily heist plans with Thief Trading Style 🏴☠️🚀💰
Djia

SPX to 6600+ by Aug 5This leg up in SPX is not over yet. Target at upper bound of the channel around 6.6K+ by Aug 5.

History does not repeat itself, however it tends to rhymeIt’s widely accepted that Mark Twain once said (or wrote) that “history does not repeat itself, however it tends to rhyme”.
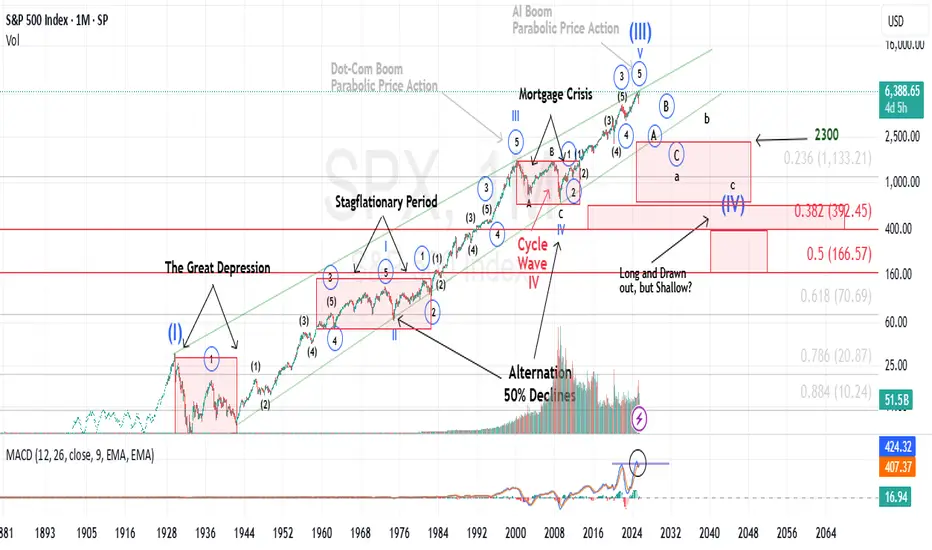
Historical Parallels to a Super Cycle Wave (I) Top in U.S. Equities
The road to a major market top is often paved with echoing patterns from the past, and today's landscape bears an uncanny resemblance to pivotal historical events that preceded economic upheaval.
The 1918 Spanish Flu—though less economically damaging in the U.S. than elsewhere, still triggered a 1.5% drop in GDP and a 2.1% decline in consumer spending. The resulting economic weakness, paired with rising inflation, eroded real returns on equities and short-term government bonds for years.
Then came the 1929 stock market crash, the spark that ignited the Great Depression. Driven by a perfect storm of extreme speculation, sky-high valuations, and a regulatory vacuum, the collapse revealed the systemic fragility beneath the euphoria.
Adding fuel to the fire, the Smoot-Hawley Tariff Act of 1930 slammed the brakes on global trade. By sharply raising tariffs on imports, it invited swift retaliatory measures from abroad. The result: a devastating plunge in both U.S. exports and imports, deepening the economic crisis and worsening unemployment. Smoot-Hawley has since become a textbook example of how protectionist policy can magnify economic damage.
Modern Echoes: A Cycle Repeating?
Fast forward to the present and we see unsettling similarities.
The Covid-19 pandemic serves as a modern analog to the 1918 flu, disrupting global supply chains and triggering a steep drop in GDP and consumer spending. Unlike the post-WWI period, however, inflation didn’t precede the crisis, it exploded afterward, fueled by pent-up demand and fiscal stimulus, giving rise to persistent “sticky” inflation....and NOT TRANSITORY.
In a similar inversion of sequence, the Trump-era tariffs—modern-day echoes of Smoot-Hawley, were enacted before any major equity downturn, not after. Still, their long-term impact on global trade and supply chain reliability remains a pressure point for the economy.
Most critically, speculation and valuation excess are again center stage. Just as the roaring ’20s were characterized by euphoric risk-taking, today’s U.S. equity market is trading at record-high P/E ratios, despite rising macroeconomic uncertainty and deteriorating breadth.
These historical and contemporary markers suggest we may be approaching the apex of a Super Cycle Wave (III), a turning point that, like its predecessors, may only be fully recognized in hindsight.
It is my contention, that history is currently rhyming.
Best to all,
Chris
Extended rally off April lows should be completing imminentlyEvery so often, a market move defies conventional expectations of retracement—and the rally off the Liberation Day lows is exactly that. It’s extended longer and climbed higher than even the most bullish forecasts imagined in early April. No one remembers the calls for an imminent recession by most large Wall Street firms.
Now, we're pushing into yet another all-time high—despite glaring negative MACD divergence and a financial media landscape that’s nothing short of euphoric.
The narratives being pushed? Honestly, it’s hard to write them with a straight face:
Tariffs are no longer inflationary. Apparently, I wasted time and tuition learning international trade theory and macroeconomics. Who knew deficits and trade imbalances didn’t matter anymore? Who pays tariffs again? ...never mind.
Weak momentum since mid-May signals not exhaustion—but an “unhealthy absence” of institutional selling, which apparently means the retail trader is in full control now. Because that always ends well... right?
DOW JONES to 55,642#InverseHead&Shoulders
Projects record new highs.
Another stepping stone to our long held forecast of 64,000
Why?
Because AI will significantly contribute to an EXPANDING #GDP
Quick take on DJIACurrently, the Dow Jones Industrial Average TVC:DJI is trading within a short-term downside channel. However, could it just be part of a correction, before another possible leg of buying? Let's dig in.
MARKETSCOM:US30
Let us know what you think in the comments below.
Thank you.
75.2% of retail investor accounts lose money when trading CFDs with this provider. You should consider whether you understand how CFDs work and whether you can afford to take the high risk of losing your money. Past performance is not necessarily indicative of future results. The value of investments may fall as well as rise and the investor may not get back the amount initially invested. This content is not intended for nor applicable to residents of the UK. Cryptocurrency CFDs and spread bets are restricted in the UK for all retail clients.

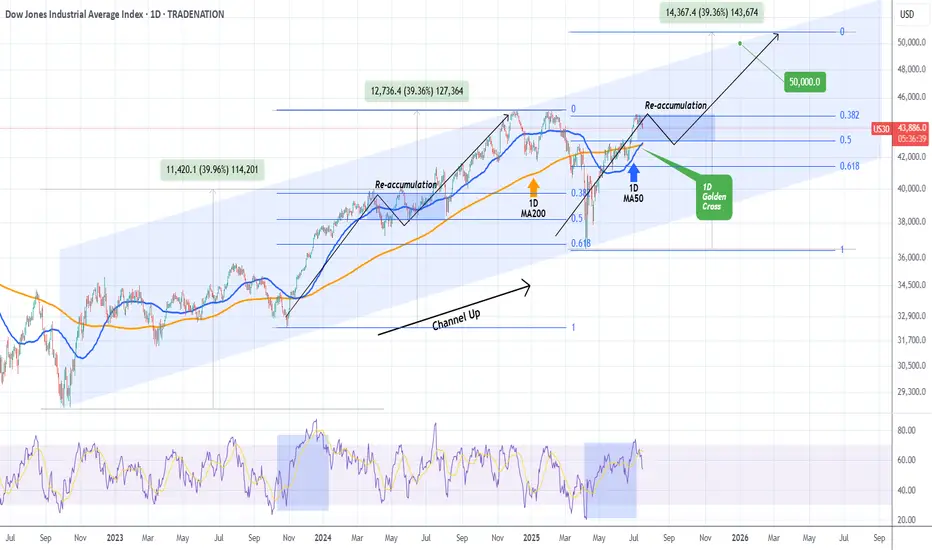
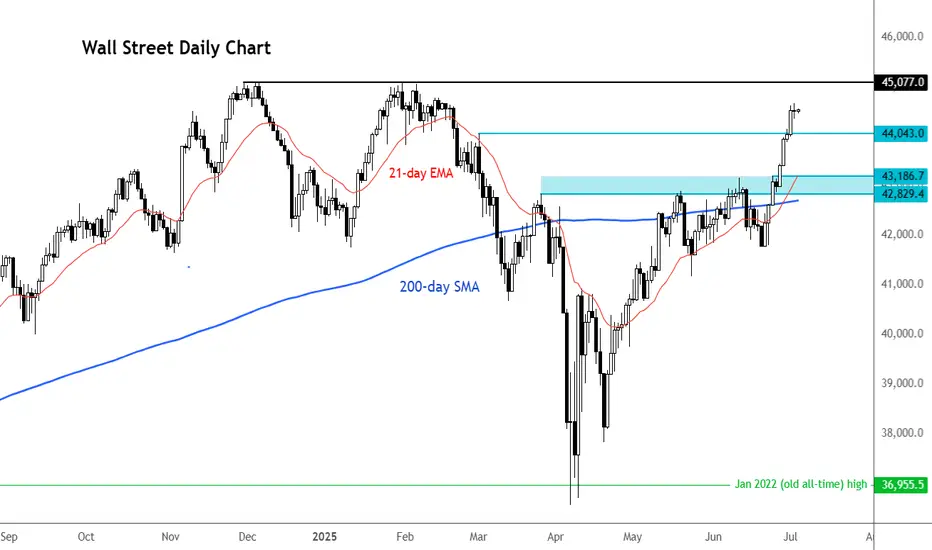
DOW JONES formed 1st 1D Golden Cross since 2022!Dow Jones (DJIA) completed on Monday its 1st Golden Cross on the 1D time-frame since December 12 2022! This powerful bullish pattern comes with the price close to its All Time High (ATH).
Being inside almost a 3-year Channel Up, the current rise is the pattern's latest Bullish Leg following the April 07 2025 bottom (Higher Low). Both previous Bullish Legs rose by +39.96% before forming a Higher High.
Based on the Fibonacci retracement levels, last time the previous Bullish Leg was within the 0.382 - 0.5 Fibonacci Zone, it formed a Re-accumulation Phase for 3 months. As a result, we shouldn't dismiss the fact of trading sideways for the rest of the Summer and then picking up the pace. Our end-of-year Target remains 50000.
-------------------------------------------------------------------------------
** Please LIKE 👍, FOLLOW ✅, SHARE 🙌 and COMMENT ✍ if you enjoy this idea! Also share your ideas and charts in the comments section below! This is best way to keep it relevant, support us, keep the content here free and allow the idea to reach as many people as possible. **
-------------------------------------------------------------------------------
Disclosure: I am part of Trade Nation's Influencer program and receive a monthly fee for using their TradingView charts in my analysis.
💸💸💸💸💸💸
👇 👇 👇 👇 👇 👇
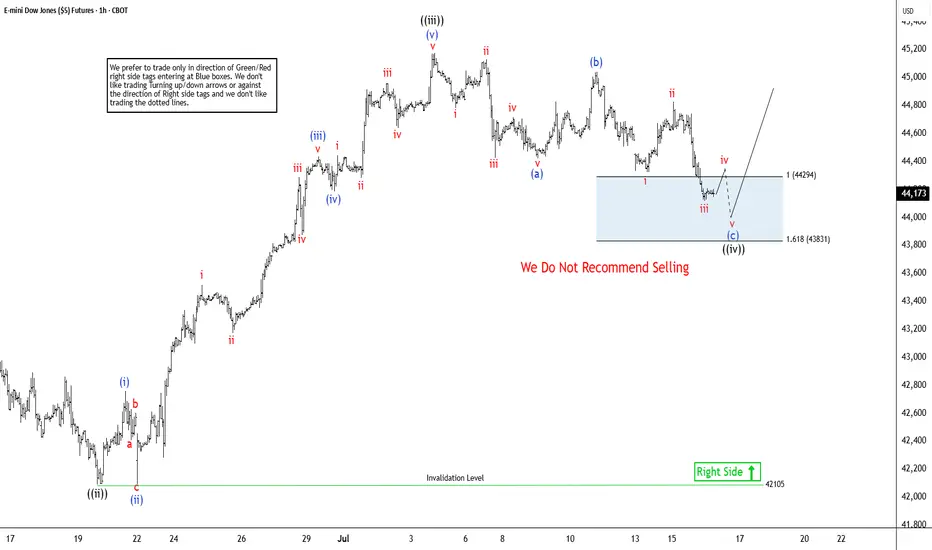
Dow Jones Futures (YM_F) Expects Rally From Extreme AreaThe Dow Jones E-mini Futures (YM_F) favors impulsive rally from 4.07.2025 low of 36708. It is trading close to the previous high of 1.31.2025 of 45227. A break above that level will confirm the bullish sequence. Other US indices like Nasdaq & S & P 500 futures already confirmed the new high in daily, calling for more upside against April-2025 low. As per latest Elliott wave sequence in Dow Jones, it favors upside & pullback in 1-hour remain supported in extreme area to rally higher. Since April-2025 low, it placed 1 at 42976 high & 2 at 41236 low. Above there, it favors upside in 3 of (1) & expect one more push higher, while dips remain above price trendline. We like to buy the pullback in 3, 7 or 11 swings at extreme area for next rally.
Within 3, it ended ((i)) at 43316 high, ((ii)) at 42088 low & ((iii)) at 45177 high. In wave ((iii)), it ended (i) at 42759 high, (ii) at 42096 low, (iii) at 44435 high, (iv) at 44185 low & (v) at 45177 high. Currently, it favors pullback in zigzag correction in ((iv)) & expect small downside in to 44286 – 43815 area before resume upside in ((v)) of 3. Within ((iv)), it placed (a) at 44482 low, which subdivides in 5 swings. It placed (b) at 45043 high in 3 swings bounce that almost corrects 90 % of (a). Currently, it favors downside in (c), which should unfold in 5 swings in to extreme area. Within (c), it placed i at 44324 low, ii at 44827 high & iii at 44118 low. It favors bounce in iv before final down in v to finish the (c) of ((iv)) against 6.19.2025 low before rally resumes towards 45500 or higher levels. In 4-hour, it expects two or more highs to finish the impulse sequence from April-2025 low before it may see bigger correction
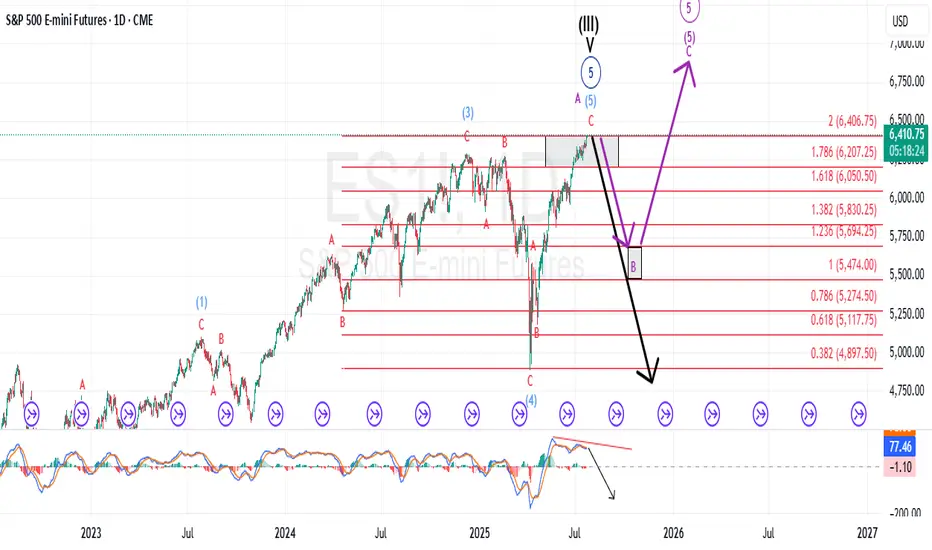
Are We Completing the Larger Ending Diagonal Now?The last time I updated followers of my work; I stated that the pattern was advancing, but NOT with confidence, and that it is marked with choppy, overlapping price action that appears to be an ending diagonal. Those sentiments have not changed.
However, what has changed is I was forecasting a more pronounced drop first before getting to new highs. It is now possible; this move higher is completing that move on a more immediate basis. Although I cannot rule out the previous larger ABC... it is more likely once this high completes, it could represent the end of the bull market.
Only the structure of the decline will inform us what is playing out.
I will warn followers that once this more immediate high completes, I am expecting a forceful and swift reversal that will undoubtedly catch most traders off guard.
Best to all,
Chris

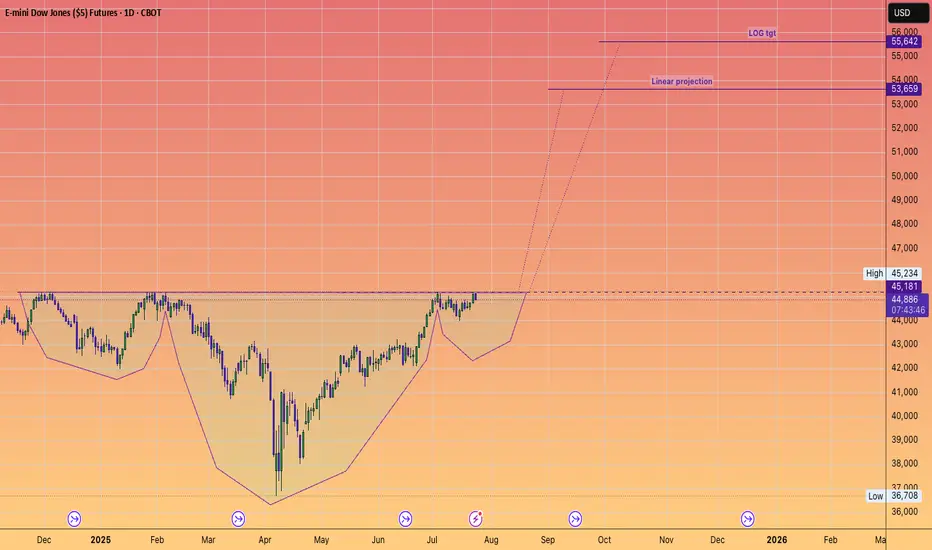
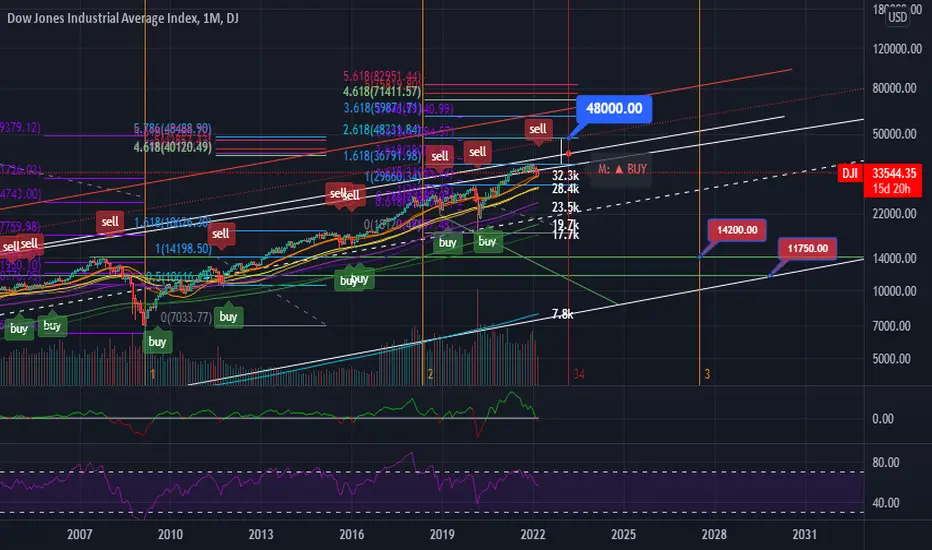
Dow Jones (DJI) Logarithmic Macro Outlook Log target: 48k
The dotted red line is adjusted for inflation. The stock market cycles are lengthening. Continued downside till EOM followed by a final melt-up rally that will bring the end of grand wave 5.
ETA: Q1 '23.
Can Dow hit new highs?While the likes of the S&P 500 and Nasdaq 100 are already record highs, the Dow has not achieved that target yet. It continues to make higher highs and higher lows, and the momentum seems to be getting stronger. Soon, it may even flirt with fresh all-time highs, as investors ride the tailwinds of a robust rally that kicked off in early April. There have been a few catalysts behind this rally. First, it was Trump hitting pause on reciprocal tariffs; then, a wave of optimism washed over markets following a sudden de-escalation in the Middle East. The bulls took charge, and markets haven’t looked back since. But with 4 July celebrations on the doorstep and Wall Street due to close at 1pm NY time, today’s shortened session has a singular focus: the all-important US non-farm payrolls report. Will we have enough time to see the Dow march to new highs? The key levels are marked on the chart.
By Fawad Razaqzada, market analyst with FOREX.com

In the 2030's The Nasdaq 100 to 2X the Dow Jones.#CupandHandle don't fight the trend.
Technology vs Industrials.
AI
Robotics
Space Economy
Biotech
Artificial Super Intelligence to power GDP to insane levels.

DOW JONES about to skyrocket based on the Gold/Silver ratio!Dow Jones (DJI) has been basically consolidating for the past month or so, following the massive April 7th bottom rebound but there is a very distinct indicator that shows it is about to skyrocket.
That is the Gold/ Silver ratio (blue trend-line). Gold (XAUUSD) as a safe haven, attracts capital in times of market uncertainty. Silver (XAGUSD), as a metal of industrial use, attracts capital in times of economic boom and prosperity.
In the past 6 years more particularly, every time the Gold/ Silver ratio declined, Dow started rising aggressively (exception July-Aug 2019, when the market rose straight after), as investors clearly showed their risk-on appetite by buying Silver (optimism) at the expense of Gold (fear).
Dow's current consolidation indicates that there may be high accumulation in the past month and the ratios extended decline suggests a skyrocket move is up next.
-------------------------------------------------------------------------------
** Please LIKE 👍, FOLLOW ✅, SHARE 🙌 and COMMENT ✍ if you enjoy this idea! Also share your ideas and charts in the comments section below! This is best way to keep it relevant, support us, keep the content here free and allow the idea to reach as many people as possible. **
-------------------------------------------------------------------------------
💸💸💸💸💸💸
👇 👇 👇 👇 👇 👇

A Trend on Borrowed Time, A Micro ED within a Larger ED?Since mid-last month, the broader equity market has been grinding higher — but not with confidence.
The advance has been marked by choppy, overlapping price action that feels more hesitant than bullish. Yes, prices continue carving out higher highs and higher lows, but MACD momentum tells a different story. With every push upward, the MACD weakens, flashing warning signs beneath the surface. Taken through the lens of Elliott Wave theory, this unfolding pattern carries all the classic fingerprints of an Ending Diagonal — a structure that often signals a trend on borrowed time.
Key Characteristics of an Ending Diagonal:
1. Position in the Wave Structure:
A. Occurs in Wave 5 of an impulse wave or Wave C of a corrective pattern (such as a zigzag or flat).
B. Rarely, but sometimes, seen in Wave 3 of an impulse, but this is generally associated with a leading diagonal, not an ending one.
2. Structure:
A. Composed of five sub-waves, labeled (i), (ii), (iii), (iv), (v).
B. Each of these sub-waves subdivides into 3 waves (i.e., they are all corrective or "3-wave" structures, often labeled as a-b-c).
C. This gives the whole pattern a distinct 3-3-3-3-3 internal structure.
3. Price Behavior:
A. Overlapping waves: Wave 4 often overlaps with the price territory of Wave 1, which is normally a rule violation for standard impulsive structures — but it's allowed in an ending diagonal.
B. Converging trendlines: The upper and lower boundaries of the diagonal typically form converging lines (like a wedge), though they can also be parallel in some cases.
C. Diminishing momentum: Often accompanied by momentum divergence, meaning price makes a new high or low, but momentum indicators (MACD, RSI) do not confirm.
4. Implication:
A. An ending diagonal suggests the current trend is running out of steam.
B. Once complete, a sharp reversal or significant correction is expected.
In my analytical view, the byproduct of an Ending Diagonal often lures market participants into a conflicted state — cautious, yet unable to ignore the persistent upward grind. You’ve probably heard the old market adage: “Don’t fight the tape.” In this case, that mentality sets in as traders, wary but worn down, finally throw in the towel and join the advance — only for the market to seemingly punish that decision with a sharp reversal.
Many experienced traders describe their Ending Diagonal experience the same way: “The moment I finally stopped fighting the trend and got long, it was as if the market was waiting for me — and reversed hard.”
That is how I would describe this micro ED we appear to be in the final stages of what I’m counting as the micro wave v of (v) of Minor A.
For now, no key structural support levels within the Micro Ending Diagonal have been breached, so the advance can certainly stretch a little higher. But make no mistake — in my opinion, this remains one of the most dangerous, deceptive patterns to engage with.
Last week, I closed my short out-of-the-money ES call positions during the micro wave iv pullback (not shown on the above chart). Ideally, I’m looking for an opportunity to reestablish a similar position this week. From there I will reassess the larger Ending Diagonal pattern you see outlined on the chart above.

Quick take US indices and the Fed's interest rate decisionQuick look at what can we expect from the Fed's rate decision and press conference on Wednesday.
TVC:DJI
TVC:SPX
TVC:NDQ
Let us know what you think in the comments below.
Thank you.
77.3% of retail investor accounts lose money when trading CFDs with this provider. You should consider whether you understand how CFDs work and whether you can afford to take the high risk of losing your money. Past performance is not necessarily indicative of future results. The value of investments may fall as well as rise and the investor may not get back the amount initially invested. This content is not intended for nor applicable to residents of the UK. Cryptocurrency CFDs and spread bets are restricted in the UK for all retail clients.

A Potentially Dangerous Pattern Takes ShapeWhile the futures market has yet to break into new all-time high territory, the previously discussed bearish micro setup has now been invalidated. In its place, we’re witnessing a complex, overlapping advance—creeping steadily toward the prior highs in the S&P 500 (ES).
At the micro level, I currently see no compelling bearish setup. However, this grinding upward move—lacking strong conviction from either buyers or sellers—is not necessarily bullish. In fact, it’s a hallmark of a potentially dangerous pattern: a primary degree ending diagonal.
If my interpretation is correct, both the “orange” and “purple” wave counts point to the same ominous conclusion. They suggest that what we're seeing could culminate in a sharp, possibly violent reversal—one that would ultimately retrace back to where this entire primary wave began. For reference, that’s just above 4,000, marked by the conclusion of Primary Wave 4 in October 2022.
This is the moment for caution—not after the damage is done.
Yes, we may push into new all-time highs. But within this fragile and overlapping structure, that outcome is far from guaranteed. Even if we get there, the looming question remains:
At what cost?

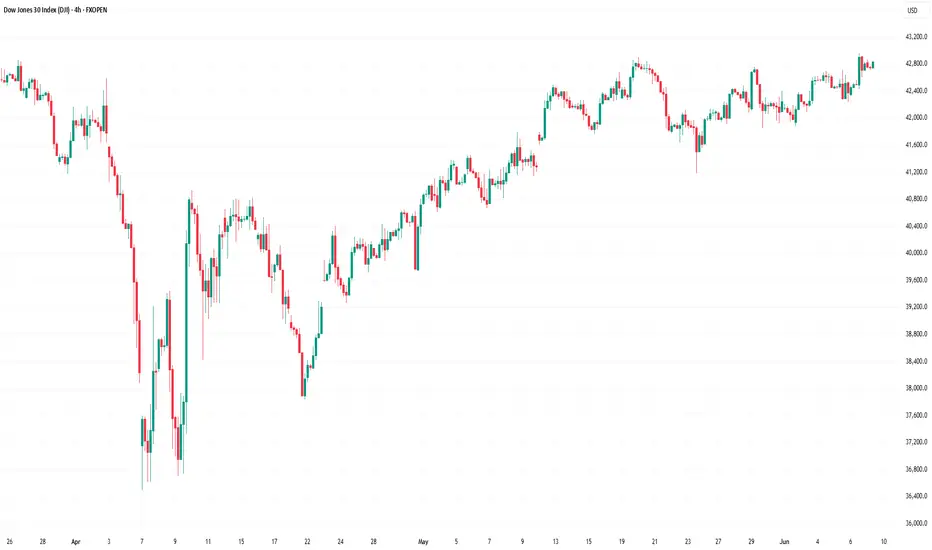
Dow Jones Index Rises Towards Key ResistanceDow Jones Index Rises Towards Key Resistance
On Friday, the Dow Jones Industrial Average (Wall Street 30 mini on FXOpen) climbed above the 42,950 level — a high not seen since early March.
The index has gained around 1.6% since the beginning of June.
Why Is the Dow Jones Rising?
→ Friday’s US jobs report helped ease concerns about the country’s economic outlook. According to ForexFactory, Non-Farm Employment Change came in at +139K, beating the forecast of +126K.
→ On Thursday, Donald Trump and Chinese President Xi Jinping held a call, easing tariff tensions. Market participants also welcomed news that officials may hold trade negotiations in London on 9 June.
Could the DJIA (Wall Street 30 mini on FXOpen) Rally Continue?
Technical Analysis of the Dow Jones Chart
The chart suggests that the 42,950 level is acting as a significant resistance. The price has repeatedly reversed from the 42,660–42,950 area (as shown by the arrows).
At the same time:
→ Friday’s move above 42,950 triggered selling pressure, forming a candlestick with a long upper shadow;
→ This may have been a false bullish breakout of the May high;
→ The price remains within an ascending channel (shown in blue), but the bounces off the lower boundary appear weak.
Given this setup, it is reasonable to assume that intensified bearish activity near 42,950 on the USA30 could lead to a breakout below the channel’s lower boundary.
Additional pressure on the Dow Jones Industrial Average (Wall Street 30 mini on FXOpen) may come from developments in California, where protests have erupted against immigrant deportations, with President Donald Trump and Governor Gavin Newsom trading accusations.
This article represents the opinion of the Companies operating under the FXOpen brand only. It is not to be construed as an offer, solicitation, or recommendation with respect to products and services provided by the Companies operating under the FXOpen brand, nor is it to be considered financial advice.
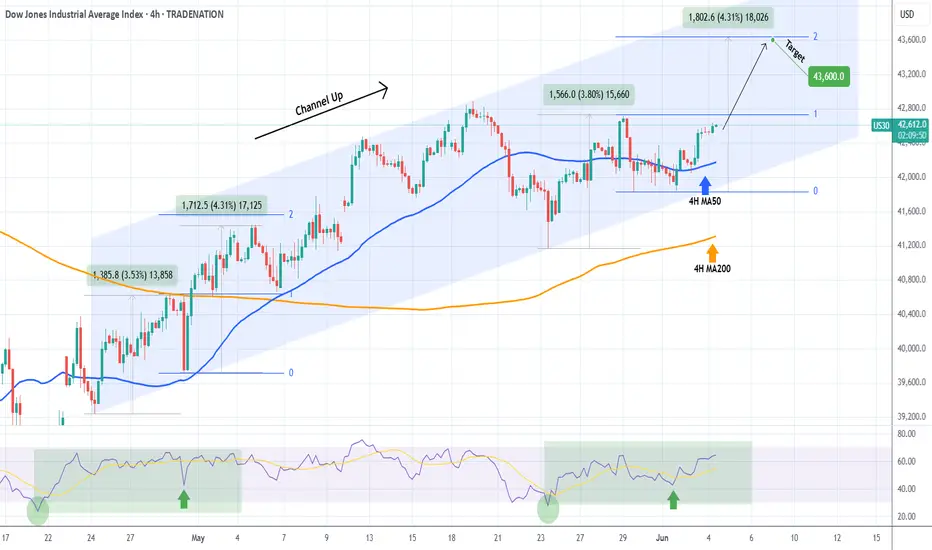
DOW JONES starting the new Bullish Leg.Dow Jones (DJI) is rallying off its 4H MA50 (blue trend-line), shortly after making a new Higher Low on its 6-week Channel Up. Technically that is the start of its new Bullish Leg.
With the 4H RSI being identical to the Bullish Leg at the start of the Channel Up, we expect it to again rise by +4.30% and touch the 2.0 Fibonacci extension. Target 43600.
-------------------------------------------------------------------------------
** Please LIKE 👍, FOLLOW ✅, SHARE 🙌 and COMMENT ✍ if you enjoy this idea! Also share your ideas and charts in the comments section below! This is best way to keep it relevant, support us, keep the content here free and allow the idea to reach as many people as possible. **
-------------------------------------------------------------------------------
Disclosure: I am part of Trade Nation's Influencer program and receive a monthly fee for using their TradingView charts in my analysis.
💸💸💸💸💸💸
👇 👇 👇 👇 👇 👇
DOW JONES TO 111 THOUSAND..in the the 2030's.
as an investor you must be thinking 2 decades down the line.
NOT 2 quarters.
They can not
stop
printing #FIAT
it's in the code.
A 8% compound rate puts the Dow Jones at 85,000 in 2034.
I'm long forever.

DOW JONES: Inverse Head and Shoulders looking for a breakout.Dow Jones is marginally bullish on its 1D technical outlook (RSI = 55.600, MACD = 267.860, ADX = 21.901) as just now it is attempting to be detached from the 4H MA50. Technically this could be the attempt to break towards the 2.0 Fibonacci extension, after having formed the RS of an Inverse head and Shoulders pattern. With the 4H MACD close to a Bullish Cross, we are bullish, TP = 44,250.
## If you like our free content follow our profile to get more daily ideas. ##
## Comments and likes are greatly appreciated. ##

Tracking a pattern that could signal the Top is In I am tracking a micro pattern with the new local high made in the ES last night and today's price action as a micro 5-down....we should get a slight retrace into the 5960 ish area. Maybe tomorrow...maybe in the overnight session tonight.
If price can then breach todays micro low of 5884 in the ES futures...we need to then follow through with a breach of 5857 to give us our first indication, we may have struck a top.
From there I am following 2 counts...Purple, or my primary count which is a minor C of Intermediate (A).
Best to all,
Chris

Dow Eyes 42,800 Resistance – Key Breakout Ahead?The Dow is currently holding near the neckline of a double-top formation that developed between December 2024 and February 2025, possibly buoyed by ongoing tech and Nasdaq optimism. The broader rebound from the 2025 lows is also forming a diagonal structure, setting up the following scenarios:
Bullish Scenario:
With weekly RSI holding above the 50 neutral zone after rebounding from oversold levels last seen in 2020, a sustained move above the 42,800-resistance level could extend the rally toward 43,800 and 44,800. A breakout above the all-time high near 45,000 would open the door toward the next major resistance at 46,800.
Bearish Scenario:
If the diagonal formation breaks to the downside—below 41,400 and 41,000—selling pressure could resume, forming a diagonal correction targeting support levels at 40,400, 39,700, and 39,000.
Written by Razan Hilal, CMT
