TGIF, 24 Feb 2023🖼 Daily Technical Picture 📈
➤ A negative day to finish off a negative (shortened) week for equity prices. S&P500 was down around -2.7% from previous Friday close.
➤ Yet again we saw Friday trade finish higher than it started (green arrows in chart). This makes it 9 consecutive Fridays. Probably the only consistent observation that I can make since the start of the year. Yet I do see a wrinkle, overall, the size of the "body" of the candle i.e. distance between daily open and close has narrowed. Either someone has exploited this anamoly or it is simply the fact that we should expect a narrowing during a short-term downtrend since 2 Feb. In that case, when the bullish trend returns, we should once more see a large profitable body on Fridays?
➤ We should also note the gap in daily prices between previous days' close and the next days' open (blue arrows in chart). These tend to get filled in due course, meaning prices should at some stage (whenever that will be) will return back up to these levels.
➤ Anyway, I shouldn't bore you with such uninteresting and useless observations. Over this weekend, I'll re-visit some of the charts to look at any price developments in other asset classes such as NATGAS, GOLD, USDOLLAR etc.
➤ Conclusion: TGIF, have a great weekend!
Djia

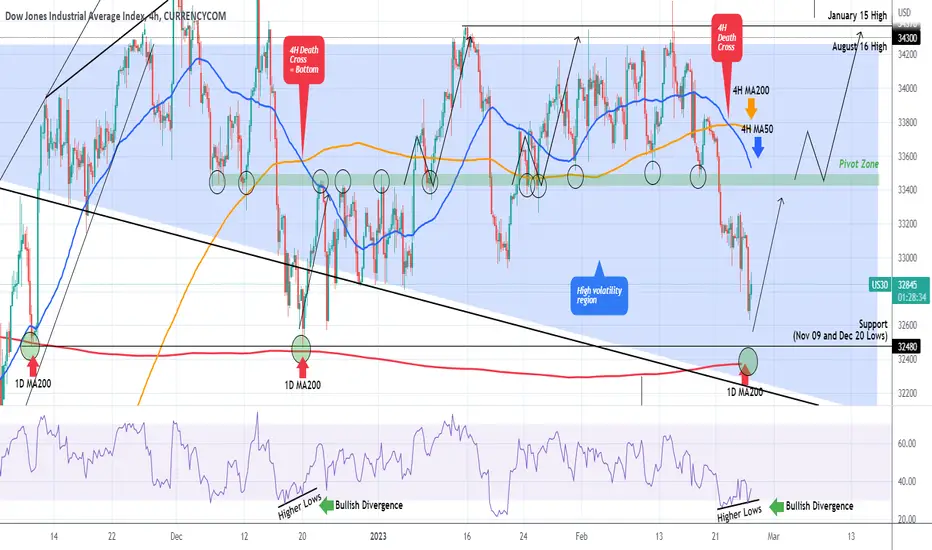
DOW JONES Aggressive bullish reversal expectedDow Jones (DJI) broke below its Pivot Zone and Higher Lows trend-line and as per our strategy published 2 weeks ago, we took that break-out sell opportunity:
With the 4H RSI though printing Higher Lows against the price's Lower Lows (i.e. a Bullish Divergence) and the price approaching the 32480 Support level and the 1D MA200 (red trend-line), which both provided Support and started aggressive rebounds on November 09 2022 and December 20 2022, Dow is turning into a medium-term (at least) buy opportunity again.
In fact the very same RSI Bullish Divergence formed the December 20 Low. It is important to add that this Low was formed after a 4H Death Cross, a pattern that we already formed again 2 days ago.
We are buyers again on Dow, targeting the 4H MA50 (blue trend-line). Then we will either wait for a pull-back or buy when the price breaks above the Pivot Zone and re-tests it as Support, in similar fashion as on January 06 2023 and January 23 2023. Long-term target 34300.
-------------------------------------------------------------------------------
** Please LIKE 👍, FOLLOW ✅, SHARE 🙌 and COMMENT ✍ if you enjoy this idea! Also share your ideas and charts in the comments section below! **
-------------------------------------------------------------------------------
💸💸💸💸💸💸
👇 👇 👇 👇 👇 👇
us30 short form 50% to -21% of yesterdays price displacement Us30 is going to drop about -340 to -300 points today. approximately from 50% to -21% of yesterdays price displacement. Please give me a follow when this pans out correctly.

The 400, 24 Feb 2023🖼 Daily Technical Picture 📈
➤ Equities were all over the place on Thursday trade. Starting higher, dipping lower before moving back up to where it all pretty much started.
That is "The 400".
➤ 400 is the key round number level of the S&P500 Index (SPY) or 4,000 for the SPX500. Price tends to get drawn to and then gyrate around these round numbers like a moth to a flame. Not to be outdone, there is also the 200-day moving average in the midst.
➤ What's significant about the round numbers like 100, 1,000 or 30,000? Nothing in particular. It's just that "human" psychology finds them "favourable" or "comforting" or "satisifying" perhaps? It's certainly more appetising than a number like 30,627. Obviously, algos and bots also try to exploit these conditions, hence the back and forth we usually see.
➤ I took the exit signal to get out of my short position. Does it mean prices may bounce higher? It's certainly possible but I don't have a high conviction view. I'm going to sit it out for now until the next favourable opportunity hopefully very soon.
➤ Conclusion: Happy to be counting my profits until the next trade.

DJIA Is Hunting Support at 31000-32000 AreaDJIA going down for C wave. So the correction is not done yet it seems. I think that commodity currencies can make deeper pullbacks then; AUD, NZD will be my favorite ones for longs (longer-term) when this correction on DJIA unfolds.

Trend Continuation, 23 Feb 2023🖼 Daily Technical Picture 📈
➤ Equities finished slightly down although tech and small cap outperformed. Price recovered from the day's low towards the end of the trading session but was not able to hold on to earlier gains.
➤ Overall, there's little to say about today's price action. S&P500 once again finished below the 400 level. Usually around these "round" numbers, price likes to move to and fro.
➤ I continue to hold my large short position.
➤ Conclusion: I still favour trend continuation to the downside in the short-term.

Hang On Tight! 22 Feb 2023🖼 Daily Technical Picture 📈
➤ It was a strong red day across the board with small-cap and tech suffering the most. Interestingly the DOW 30 lost more than the S&P500. That is unusual. Our hanging wo(man) failed to hold on to support on two accounts. Firstly the short-term low at 405 and also the 200-day Moving Average.
➤ Today's losses wiped out all of the February gains as well as 50% of the gains for the year (as measured from the recent peak).
➤ So where will our hanging wo(man) land? Around 390 is a clear first target. If that doesn't hold, next level is 380.
➤ I continue to hold my large short position.
➤ Conclusion: Hang on tight!

Don't Leave Me Hanging! 20 Feb 2023🖼 Daily Technical Picture 📈
➤ Equity prices finished Friday trade in an unconvincing manner. It looks like a wo(man) struggling to hang on from height (as illustrated). Obviously I'm a bit biased given my short positioning. Price did hold above the recent low at 405 so there is an opportunity for price to continue to recover.
➤ BTW, have you noticed that on every Friday since the start of the year, the market has closed higher than the open? What does it mean? Probably nothing...just thought it was good trivia.
➤ Anyhow, the price is really hugging my predicated price path nicely. To stay that way, we need to see the price drop immediately on resumption of trade Tuesday. There's nothing magical about the path, it is completely coincidental that the price is following it.
➤ Conclusion: Look out below.

us30 shortus30 short 12RR. My analysis suggests that a big decline is approaching. Its probably going to end next weak before mondays us open. tell me what you think

It's Showtime! 17 Feb 2023🖼 Daily Technical Picture 📈
➤ We continue to see significant intra-day volatility in equities. Swings in excess of 1% up and down are now the norm. We should continue to expect this especially during this crucial period.
➤ This is the first day after many that the prices have managed to finish lower. The Bulls were not able to support the price. Their attempts today failed. That was sufficient to give me the signal to go ALL IN. Meaning, I am now SHORT with the maximum position size. It's Showtime!
➤ For things to go my way, I firstly need to see the price confidently break below 405. This was the recent low in the side-ways movement in the past couple of weeks. Then there is the much watched 200-day moving average at around 400. Below that is a possible fast drop to 390. That's around a 5% move from current levels.
➤ Conclusion: The Short trade plan is beginning to move in my favour but plenty of things may go wrong.

easyMarkets Dow Jones Daily - Quick Technical OverviewThe DJIA index continues to slowly form higher lows, however it is currently struggling with key resistance near the 34500 level. In order to see further advances, a break of that area is required. We will then target the highest points of December and April 2022.
For the downside, a break of the short-term tentative upside support line would be needed. Also, a drop below the 33543 hurdle, which is the current lowest point of February, may clear the way to some lower areas.
Disclaimer:
easyMarkets Account on TradingView allows you to combine easyMarkets industry leading conditions, regulated trading and tight fixed spreads with TradingView's powerful social network for traders, advanced charting and analytics. Access no slippage on limit orders, tight fixed spreads, negative balance protection, no hidden fees or commission, and seamless integration.
Any opinions, news, research, analyses, prices, other information, or links to third-party sites contained on this website are provided on an "as-is" basis, are intended only to be informative, is not an advice nor a recommendation, nor research, or a record of our trading prices, or an offer of, or solicitation for a transaction in any financial instrument and thus should not be treated as such. The information provided does not involve any specific investment objectives, financial situation and needs of any specific person who may receive it. Please be aware, that past performance is not a reliable indicator of future performance and/or results. Past Performance or Forward-looking scenarios based upon the reasonable beliefs of the third-party provider are not a guarantee of future performance. Actual results may differ materially from those anticipated in forward-looking or past performance statements. easyMarkets makes no representation or warranty and assumes no liability as to the accuracy or completeness of the information provided, nor any loss arising from any investment based on a recommendation, forecast or any information supplied by any third-party.

Now or Never, 16 Feb 2023🖼 Daily Technical Picture 📈
➤ For the fourth consecutive day, price finished the trading day higher than the open. All this "bullish" action has occurred within the shadows of the large "bearish" bar on 9th Feb.
➤ Yesterday, I looked at the Bearish case of this "laboured" move. Today I'm going to touch on the Bullish story.
➤ The case for being Bullish is quite simple. The market has formed a Bullish "flag" technical chart formation. This is a minor retracement where prices whipsaw up and down either in a sideways or slight downward manner within the primary Bull trend. At some stage, price will then accelerate higher by breaking above this price congestion.
➤ The 4 consecutive up bars of recent days is telling us that despite the best effort of the Bears, the Bulls have overcome them.
➤ Conclusion: It is now or never for the short trading plan. Another day like today would see me switch camps to the Bulls.

DOW JONES Take advantage of this excellent channel!Dow Jones is trading inside a Channel Up for the past three weeks. With the use of the Fibonacci Channel we clearly see the heavy varience levels within 0.236 - 0.786. We will buy low and sell high for as long as the pattern remains valid.
Trading Plan:
1. Buy on the current 4H candle.
2. Sell at 34300.
3. Buy at 33900.
4. Sell at 34400.
Targets:
1. 34300.
2. 33900.
3. 34000.
4. 33950.
Tips:
1. The 4hour RSI is inside a range that matches perfectly the highs and lows of the Channel. Use it for additional confirmation of entries/ exits.
Please like, follow and comment!!

All To Play For, 15 Feb 2023🖼 Daily Technical Picture 📈
➤ The price reaction post the Inflation data was anti-climatic. Equities started lower but ended higher. Overall, slightly down from the previous day.
➤ Don't be fooled by my chart that has plotted an almost perfect trajectory for the price path thus far. This will most certainly be wrong. I'm no Nostradamus.
➤ For Traders like myself who are holding a short position, the rise over the last three days has not managed to surpass the large down day on 9th Feb. Bulls are finding it tough. Of course, that doesn't prevent prices from surging higher, it just shows that the Bears are still in the game. The game is wide open, it is all to play for.
➤ I would need to see the VIX reverse course quick smart though. It collapsed today. A solid up tick is needed for the Bear thesis to play out.
➤ Conclusion: It is still going to plan.

a little 3:1 shot on us30Expecting a small move on the Dow Jones today, nothing audacious. A 0.8% decline to end todays session. Tell me what you think down below..

Going to Plan, 14 Feb 2023🖼 Daily Technical Picture 📈
➤ Happy Valentine's Day to all my Copiers and Followers! Even if the market is showing you no love, I still will! 😘
➤ Equities moved higher Monday. It was expected but I didn't know to what extent. Nor does it matter unless it moved beyond the levels as set out in my post yesterday: "The Perfect Trade Plan". See related idea below.
➤ Today's aggressive move higher does not alter our plan, if anything, it is going to plan. It can be argued that today's move was pretty meaningless. It was completely encapsulated by the large down bar on 9th Feb, it tells us very little of what happens next. You could further argue that this is a "trap" to allow the big players to exit their holdings or to put on more shorts at a better price. Very much like the bullish price action on 7th Feb. It all has to do with the upcoming main event.
➤ Inflation data Tuesday will almost certainly reveal if the above is true. It will probably also mark the make or break moment for my trade plan. A daily close above 417 on the SPY or if VIX collapses below 17 will force me out of my position with a loss.
➤ Conclusion: Still going to plan.

The PERFECT Trading Plan, 12 Feb 2023🖼 Daily Technical Picture 📈
➤ Here's my plan of attack for the early part of next week if all things go according to plan:
⦿ I am already holding a small short position in the equity market. I'm looking for further downside to play out in the next couple of weeks. The major catalyst is the US inflation data release this coming Tuesday.
⦿ As illustrated on my chart, this is the idealized path I would like to see the price take in accordance to my trade plan. I would like to see the price move flat or higher on Monday. This is very possible given that there might be further buying support flowing on from Friday.
⦿ On inflation data Tuesday, I would like to see equities sell-off. A sufficiently aggressive sell-off will provide me with the opportunity to add to my shorts to a maximum position size.
⦿ I would like to see prices continue falling for the remainder of the week and beyond. The primary price target would be down to 390 on SPY or 3900 on SPX500.
❓What can go wrong?
⤑ A lot. The second worst scenario is that Bulls take charge on the release of the inflation data and drive prices aggressively closing beyond 417 on the SPY or VIX collapses below 17. This will force me out of my position with a loss. Although It won't be disastrous given my small position size.
⤑ The worst scenario is after adding to a maximum position, price reverses aggressively higher beyond 417 on the SPY or the VIX collapses below 17. This will inflict maximum loss.
➤ Conclusion: It nevers goes to plan.

$STLD - bullish trade setup$STLD 6% upmove from 122.50 to 130
Technicals :
1. Monthly - bullish
2. Weekly - bullish
3. Daily - RSI Positive Reverse Divergence
Trade setup :
1. Entry : 122.50
2. Stop Loss : 119.75
3. Risk : 2.75 points
4. Target : 130
5. Profit points : 7.5 points
6. R/R : 2.75 : 7.5 = 1:3

The Last Supper, 10 Feb 2023🖼 Daily Technical Picture 📈
➤ I’m no Trading God, but was today’s price action the Last Supper for the Bulls? Is the free flow of sweet wine about to be cut-off? Not sure if this reference was blasphemous, I plead for mercy.
➤ Equities opened the trading day aggressively higher but by the end of day it was a complete 180° reversal of fortune. What do I make of this?
➤ Clearly, the Bears would be encouraged by today's price action. Price has definitively closed back below the resistance zone. VIX has responded by moving back above 20 from where previous downtrends began in ernest.
➤ The only wrinkle and it may be a very short-term one is that the drop from the recent high is not a change in behaviour. i.e. this drop is nothing out of the ordinary. The two key observations for a change of behaviour are:
➊ out-sized bearish candle/bar or
➋ out-sized drop since the beginning of the intermediate bull trend (since Jan 2023 low)
❌ Neither of these has occurred (when comparing to the drop on 18th Jan). Of course, we just need another bearish day and we will easily fulfill observation ➋
➤ NOTE: A change of behaviour does not mean a trend has ended. It is only a warning sign (the amber coloured traffic light) that something is afoot.
➤ I still hold a small short position.
➤ Conclusion: Plenty of Bulls are drunk, tell them not to drive - translation: just be careful

Dow Jones BIG DECLINE?After my daily analysis of the DJIA, my analyses suggests that us30 is going to decline by 1.8-2% in the next 27hours
Tell me what you think down below..

Lateral Thinking, 9 Feb 2023🖼 Daily Technical Picture 📈
➤ Equities failed to keep the upward momentum. Today, it started lower and finished even lower. Despite that, the price action was not really meaningful. In technical speak, today was an example of an "inside" day, where all the price action was situated within the shadows of yesterday's large bullish bar. Therefore, we are none-the-wiser to what tomorrow brings.
➤ I hope through my daily communications with you, you are starting to get a better feel of my approach to trading. I'd like to think that I bring a form of lateral thinking. This is my trading edge afterall.
➤ That being said, I'm thinking quite literally that markets have a high chance of moving more laterally. Price is trapped around the resistance zone. So far, there is nothing specific in the price action that displays immediate signs of a trend reversal lower. It just looks like the market is biding it's time prior to making the decisive move. The more it trades side-ways, the greater the odds of the market moving higher.
➤ I hold a small short position.
➤ Conclusion: I hope my thinking is wrong.

DOW JONES Scalping range emerged and our medium-term plan.Dow Jones (DJI) got rejected yesterday following Powell's speech as the Resistance Zone of 34300 - 34370 held (August 16 and January 15 Highs respectively), we expect it to turn neutral for a while and trade sideways within the rough 33640 - 34180 Scalping Range illustrated on the chart.
The 4H MA50 (blue trend-line) has assumed the role of the Pivot and the 4H MA200 (orange trend-line) that of the Support. Our short-term trading plan is to scalp this range for as long as the price remains/ re-enters inside it. On the more medium-term, above the green Pivot Zone we are buyers targeting 34300, while below the Higher Lows trend-line we are sellers targeting 32700 (above the 32480 Support). Similarly, we will take the buy break-out if the price breaks the 34370 January 15 High and target the 34910 December 13 High.
Keep in mind that this Higher Lows trend-line is what helped us take this accurate buy entry 3 weeks ago as you can see on the chart below:
-------------------------------------------------------------------------------
** Please LIKE 👍, FOLLOW ✅, SHARE 🙌 and COMMENT ✍ if you enjoy this idea! Also share your ideas and charts in the comments section below! **
-------------------------------------------------------------------------------
💸💸💸💸💸💸
👇 👇 👇 👇 👇 👇

Bulls Never Say Die, 8 Feb 2023🖼 Daily Technical Picture 📈
➤ Equities went full Bull mode today despite some intra-day volatility. It looks like it wants to surpass the recent high.
➤ There's really only one thing that could stop it and that is the super overextended nature of this Bullish move since the Oct 2022 bottom. Perhaps it is not really "stoppable". It may just be some lateral price movement to work off the exuberant enthusiasm prior to jumping higher.
➤ I am still holding my small short position until I get the exit signal to get out. For example, a daily close above the recent peak will definitely do that.
➤ Conclusion: Optimism may fade but it usually comes back. It rarely dies.
