DJIA, A comprehensive analysis from 1932 to 2022 ! Whats next?Hi great followers, traders and investors !
Today, We analyzed one of the most important indices in US market. I decided to record a video since I thought that it may be difficult to show what I am thinking in writing. In fact, I wish to transfer my idea better by this video.
In this video, We investigate Worst, Moderate and Best case Scenarios. We analyzed the index from 1932 to 202022 and discussed different possible scenarios. We can never predict the future without looking to the past.
As I told in video, what I currently suppose to be the most likely scenario is the moderate one, but we have to keep in mind that other scenarios even bullish one is possible therefor, we have to be open-minded and be ready for all possibilities.
Good Luck every body.
Djia

Trapped II 30th Sep 2022🖼 Daily Technical Picture 📈
➤ The sequels just keep coming...prices are still stuck in the narrowish support and resistance levels for the S&P500. This time ending right at the support level in contrast to the previous day. If you get the feeling some one is trying to shake you out, that's exactly what it looks like. That being said, a break to the downside would negate this theory.
➤ For the bullish case, I need to see the VIX contract and contract quickly, ideally back below 30. If it's sticky above 30 like the current state of inflation, we probably will see further downside.
➤ My current exposure is +60% composed of Nasdaq, STOXX50 and DAX. The maximum portfolio exposure is +/- 200% on capital, the level of highest conviction.
➤ Conclusion: End of month window dressing please!

Trapped! 29th Sep 2022🖼 Daily Technical Picture 📈
➤ Another hugely volatile day. Pre-market conditions were looking disastrous as US indices were south of 1% and European indices were down over 2%. A complete turnaround occurred as bond yields reversed lower. Bond yields have become unhinged and forced central banks to step in to try and control the situation. We should expect such volatility at market extremes but it doesn't make it any easier to sit through.
➤ The bounce off the support level meant prices moved up to the previous support level now acting as resistance. Price is currently trapped between these levels. This may be temporary as prices seem to want to bounce more to least close the last major price gap.
➤ I added a long NASDAQ position. It is acting stronger than most indices having not broken the yearly low. I still hold positions in DAX and EUSTX50 . My exposure is +60%. The maximum portfolio exposure is +/- 200% on capital, the level of highest conviction.
➤ Conclusion: Looking for further bounce to relieve extreme oversold conditions.

Ym1! How to trade #daytrading DOW JONES FUTURES How can we use simple indicators to trade??
I Use 1 minute Chart of Mini dow futures contract
the add #supertrend indicator + visibe range volume profile and you can use any #occilator
#trendanalisys #chartpatterns #tradingview #trading #stocks #sp500 #stocktrading #dojones
#forex,#tradingroom,#daytrade,#daytrading,#dowjones,#nasdaq,s&p500,#trade,#nyse,#crypto
$spx $ES_F $DJIA $DJ_F $COMPQ $QQQ $SPY

US30 28th SEPTEMBER 2022Wall Street is increasingly concerned that the Fed's six-month inflation fight will push the economy into recession. The recent selloff seems to be the catalyst, including the US central bank (Federal Reserve/The Fed) being aggressive to raise interest rates. Finally shaking up the currency market.
With the dollar overvalued in recent weeks, market participants are likely to avoid the risk of a correction by moving into large companies that are likely to survive a recession.
US30 23rd AUGUST 2022

The Last Defence III, 28th Sep 2022🖼 Daily Technical Picture 📈
➤ No prize for those of you who guessed the title of today's update. It's growing a bit tiresome. As in previous days, prices opened higher and ended lower. As suspected, with VIX moving higher, S&P500 set a new yearly low in the process but was able to close above the support level.
➤ This tiresome behaviour may bring about some Bullish respite. As prices have continually tried to break the support without any convincing level of success.
➤ Further clues for a bullish bounce comes from my long/short equity trading. I trade the components of the Dow30 (DJIA). Some of these stocks are intensely oversold and I entered a long position in one stock.
➤ I also entered small long positions in DAX and EUSTX50. My exposure is +40%. The maximum portfolio exposure is +/- 200% on capital, the level of highest conviction.
➤ Conclusion: I have dipped my toes in to test the waters. May Last Defence III reign long.

DOW JONES Oversold but that alone not enough for a buy------------------------------------------------------------------------------------------
** Please LIKE 👍, SUBSCRIBE ✅, SHARE 🙌 and COMMENT ✍ if you enjoy this idea! Also share your ideas and charts in the comments section below! This is best way to keep it relevant, support me, keep the content here free and allow the idea to reach as many people as possible. **
------------------------------------------------------------------------------------------
The Dow Jones Industrial Average (DJI)broke and closed last week below its 1W MA200 (red trend-line), for the first time since the week of May 11 2020, a very bearish sign on its own. Based on what the index did on May 09 2022 after breaking the previou Support (Double Bottom), the price now targets the -0.236 and -0.5 Fibonacci extensions on the medium-term.
Being however oversold with the 1D RSI hitting 24.85 yesterday for the first time since the COVID crash (March 12 2020), there is an equal probability of a short-term rebound or even a medium-term one if this is a temporary bottom like June 17. With signals on the higher and lower time-frames being mixed, the oversold RSI state isn't enough on its own to take the buy. It would be best to do so after a confirmation pattern.
The two strongest confirmation signals at the moment are:
1) When the 1D MACD makes a Bullish Cross, which since December 07 2021 always delivered a short-term rally.
2) A closing above the 0.618 Fibonacci level (now at 31357).
If you take those buys, you will have some ground behind them. Otherwise the are within the 0.618 and yesterday's lows gives a mixed sentiment. Below yesterday's lows, most likely we will see further strong selling, initially targeting the -0.236, as mentioned, at 28230.
------------------------------------------------------------------------------------------
You may also TELL ME 🙋♀️🙋♂️ in the comments section which symbol you want me to analyze next and on which time-frame. The one with the most posts will be published tomorrow! 👏🎁
------------------------------------------------------------------------------------------
👇 👇 👇 👇 👇 👇
👇 👇 👇 👇 👇 👇
👇 👇 👇 👇 👇 👇

The Last Defence II, 27th Sep 2022🖼 Daily Technical Picture 📈
➤ Bulls are being tested for the second day. This time, prices were not supported at higher levels and finished the trading day near the lows. VIX leapt higher again. Things are looking pretty ominous.
➤ I don't know if it's good news or bad news but the daily trading volume is moderate. Although elevated it hasn't really spiked. A spike could signal big players absorbing the selling especially if prices didn't move much on the day. On the other hand, no spike could signal the sellers are not done selling.
➤ My exposure is currently 0% with no positions. The maximum portfolio exposure is +/- 200% on capital, the level of highest conviction.
➤ Conclusion: I can see potential buying opportunities but I am waiting to for some sort of VIX contraction.

The Last Defence, 26th Sep 2022🖼 Daily Technical Picture 📈
➤ Crucial week ahead for the Bulls to defend the yearly lows. First defensive effort was mounted by the Bulls to finish Friday trade away from the daily low. Price gapped down below the 2nd last level of support. The close of the candle points to continued bearish behaviour in the very short-term.
➤ VIX spiked over 30 again. There is certainly panic selling. The question is if the panic is just starting or will it recede? Further panic will most certainly break the yearly lows. That may snowball.
➤ European markets like the DAX have already succumbed to new yearly lows.
➤ Since I theorised for the Bullish case in my last post, let's talk about the why there is no bottom in sight:
● Employment numbers are still relatively strong.
● Property prices are hovering at all time highs
● Lack of bankruptcies
● Strong US Dollar is creating havoc, Asian and EM currencies have collapsed below multi-decade lows. Currency intervention by Japan and Korea most recently.
● Interest rates moving upwards fast in an unconstrained manner
➤ Some of these factors are starting to jolt a panic response. Others are yet to even show their hand. There are plenty of things that haven't even broken. Somethings need to break for a true bottom to form.
➤ My exposure is currently 0% with no positions. The maximum portfolio exposure is +/- 200% on capital, the level of highest conviction.
➤ Conclusion: Still waiting on the sidelines. Eager to get back in the action but only the right time! 💯

IXIC, You may find this analysis helpful in future !Is this another bear market rally? or just we are at the early stages of new massive bull run?
Since hitting 10565.14 low ( which was in 0.5 _ 0.618 Retracement zone of previous major rally from pandemic low to ATH ) , IXIC has started a promising rally for bulls. Is this low market's bottom? It might be, but lets review a contradictory yet valid scenario :
First of all I should emphasize this proposed scenario is not a fact and is just a possibility . I have to repeat again : " when we are in world of Elliott waves we are dealing with possibilities not certainties ".
As shown on the chart, Previous major decline from 16212.23 to 10565.14 can be labeled as impulsive 5 legs down going wave. Normally, we have a counter trend correction after an impulsive wave therefore, recent rally may be just a big counter trend correction bear market rally. Why I used normally ? Since there are some alternatives for this scenario which are beyond scope of this publication . Please remember : " Possibility vs Certainty "
Mentioned five legs down going impulsive wave can be labeled as wave 1 or A which implies for a counter trend correction as wave 2 or B . Strong resistance zone formed by 0.5 and 0.618 Retracement levels has been shown on the chart. This zone is also a valid supply/demand zone. In addition, my private Gann Box analysis confirms this zone as a strong resistance ( I excluded Gann Box from the chart to keep it as clean as possible).
200, 100 and 50 weeks moving averages have been also shown on the chart. As we see, 200 weeks moving average which supported the market at pandemic low was market savior one more time at last major low. 100 and 50 weeks MA s are waiting for the index at our proposed resistance zone. This makes our resistance zone even stronger.
If true, Worst has yet to come as wave 3 or C. If we are going to see wave 3 then may god bless the market.
Please note this is not to frighten anyone especially bulls or giving hope to bears. This is just an analysis which shows a valid possible scenario and I can strongly recommend you to keep this scenario in mind.
I Hope this analysis to be helpful and wish you all the best.

Double Bottom? 23rd Sep 2022🖼 Daily Technical Picture 📈
➤ There's very little insight I can provide with the current price action. VIX is stuck at elevated levels and not moving anywhere. Price is moving lower to the support levels. If you weren't already in a short trade, it isn't the best place to start. If you are looking to buy, prices could continue to move lower. 🤷♀️ Risk to reward for new trades are probably in no one's favour.
➤ So, let's instead theorise about a Bullish case at this moment in time.
● War in Ukraine is further entrenched with more troops deployed by Russia. The West will counter.
● Interest rates are going to rise further to 4% or more
● Demand destruction is everywhere. Jobs being lost, company profits falling, consumers tightening. We are looking at a hard landing.
● China is dealing with Covid lockdown fatigue and real estate woes
➤ With all these ugly headlines, S&P500 is still holding above the 17th June low. Has the market sufficiently priced in these outcomes?
➤ On the technicals: You could argue that the leg down from15th Aug is a much less aggressive move than the April down leg. It's a gentler slide in prices. VIX is reflective of this by being stuck at a comparatively lower level.
➤ Given these conditions continue to hold, price could form a classic double-bottom and a major bullish move is not far off in the distant future.
➤ My exposure is currently 0% with no positions. The maximum portfolio exposure is +/- 200% on capital, the level of highest conviction.
➤ Conclusion: Still waiting on the sidelines. Eager to get back in the action but only the right time! 💯

It Broke Down, 22nd Sep 2022🖼 Daily Technical Picture 📈
➤ Equities decided break down but that's not what I'm concerned about. It's the VIX...has it literally broken down❓ 🛠 Apart from spiking to the panic level to 30 (as I define it), it did very little on a big down day.
➤ Perhaps VIX does make sense within the context of the price action. As prices have moved consistently lower, VIX has been elevating in a steady manner and just touched panic levels post FOMC announcement. If we look at the 3 big bearish candles since the 16th August peak, today's candle was the smallest. This contraction in the size of the candle is probably the only good news for the Bulls and is preventing a huge panic move (so far).
➤ We should also note that the recent price gap was essentially closed due to a price spike...I'll stop with the Gap jokes too.
➤ I stayed on the sidelines and look to do so a bit longer given VIX's unconvincing behaviour.
➤ My exposure is currently 0% with no positions. The maximum portfolio exposure is +/- 200% on capital, the level of highest conviction.
➤ Conclusion: Price is heading toward support. Will the buyer step in?

No Persons Land, 21st Sep 2022🖼 Daily Technical Picture 📈
➤ Prices held above the immediate lows but overall still drifting lower. It is stuck in between support and resistance zones. This is fitting behaviour given the USD Fed Interest Rate decision on Wednesday afternoon.
➤ VIX is not giving much away. Still trading below the recent peak but at elevated levels.
➤ Market makers and intra-day traders must be enjoying the erratic market movements. Prices haven't really gone anywhere these couple of days but volatility is high. I'm happy to stay on the sidelines and avoid being whipsawed.
➤ My exposure is currently 0% with no positions. The maximum portfolio exposure is +/- 200% on capital, the level of highest conviction.
➤ Conclusion: Fed decision will not only decide on the level of interest rates but also the next level prices will move: to support or resistance.

Bitcoin Price Action vs. Fed Announcements & US Dollar StrengthThis is an analysis of Bitcoin's price action before and after Fed announcements on the daily time frame and the affect the US Dollar index has had on the markets. Since Bitcoin hit its all-time high in November 2021, the growing strength of the US Dollar has put a relentless downward pressure on global markets and currencies (and Bitcoin/Dow Jones/Precious Metals were no exception).
Every time BTC dumped since the $69k high, it dumped hard. 50% from Dec-Jan and again in Apr-June. The months between then often ended where they started before the next fed announcement. Which leads us to the announcement tomorrow where the Fed is expected to raise rates 75bps (80-90%) up to 100bps (10-20%). This could cause the DXY to continue to rise and put further pressure on the markets sending them to new lows. However, I will say that Bitcoin has started to fight the inverse relationship it has had with DXY and I can see the bullish divergence forming. If this is a local top for the DXY, we should see a temporary opportunity for a relief bounce, but the key word should be temporary. As a result, I have taken a very defensive position either in USD searching for oversold conditions in which to make a short-term scalp.
Trade carefully friends!

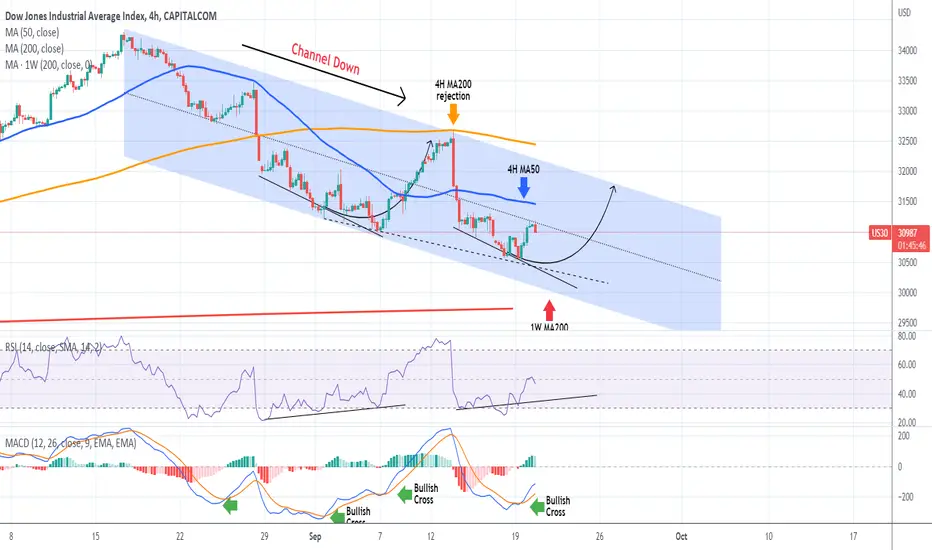
DOW JONES The dominant short-term Channel. What it shows next.The Dow Jones Industrial Average (DJI) is currently pulling-back as yesterday's rebound has failed so far to break the Channel's median. That is the Channel Down, the dominant pattern, that the index has been trading in since the August 16 High. As you see that middle trend-line has been holding a key role within this pattern.
The current price action resembles the accumulation mini phase of September 02 - 07, where the price was supported on a Lower Lows line that eventually pushed it above the 4H MA50 (blue trend-line) and the Channel's middle, to rise to the top of the Channel, eventually getting rejected on the 4H MA200 (orange trend-line).
With the 4H MACD on a Bullish Cross, we are expecting Dow to reach 31700 and make a new Lower High within the Channel Down within a 1 week horizon.
--------------------------------------------------------------------------------------------------------
** Please support this idea with your likes and comments, it is the best way to keep it relevant and support me. **
--------------------------------------------------------------------------------------------------------
Feeling the Gap, 20th Sep 2022🖼 Daily Technical Picture 📈
📉 GAPs are unfashionable and it tends to get closed. Well, that gap has almost closed and I'm not FEELING great!
➤ Big reversal in markets as equities bounced after once again gapping lower at open. Price is heading back to the support level (that should be re-labeled as resistance).
➤ I had strong convictions that the gap will be filled. Despite that, I quit my long positions at a loss. This was to protect capital as I saw the possibility of a binary outcome: either VIX would explode higher or collapse lower. I don't like binary outcomes despite being only 40% wrong most of the time!
➤ As a result, I'll be watching from the sidelines until after the Fed rate decision on Wednesday. I'll get over the loss by then.
➤ My exposure is currently 0% with no positions. The maximum portfolio exposure is +/- 200% on capital, the level of highest conviction.
➤ Conclusion: Looking forward to the next profitable trade opportunity and learning from another loss.

Bounce? 16th Sep 2022🖼 Daily Technical Picture 📈
➤ Price again held in the support zone with VIX also contracting from the short-term peak. I'm looking at this as a reply of mid-May. The difference is that VIX was in the panic zone back in May and the move down prior to the bounce was much longer in duration. Maybe I should call it a "mini-mid-May" - MMM. If I am correct I hope the resulting bounce is not mini-sized.
➤ Given the above view, I took profits on the remainder of my short US index positions and switched to a max. conviction long in S&P500, DJIA and NASDAQ. I still hold small shorts in DAX and EUSTX50 given their different price structure.
➤ My overall exposure shifted to +100%. A moderate level of conviction at a portfolio level. The maximum exposure is +/- 200%, the level of highest conviction.
➤ Conclusion: I'm looking for a bounce. Prices may hesitate prior to a bounce and may at times look like falling further. I will not hesitate to pull the pin on my position if prices do break down.

Back to Square One, 15th Sep 2022🖼 Daily Technical Picture 📈
➤ Same working title as yesterday. Prices are still at square one. There was hardly any bounce but prices managed to hold support. The market is not giving much away about its next move...
➤ I have closed the long positions in DAX and EUSTX50 (STOXX50) and have reversed to a small short position (-10% exposure each). This small exposure reflects a lower conviction trade. A high conviction position is a maximum +/- 40% exposure in a single index.
➤ As mentioned previously, based on my analysis, the European & US indices are at different places in the price structure. During these phases, we may experience an inherently hedged portfolio like yesterday where overall exposure was neutral and we have opposing positions. This will resolve itself as the indices play catch up and re-sync given their high correlations.
➤ My overall exposure shifted to -60%. Low conviction at a portfolio level. I still hold shorts in S&P500 and DJIA. The maximum exposure is +/- 200%, the level of highest conviction.
➤ Conclusion: I think Thursday's price action may provide a telltale sign. If price bounce or hold support again, I would be leaning towards a return to a bullish stance.

Back to Square One, 14th Sep 2022🖼 Daily Technical Picture 📈
➤ A momentous day in markets, momentous to do downside that is. All the up momentum was snuffed out today. Prices in S&P500 have dropped back to the support level. As I previously mentioned, there were subtle hints of a drop. The big surprise is the degree of the drop we just experienced.
➤ The only good news is that prices have hit support levels. This could lead to a rebound of some kind. Also mentioned a few updates ago, this support level has never been a firm one. Prices have sliced through easily at times. IMO, this level may just hold.
➤ I reduced my short positions in SPX500 and DJIA to take some profit. I still hold DAX and EUSTX50 long positions. This meant I ended the day with my exposure at 0% (or neutral). I am hedged to a large degree. Profits or losses will stem from the degree that US markets out/under perform European markets. The maximum exposure is +/- 200%, the level of highest conviction.
➤ Conclusion: Downward bias worked in my favour. Both my portfolio and equity price levels are back to square one. I'm eager to see what happens next.

Deceleration, 13th Sep 2022🖼 Daily Technical Picture 📈
➤ Equity markets leapt higher towards the 4200 resistance zone. The upward acceleration is decelerating as seen by the size of the candle/bars since the progression from the higher low. This is either because of less buyers or more incoming sellers. The VIX also increased by a small amount.
➤ These are subtle hints of change in behaviour that we should take note. Whether this has to do with profit taking or imminent important economic data, we will know after the fact.
➤ I added short positions in SPX500 and DJ30 whilst still holding DAX and EUSTX50 long positions. As a result, my exposure has switched to net-short of -40%. This is an overall low but conflicted conviction level. The shorts are high conviction, the longs low. The maximum exposure is +/- 200%, the level of highest conviction.
➤ Conclusion: I am hedged but with a downward bias. Hedged positions are rare. It points to different equity market structures in different regions. This normally resolves itself and re-sync overtime due to their high correlations.

Re-testing Time? 12th Sep 2022🖼 Daily Technical Picture 📈
➤ Equity markets continued to bounce and bounce hard from the support level. It is looking very orderly, VIX is dipping in concert. It is seeking to re-test the 4200 level once again.
➤ It is unclear to me if prices will take a detour prior to the re-test in terms of a short-term reversal or the Bears are happy to wait to apply pressure only at the key resistance level.
➤ I halved my DAX and EUSTX50 positions. My overall exposure is +40%. This is a low conviction level. The maximum exposure is +/- 200%, the level of highest conviction.
➤ Conclusion: Bulls in control. Re-test imminent. Will the Bears re-assert themselves and break the confidence of the Bulls?

Game Over for the 100+ Year Economic Super-CycleDJIA. Just look at it, is it not funny how correlated everything looks on a 100+ year chart?
We are the the top. Can we this time get through the historically impossible resistance?
Knowing JPow, when market drops 10-15% he will spin up the BRRRRRRR into panic overdrive and we'll blast right through the final resistance line into pure hyper-inflationary environment where %age growth does not matter anymore, up_only.
Given that USA debt will shortly be $30 Trillion, if .gov bond rates would be at ~5% then that would be $1.5 trillion in interest payments on debt alone, or about 40% of the $3.71T tax revenue in 2020. Everyone knows that anyone who pays 40% of income just on interest, is bankrupt beyond all hope.
This is why USA will keep the interest rates low, there is no other way, regardless of what inflation does, and in order to so, the Fed gotta do BRRRRRRRRRRR, the markets will pump in nominal terms while inflation eats the actual profits. Deflation is the enemy of the state, because with deflation, large debts become non-serviceable, and as you know (if you been paying attention) that all money is debt that is loaned into existence. If the human civilization was to pay back all of its debts, there would be no money left, and we would still owe the interest. We are forced to perpetually borrow ever more to pay existing debts and interest. Inflation is designed into the current system. Hyperinflation is the inevitable end game. All (fiat) money is debt-- Sounds like double-speak, but such is life in the current financial system.
After a little dip to scare JPow to print MOAR, we should eventually break the top ultimate resistance line on DJIA, and move into a new paradigm of perpetual up & only up, which will be exponential and approach the current economic systems end-game at light speed.
--------------------
For over 100 years, the most capitalistic things of them all: the mediums of exchange- money and the value of money (the interest charged on $$$$), has been "carefully" centrally managed, controlled by The Powers That Be (and competition has been forbidden).
We are entering a new era, where medium of exchange systems compete with each other in capitalistic fashion, where people are free to choose in what medium they want to transact in, maximizing their own benefit. This does not sit well with the current TPTB, because they have seemingly effortlessly been able to reap incredibly disproportionate rewards by controlling the medium of exchange in communist fashion (centrally controlled by decree). TPTB do not even care about the money itself, since TPTB can create unlimited amounts, enough to buy the whole world, at any price and any time; they care only for control. Losing control creates panic, losing comfort creates panic, losing relevance creates panic. The Powers That Be are in full panic mode to maintain the status quo and their communistic cartel monopoly. With the current TPTB financial system collapsing, watch TPTB try to appear as the grand saviors with new "better" economic system, veiled in virtue and "good" intentions, but the systems will be even more communistic and centrally controlled, the intention has always been to maximize control.
Cryptocurrencies will help to change the world by offering alternative medium of exchanges that TPTB will not be able to easily control, but Bitcoin will not be part of it. Bitcoin can not be part of the revolution in its current state of measly 7 transactions per second, $50 txn fees during high network congestion and high energy cost. Somewhere, someone will figure out a solution to an energy efficient, decentralized, scalable, anonymous, non-inflationary, instantaneous medium of exchange for the entire planet, the greatest competitor the FIAT currencies will ever see. With the greatest competitor appearing, people will start abandoning the USD and Fiat currencies. While Fiat will not be abandoned entirely, it will finally have competition, and people will have a choice to opt out of debt slavery that's been forced upon them for 100+ years of central banking & inflation. We, the people, will have a choice we have never had.
Inflation of the money supply is a hidden tax on responsible savers where capital creation is forbidden in practice (but allowed in name) for common folk, because capital is eroded through inflation, forcing people to go to the big banks (instead of lending/borrowing person to person at their own interest rates (value of money)) in order to beg the banks for a loan, keeping the big banks and the parasitical TPTB forever relevant. The new era of competition in mediums of exchange will open the door for democracy and capitalism in the ultimate sense, where behind the scenes dictators who install puppets every 4 years will no longer be able to finance wars and their covert schemes through centrally controlled money printing at the expense of the human civilization. Competing, instantaneous, world-wide, independent mediums of exchange will be the Greatest Liberation in the History of Human Civilization.
Enjoy the Dow Jones Industrial Average blow out of the final resistance zone after a small reversal.
Enjoy the Dow Jones Industrial Average eventually become increasingly meaningless as it fails its purpose to serve as a useful indicator in a hyper-inflationary world.
Enjoy the future where you no longer are a debt slave.
Enjoy the Freedom that is coming soon.
We are close to the end game.

McDonald's MCD - I'm Lovin' Selling, and You Should be tooYou don't see just how highly priced McDonald's still is unless you look at it on the Monthly:
I mean, this is the place that sells faux-food while CPI and PPI are through the roof, and it's still trading almost at its all time high. This is even more ridiculous than the positioning of Apple AAPL:
Apple AAPL - Looks Fine on the Outside, but Tastes Weird
And Tesla TSLA:
Tesla TSLA - The Canary in the Coal Mine
On top of that, this is one of the thirty companies that compose the Dow, which is the most bearish of all indexes, having already retested the pre-COVID highs, which SPX and Nasdaq have yet to do.
The bottom line for everyone's least favourite, but most convenient, fast food dumpster fire is that the June --> August price action, was, like Apple, just a gap fill.
And now, it's time to seek new lows. And those lows happen to be, conservatively, in the $245 range.
This is a fat put if you buy puts, but a "my calls expired worthless so at least I can sob about my drawdown on Reddit" scenario for Robinhood's retail fodder.
I can only encourage everyone who is still long on equities to get out this week. I truly believe that we are going to see a bounce that traps bears short but snares bulls long:
SPX / ES - Bull Whips and Bear Saws
With a looming VIX 72 (hasn't done much since COVID! It's two years! It's due! Be careful!) hanging overhead.
VIX - 9x8 = 72
What lies ahead, after the trap has been executed, will come fast, and viciously, and it will seem as if the world is ending. If you buy when it's high because you are still thinking to yourself that this is the old paradigm, you're going to lose at least one finger, and probably three.
This world is not one where you can use magic to regrow what's lost, you know?
And so what I want to say is that you should protect what you have. If you can't get short, if you can't trade puts, then get cash heavy and reduce your risk.
Ultimately, what's important in life is not money, which when you die you leave behind. It is maintaining your kindness. It is harbouring your virtue.
This isn't moral dogma, unless you make it moral dogma. The path through the storm is to do better in your life. Been neglecting family? Fix it.
Been a bad father? Fix it.
Been a bad boss? Buy the secretary flowers and tell her that she's doing a great job. Make sure you mean it. You aren't such a bad guy. Make sure you mean it. Try your best.
One day, in this lifetime, when the Chinese Communist Party falls, you'll instantly understand what I am referring to.
Don't leave yourself with regrets on that day. That day is too late. You have to figure it out and do well before that day.
It's just like poker, where you have to place your bets before the cards are face up. It doesn't count anymore after the cards are face up.
