Selling rallies in US30USD following NFP beatUS30USD - Intraday - We look to Sell at 31991 (stop at 32442)
The medium term bias remains bearish. There is scope for mild buying at the open but gains should be limited. Previous support at 32000 now becomes resistance. Resistance could prove difficult to breakdown. Preferred trade is to sell into rallies.
Our profit targets will be 30952 and 30700
Resistance: 32000 / 34200 / 36900
Support: 30950 / 29800 / 27000
Risk Disclaimer
The trade ideas beyond this page are for informational purposes only and do not constitute investment advice or a solicitation to trade. This information is provided by Signal Centre, a third-party unaffiliated with OANDA, and is intended for general circulation only. OANDA does not guarantee the accuracy of this information and assumes no responsibilities for the information provided by the third party. The information does not take into account the specific investment objectives, financial situation, or particular needs of any particular person. You should take into account your specific investment objectives, financial situation, and particular needs before making a commitment to trade, including seeking advice from an independent financial adviser regarding the suitability of the investment, under a separate engagement, as you deem fit.
You accept that you assume all risks in independently viewing the contents and selecting a chosen strategy.
Where the research is distributed in Singapore to a person who is not an Accredited Investor, Expert Investor or an Institutional Investor, Oanda Asia Pacific Pte Ltd (“OAP“) accepts legal responsibility for the contents of the report to such persons only to the extent required by law. Singapore customers should contact OAP at 6579 8289 for matters arising from, or in connection with, the information/research distributed.'
Djia

Bearish DJIA hidden divergenceThe Dow Jones is still in a downtrend even though we had the recent bullish pullback an this is evidenced by the formation of hidden divergence. The formation of hidden divergence usually means a continuation of the established trend will continue. The red lines on the price action and on the MACD, give you the setup. My target would be 31,000 and then 28,750
The COT shows the Non-commercials are short.

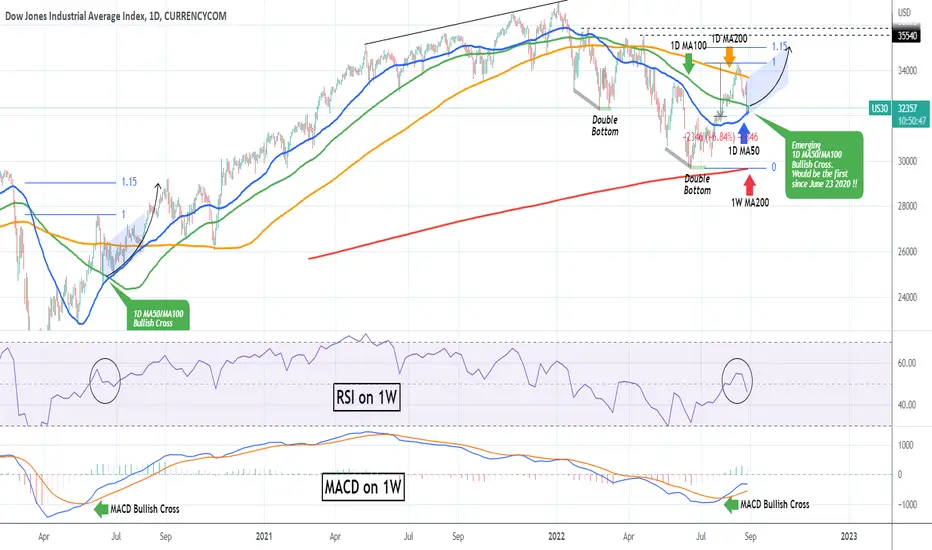
DOW JONES holding the 1D MA50 in a repeat of the COVID recovery!The Dow Jones Index (DJI) hit the 1D MA50 (blue trend-line) yesterday and today shows the first signs of recovery. The drop from the August 16 High has been substantial, almost -7% but so has the rise since the June 17 low (more than +15%), so profit taking was natural, especially since the High exceeded the 1D MA200 (orange trend-line). The first Resistance on the short-term is the 1D MA100 (green trend-line) which is being tested at the moment.
On the long-term though, this pull-back to the 1D MA50 after such a strong rally, resembles the initial recovery of March - June 2020 from the COVID crash. Especially considering also that the RSI and MACD on the 1W time-frame have been printing identical patterns, with the MACD being on a Bullish Cross since July 27 as it did on May 22 2020!
From June 15 2020 to July 21 2020, the 1D MA50 held as Support four times and it catapulted Dow to the 1.15 Fibonacci extension. A repeat of that pattern sets the current medium-term target exactly on the 35000 level. Notice also that as on June 23 2020, Dow is currently close to having the 1D MA50 cross above the 1D MA100, which is a Bullish Cross formation and that would be the first time since then!
--------------------------------------------------------------------------------------------------------
** Please support this idea with your likes and comments, it is the best way to keep it relevant and support me. **
--------------------------------------------------------------------------------------------------------
Dow Jones Industrial Average 15 Min. Chart AnalysisDow jones industrial average 15 min chart analysis shows a simple chart pattern.

SPX, Rate hikes and market rally !! lets share ideas.FED started rate hikes this year and so far has increased interest rate up to 2.25 %. When there was just some news about starting rate hikes market showed a sever bearish sentiment and huge decline started. Now and after 2.25 rate hike market sees 8.5 % inflation as a positive sign !!.
8.5 % is much much higher than 2 % target of FED and implies for continuation of the rate hikes. At least we know that FED will increase at minimum another 0.5 on 21th Sep . Today there were some statements by Charles Evans Chicago FED president that interest rate will be 4% at the end of next year and still market is green.
Inflation data and FED decisions are interpreted to be the market drivers since start of this year but is this true?
Numbers shown on the chart are cumulative interest rate after FED decisions. As we can see SPX today and after 2.25 interest rate is just about 2.5 % down from the day FED raised rates to 0.75 !. Strange !. Can we see higher SPX on 21th Sep ? Is it rational?
Some take this as a positive sign for the market : (( FED finally stops rate hikes next year )). OK but rate was not supposed to go higher and higher forever. It was known from the first day that FED will stop rate hikes some day.
In terms of macroeconomics, Russia -Ukraine war continues, China may invade Taiwan, Iran's nuclear deal result is unknown. Add some giants like NVDA, AMD and MU warnings to this economical climate and please let me know if you can find any positive sign.
What is actual driving force of market? It seems taking interest rates and FED actions into consideration leads to contradictory results. So, what is behind all these market moves?
What do you think about recent market rally? is it just a bear market rally or real bull run has been started from last major low?
What is your idea? Lest share our ideas and boost our knowledge.
Eager to hearing your thoughts.

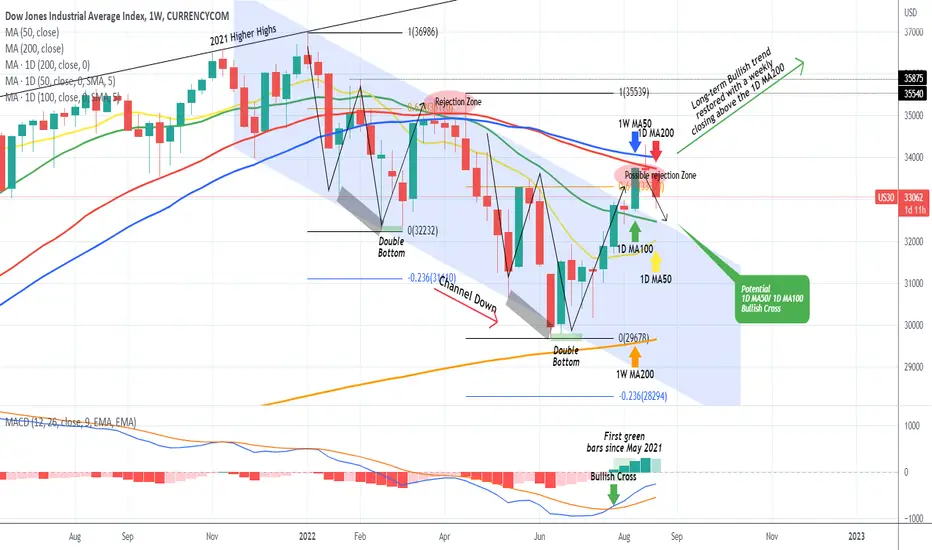
DOW JONES rejection finding Support soon.Exactly 2 weeks ago on our last Dow Jones (DJI) analysis we stated that the price had entered a possible rejection zone (red) and unless it closed a weekly (1W) candle above the 1D MA200, we would get a pull-back:
Well as it turned out the index closed last week below both the 1D MA200 (red trend-line) and the 1W MA50 (blue trend-line), which are very close to each other, and got a considerable rejection this week. The price is now approaching the critical Support cluster that consists of the 1D MA100 (green trend-line) and the 1D MA50 (yellow trend-line). The chances of getting a new bounce are high as not only are wee on a 1W MACD Bullish Cross since late July but also the 1D MA50 is about to cross above the 1D MA100, forming a Bullish Cross. Last time that happened was on after the June 15 2020 1W candle, which was the first recovery from the March 2020 COVID crash:
As you see, the 1D MA50 and 1D MA100 held as Support levels and Dow was able to sustain a solid rise. Technically there is no reason not to expect a similar development but in order to technically claim that the index is back onto the long-term bullish trend we need to see a weekly candle closing above the 1D MA200.
--------------------------------------------------------------------------------------------------------
** Please support this idea with your likes and comments, it is the best way to keep it relevant and support me. **
--------------------------------------------------------------------------------------------------------
US30 23rd AUGUST 2022Investors are still anticipating Fed Chair Jerome Powell's latest comments on inflation conditions and potential interest rate hikes during the US central bank's annual economic symposium to be held in Jackson Hole, Wyoming next Friday (26/8). Fed Chair Powell is likely to sound much more hawkish during his speech in Jackson Hole on Friday (26/8) at 10am than he did at his July 27, 2022 press conference, when he said the Fed Funds rate was back to neutral.

DOW JONES rejected on the Golden Ratio. What's next?The Dow Jones index (DJI) broke above its 1D MA200 (orange trend-line) early this week but got rejected on the 0.618 Fibonacci retracement level (from its January 05 All Time High (ATH)). Failing to hold the 1D MA200 as a Support, can result into a short-term pull-back to test the lower Fibonacci levels (0.5 and 0.382) as well as the 1D MA100 (green trend-line) and 1D MA50 (blue trend-line) as Support.
This short-term technical correction, shouldn't change the long-term trend-line, which after the huge 1W RSI bounce and the +15% rally since the June 17 low, has turned bullish. Even fundamentally, this market rally was supported by the first significant retrace on the Inflation Rate (black trend-line) and coincided exactly with the top on the US10Y (teal trend-line). So as you see, the rally had strong fundamental drivers, especially the US10Y, whose late sustainable rise since August 01, seems to worry the stock markets. A new peak there, can mark the new low on Dow.
Also, notice that all prior 1D MA200 break-outs since February 01, failed to create a sustainable continuation and if we connect those tops with two trend-lines, we can see the solid technical Resistance that Dow Jones needs to overcome in order to be able to post a sustainable bullish trend long-term into the new Bull Cycle.
P.S. Because the chart has the added elements of the US10Y and Inflation Rate plotted and are not constant, it may appear distorted based on your screen's/ browser dimensions. The original looks like this below, so if yours doesn't, adjust the vertical/ horizontal axis in order to make it look like this and better understand what is illustrated:
--------------------------------------------------------------------------------------------------------
** Please support this idea with your likes and comments, it is the best way to keep it relevant and support me. **
--------------------------------------------------------------------------------------------------------

DJIA showing technical strengthThe Dow is at a technical resistance level with a strong support level beneath the most recent run.
When technical lines are very precise, it means most of the trading is technical, from short-term professional traders or longer-term fundamentalists with technical backgrounds. When the smart money is trading, it tends to make the trend more sustainable.
At any time, this and the other major indexes may shift into a sideways trend for a while. Minor corrections are normal and necessary to sustain an overall uptrend. But the run out of the bottom has been solid.

SPX - Surfing Big WavesThe major indexes all trade together, but have different types of patterns. NASDAQ has been crazy bullish, and will be crazy dumpish, because retail likes to lose money buying call options on tech stocks because some 20-year-old wearing a baseball hat on TikTok told them to, and because tech stocks are cool.
More seasoned professionals like to lose money buying the kind of stocks found on the S&P because they're practical.
Either way, we head into a week where 4,200 is a major target, but CPI comes out on Wednesday. This magic number, which is inherently skewed and underreported to begin with, is alleged to tune the Fed's hawkish-or-dovish paradigm, because the central bank claims a target inflation rate of 2%.
We posted 9% back to back in the last two months.
I anticipate everything will dump, and hard, in the next two days, and make themselves quite a fine buying opportunity, although it'll probably be so scary you won't want to do it until you see "confirmation" of a retracement. Also, if you do it too early, you'll just be holding bags. Trading is hard, man.
What I want to say is this: after the shakeout comes, you're going to see a 4,300 SPX. When you see a 4,250 SPX, get out of the market and take your profits.
The move that is coming afterwards, heading into September and October, will make everyone's head spin. To buffer the impact, you want to have yourself a nice cushion of profits before it starts, lest you end up buying the rip and selling the dump and having to take money out of your retirement fund to buy back higher in November.
Be careful, and remember, getting rich is not important in life. Take a long term approach, and focus on your principles and values.

KLV late, but explosive/ Huobi 86% VOLDuring the crash from Mai 2021
- Bitcoin reached a slightly higher ATH
- Some altcoins surged drastically until the end of the year (Shiba, Solana, Kadena, etc.)
- Most of the coins set only a retrace of their old ATHs (from 2021)
- Some went down without any real retrace
Klever ist an exchange token. Originally the clever App was TronWallet. As we've seen in the past Exchange Tokens perform very nicely. Kucoins KCS, Binance Coin, Cro, CHBS, Bitfinexes Leo something...
But... Klever is a totally unknown exchange, it won't perform like the "big dawgs"?
For example, Swissborg is also a very small exchange, look at its chart. It went down only at the beginning. As the bottom was in and measured from there it did 10'000% until peak.
The market gets up, the DOW Jones surges, and the inflation news is getting better.
Something is happening. Is it a new ride to the upside or a retrace? I don't know. But what I know is that KLV didn't do anything, and has a lot of catching up to do.
It reminds me of the "smart money" in Shiba. Seing a big surge, the only way was down for a while, accumulation, and boooom, up the way we go.
KLV is listed for less than a month on Huobi. And already 86% of coins are traded on this new Exchange. Before that only KuCoin was a major place to trade. And this cause back then in 2021 a surge of near 2000% in few weeks.
With another exchange, where most of the trade takes place (until now) I'm very confident of parabolic moves to the upside for a "boring" coin as KLV is at the moment.
Tell me what you think.

DOW JONES entered the rejection zone. Long-term trend decider!The Dow Jones Index (DJI) has finally entered the Rejection Zone that we wrote about last week, consisting of the 1D MA200 (orange trend-line) and the 0.618 Fibonacci retracement level:
With the RSI on the 1W time-frame at its highest level since January 17 2022 but more importantly the 1W MACD on the first Bullish Cross since this 8 month Bear Phase started, it is very likely that we've finally reached the point were the long-term trend shifts from bearish to bullish. However only a weekly closing above the 1D MA200 can confirm that. Until then, being so close to it offers a great Risk/ Reward trade using the tight SL approach just above it to limit the risk and target the 1D MA50 (blue trend-line).
A 1W close above the 1D MA200 should be enough to target the 35540 - 35875 Resistance Zone on the short-term. Important note that may go under the radar: the 1W MACD histogram posted in August its first green bars since May 2021, more than a year ago.
--------------------------------------------------------------------------------------------------------
Please like, subscribe and share your ideas and charts with the community!
--------------------------------------------------------------------------------------------------------

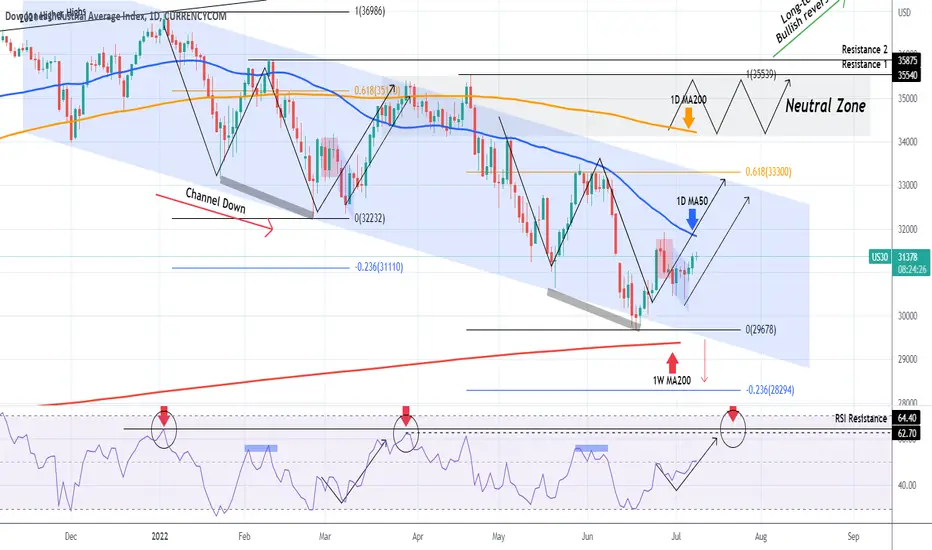
DOW JONES close to a rejection zone. Bullish if it breaks.The Dow Jones Industrial Average (DJI) fulfilled our buy signal given in late June after the price made a Lower Low on its long-term Channel Down:
Right now the scene has slightly changed as the 1D RSI broke above its 8 month Resistance Zone and even though the price is now exactly on the Lower Highs (top) trend-line of the Channel Down, this may be the first sign that the trend is about to change from long-term bearish to bullish.
There is still a chance to break above the Channel Down without breaking the bearish trend as the 0.618 Fibonacci retracement level and the 1D MA200 (orange trend-line) are above it. Those are the levels where Dow got rejected last time (April 21) and started a downtrend to a new Lower Low on the -0.236 Fibonacci extension.
As a result a plan that offers excellent R/R opportunities is to sell just above the 0.618 Fib (see rejection zone) with a tight SL on the 1D MA200. Short-term target the 1D MA50 (blue trend-line), where you can short if it breaks before hitting 0.618. Medium-term target 30450. If we get that candle close above the 1D MA200 then its minimum loss on the SL and switch to a break-out buy on the long-term. In that case the short-term targets can be the previous Lower Highs (33540 and 35875).
--------------------------------------------------------------------------------------------------------
Please like, subscribe and share your ideas and charts with the community!
--------------------------------------------------------------------------------------------------------

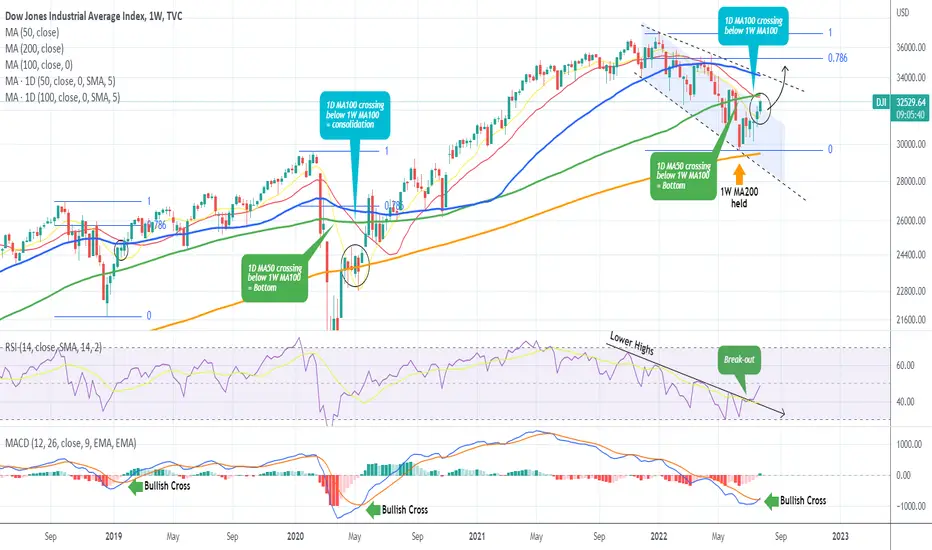
DOW JONES has formed a 2018/2020 type bottom.The Dow Jones Industrial Average Index (DJI) made the first bullish step as we outlined last week by breaking above its 1D MA50 (yellow trend-line) and is currently just below the 1D MA100 (red trend-line) and 1W MA100 (green trend-line). In the process it has made the exact same build up as the COVID bottom and subsequent recovery but let's see into this in more detail.
First and foremost, it achieved this week the 1W MACD Bullish Cross. It is the first such formation below the 0.00 level since May 18 2020 and January 28 2019. Those were the Bullish Crosses that followed the COVID crash and U.S. - Chine trade war bottoms respectively and took the index into the early recovery steps. On top of that, it broke above a Lower Highs sequence on the 1W RSI that was holding since November 01 2021.
Moving on to the MA periods, we can see than during the COVID crash, when the 1D MA50 crossed below the 1W MA100, the bottom was formed. That is also the case with the current correction as the same 1D MA50/ 1W MA100 Bearish Cross has so far formed a low on the June 13 1W candle. Back again to the COVID crash, when the 1D MA100 crossed below the 1W MA100, the index was consolidating preparing for a strong rise above the 0.786 Fibonacci retracement level. On today's correction, we are just after this Bearish Cross, with the index already on two straight (very strong) 1W green candles.
We can see that even in January 2019, the index had a similar consolidation within the 1D MA50 and 1D MA100 before a break above the latter pushed Dow Jones aggressively above the 0.786 Fib. In both sequences, all this happened after a 1W MACD Bullish Cross (as we have today), while the 1D MA50 was holding as a Support.
Even though the pattern since the start of the year is a Channel Down within a Bearish Megaphone, with the 1W MA50 (blue trend-line) located exactly on the Megaphone's Lower Highs (top) trend-line, we do have an excellent framework to work projections based on MA break-outs, modelled out of the similar 2018/ 2020 patterns.
This time the 0.786 Fib is around 35250 and this is our target for the end of Q3.
--------------------------------------------------------------------------------------------------------
** Please support this idea with your likes and comments, it is the best way to keep it relevant and support me. **
--------------------------------------------------------------------------------------------------------
NQ, Channel in channel !NASDAQ 100 E-mini Futures is showing a beautiful channel play !
There is a high slope minor up going parallel channel in low slope major up going channel. Index is reaching to upper top of both channels and reaction will be exciting.
Break out from down side of minor channel will probably triggers for downward move to base of major parallel channel. In this case possible break out of base of major channel signals more down side in whole market. MACD MAY also make a bearish cross. Please note latest bearish crosses in MACD followed by sharp decline in the index.
Possible True Break out of top of channels will trigger more up side move.
Which sides of channels will be broken? We may have a guess and predictions but wise action is to watch carefully and follow the market not our predictions.
This channel in channel setup sounds very interesting and I am happy to share this beauty of technical analysis with you.
Good luck.

NDX, fights with strong resistance one more time !Nasdaq 100 index is going to fight with strong resistance again. Who wins the battle? Lets follow !
This strong resistance is formed by 0.618 Retracement of latest drop in the index from 12897.63 to 11311.05 and a static support/resistance line with several hits which makes it very powerful and valid one.
Our static line acted as strong resistance from Sep to Nov 2020 , then changed the role to support from Dec 2020 to Mar 2021 after break out of the resistance. True break out of this support took place on 10th of Jun 2022 after hot inflation data with a gap down. We had two recent attack to this broken support which most probably were pull backs to the broken support. Now, we may see third attack to the line. Is it able to break the line? We have to wait and watch carefully !.
Please be patient and wait for reaction to the resistance. True break out of the shown key resistance is necessary before opening any long position . A valid rejection from the resistance calls for safe short entry but what are True break outs and Valid rejections? I will publish some video ideas about the topic therefore, If you are interested I will be happy to see you all in our followers family.
Good luck everybody.

DJIDow jones full analysis...
Based on technical and fundamentals analysis using different approaches

Critical Period for the Markets - To Buy or Not to BuyNot accounting for any fundamentals, the OANDA:SPX500USD and the OANDA:US30USD had a strong rejection from heading lower in 3 consecutive weeks.
Fundamentals will be required to decide whether the market is moving back to a long term BUY.
We hit a low of ~-20% from the highs on the DJIA and ~ -25% from the highs on the S&P500.
On multiple time frames, prices are in a key area.
From technical analysis on the daily chart:
1) potentially a double top was forming but did not break the neckline
2) then a double bottom is forming and now we're waiting to see if it breaks the neckline, which is also a major resistance
3) the double bottom formation was pushed up from a 1D demand area, which is also a 1M demand area.
Looking at the candle on a weekly chart, it shows a pretty strong rejection.
1) Price printed a lower low vs the previous week at 3721.6 vs 3741.6
2) Previous week was a bullish candle, and this week we have a bearish candle closing in the body of the previous week's candle.
3) Strong rejection candle printed on 14 Jul 2022 with huge wick, followed buy a very strong bullish candle
4) We're facing a resistance zone that was tested multiple times but failed to break.
I am expecting a potential fake out for price below 3950, but if candle closes higher, I think we can call buys. (purely based on technical analysis) With fundamentals, we could be more sure of the probability of how the market will move.

Follow through US30 analysis against 2008 crashCould it be that market cycles are shorter now, versus back then in 2008?
Also, we probably have more participants in the market now compared to prior years.
More investors, traders as it has become more accessible.
More people learnt from 2008 crash to buy the dips on indexes like the S&P as there is a very high probability of it only going higher.
But, here's what I mapped out on the 1D chart from 2008 crash versus the 1D chart now.
Could we be in a period of consolidation at point 6? or are we only at the tail end of point 5?
Could market take a turn for the worse with recession? Or are all the scares just not coming through in numbers?
Indeed, we came close to a key level of pre-covid highs. But, I would still be calling for sells based on technical analysis, but will have to wait for confirmation. There is also a probability for continued upside.

Bulls Test Falling Wedge Resistance. Is a Breakout Imminent? The Dow Jones Industrial Average rose 0.77% this week, which put prices up against Falling Wedge resistance. If bulls can break resistance, it may trigger a breakout. If so, a rally to the 38.2% or 61.8% Fibonacci retracement levels could be on the cards. The MACD and RSI oscillators are showing positive movement toward their respective mid-points. A bearish bias will remain if prices stay in the wedge.

DOW JONES attempting a 1D MA50 break-outDow Jones (DJI) reversed last week's pull-back and is on a nearly perfect repeat of the last rebound to the top of the long-term Channel Down in an attempt to price a new Lower High. As most recently mentioned 3 weeks ago on our idea below, the Channel had already formed its short-term bottom:
At the moment, based also on the 1D RSI fractals, it appears that we'll break the 1D MA50 and aim for at least 32800 as a Lower High with a more optimistic estimate on the 0.618 Fibonacci retracement level (33300).
The 1W MA200 (red trend-line) is right below the Channel Down and as we've mentioned numerous times on our Channel is the long-term market Support. Breach of that level with a weekly candle closing should immediately test the -0.236 Fib extension and then pursue lower targets on the weekly from there. If that happens we'll follow up with extensive updates.
--------------------------------------------------------------------------------------------------------
** Please support this idea with your likes and comments, it is the best way to keep it relevant and support me. **
--------------------------------------------------------------------------------------------------------
US30 Potential bearish drop | 7th July 2022On the H4, with price expected to reverse off the ichimoku cloud , we have a bearish bias that price will drop to our 1st support at 30422 where the horizontal swing low support and 61.8% Fibonacci retracement are from our 1st resistance at 31216 in line with the horizontal swing high resistance and 50% Fibonacci retracement . Alternatively, price may break 1st resistance and head for 2nd resistance at 31866 where the horizontal swing high resistance and 61.8% Fibonacci retracement is.
Any opinions, news, research, analyses, prices, other information, or links to third-party sites contained on this website are provided on an "as-is" basis, as general market commentary, and do not constitute investment advice. The market commentary has not been prepared in accordance with legal requirements designed to promote the independence of investment research, and it is therefore not subject to any prohibition on dealing ahead of dissemination. Although this commentary is not produced by an independent source, FXCM takes all sufficient steps to eliminate or prevent any conflicts of interest arising out of the production and dissemination of this communication. The employees of FXCM commit to acting in the clients' best interests and represent their views without misleading, deceiving, or otherwise impairing the clients' ability to make informed investment decisions. For more information about the FXCM's internal organizational and administrative arrangements for the prevention of conflicts, please refer to the Firms' Managing Conflicts Policy. Please ensure that you read and understand our Full Disclaimer and Liability provision concerning the foregoing Information, which can be accessed on the website.

Looking for temporary relief at trend support DOW30DOW30 - Intraday - We look to Buy at 30647 (stop at 30282)
The trend of higher lows is located at 30400. This is positive for sentiment and the uptrend has potential to return. A weaker opening is expected to challenge bullish resolve. Prices expected to stall near trend line support. We therefore, prefer to fade into the dip with a tight stop in anticipation of a move back higher.
Our profit targets will be 31586 and 31800
Resistance: 31600 / 33300 / 35300
Support: 30600 / 29000 / 26000
Risk Disclaimer
The trade ideas beyond this page are for informational purposes only and do not constitute investment advice or a solicitation to trade. This information is provided by Signal Centre, a third-party unaffiliated with OANDA, and is intended for general circulation only. OANDA does not guarantee the accuracy of this information and assumes no responsibilities for the information provided by the third party. The information does not take into account the specific investment objectives, financial situation, or particular needs of any particular person. You should take into account your specific investment objectives, financial situation, and particular needs before making a commitment to trade, including seeking advice from an independent financial adviser regarding the suitability of the investment, under a separate engagement, as you deem fit.
You accept that you assume all risks in independently viewing the contents and selecting a chosen strategy.
Where the research is distributed in Singapore to a person who is not an Accredited Investor, Expert Investor or an Institutional Investor, Oanda Asia Pacific Pte Ltd (“OAP“) accepts legal responsibility for the contents of the report to such persons only to the extent required by law. Singapore customers should contact OAP at 6579 8289 for matters arising from, or in connection with, the information/research distributed.'
