DJI Potential drop | 6th May 2022On the H4, with price moving below the ichimoku cloud , we have a bearish bias that price will drop from 1st resistance in line with the horizontal pullback resistance and 38.20% Fibonacci retracement to our 1st support in line with the 100% Fibonacci projection . Alternatively, price may break structure and head for 2nd resistance where the horizontal overlap resistance is.
Any opinions, news, research, analyses, prices, other information, or links to third-party sites contained on this website are provided on an "as-is" basis, as general market commentary, and do not constitute investment advice. The market commentary has not been prepared in accordance with legal requirements designed to promote the independence of investment research, and it is therefore not subject to any prohibition on dealing ahead of dissemination. Although this commentary is not produced by an independent source, FXCM takes all sufficient steps to eliminate or prevent any conflicts of interest arising out of the production and dissemination of this communication. The employees of FXCM commit to acting in the clients' best interests and represent their views without misleading, deceiving, or otherwise impairing the clients' ability to make informed investment decisions. For more information about the FXCM's internal organizational and administrative arrangements for the prevention of conflicts, please refer to the Firms' Managing Conflicts Policy. Please ensure that you read and understand our Full Disclaimer and Liability provision concerning the foregoing Information, which can be accessed on the website.
Djia

India VIXWith FOMC outcome due tonight, volatility is increasing sharply (pre-event uncertainty)
We are in the dark as to what FED will do tonight - so many possibilities, add to that statement - hawkish or dovish
25 bps market will rally
50 bps appears discounted
75 bps market will panic
Hence better to stay light
Above 21.75 the crucial resistance is at 2.80 if that breaches then be prepared for extreme moves (we have just seen the trailer in that case) all the way till 28
This would be mean large intra-day candles & gap openings. Avoid writing PE during such time unless well hedged. Also reduce derivative exposure its not worth it during such times.
Post event wait for VIX to start cooling down, trend direction will become clear by then

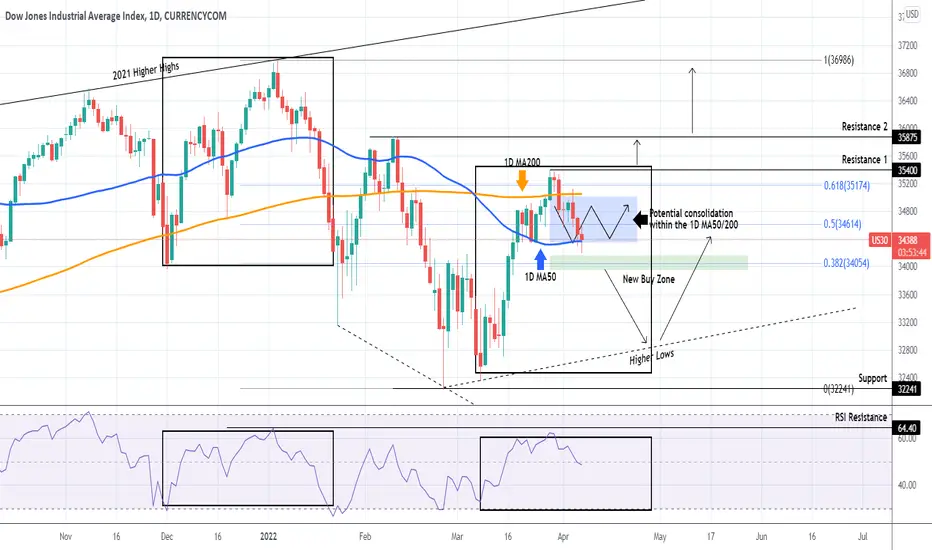
DOW JONES Bullish on Higher Lows but mind fractal continuationThe Dow Jones index (DJI), eventually fulfilled the selling sequence of January's fractal which I mentioned as possibility on my last analysis:
The index is now very close to the Higher Lows trend-line of the February 24 Low and even though the January fractal hints to more selling, if the Higher Lows hold, I expect a rebound towards the 0.618 Fibonacci retracement level at around 34350, as in Jan. A 1D candle close below the Higher Lows though, keeps the fractal intact and we can see the 32240 Support being tested, even a new Lower Lows trend-line towards the -0.236 Fibonacci extension but for this very pessimistic scenario, a strong bearish catalyst is needed, but it's often found during earnings seasons.
--------------------------------------------------------------------------------------------------------
** Please support this idea with your likes and comments, it is the best way to keep it relevant and support me. **
--------------------------------------------------------------------------------------------------------

Monday US30 market movement DJIAOn monday morning Asian market opening time. The market price for US30 will go up to around 33193 because thats the probable retracement level as there is also a previous low. There is also an order block at H1 which may help prompt buyers to push the market up. If nothing strange comes up, the market may push up through the Euro opening time Zone through to the bearish order block at H1 above and then at New York opening if the S&P manufacturing news is negative it will fail to break that bearish order block and push the market lower to the level of its opening at pre-market levels. If the S&P manufacturing index news are positive we may see it break through that order block and continue higher. Mind you the market hasn't broken the structure on the daily time frame.

US30 Following 2008 Crash PatternI was watching the patterns in 2008 crash, and how it might translate into today's situation.
Although there are quite some differences between the 2 events. We are having a "war" at this point, and hoping it doesn't escalate.
Pray for peace in Ukraine.
That aside. I have the image of the 2008 Weekly candle chart pasted for easy reference against the present market candles. If you look up my previous ideas, I have mentioned the same.
In 2008, it was a head and shoulders, a break of the neckline, a re-test of the neckline and a further dive down.
In the current market, it is not as obvious, but we are making a lower low, on the weekly today (although there is about 6 hours left 'till market closes for the week).
As with a couple of weeks prior, a strong rejection bearish candle (1) led to a fall in 4 consecutive weeks.
2 weeks ago, we had a strong rally but held barely under the close of the strong rejection bearish candle (1) shown in orange highlights.
With a couple more hours before market closes, I do expect that current momentum holds the candle bearish.
Next week, we'll see how the market reacts. Should another bear candle follow, I would anticipate for price to reach lower into a key demand area around 33200.

Trading diary Us30 28.04The exit from the zone is caused by a breakdown of the ice Wyckoff zone.
The target is the volume profile zone. In case of its breakdown, the POC nearest by the weekly profiles
DJI Potential bearish drop | 28th Apr 2022On the H4, with price moving below the ichimoku cloud , we have a bearish bias that price will drop from our entry at 33583 where the horizontal overlap resistance is to our take profit at 32689 in line with the horizontal swing low support. Alternatively, price may break structure and head for stop loss where the horizontal overlap resistance and 38.2% Fibonacci retracement is at 34078.
Any opinions, news, research, analyses, prices, other information, or links to third-party sites contained on this website are provided on an "as-is" basis, as general market commentary, and do not constitute investment advice. The market commentary has not been prepared in accordance with legal requirements designed to promote the independence of investment research, and it is therefore not subject to any prohibition on dealing ahead of dissemination. Although this commentary is not produced by an independent source, FXCM takes all sufficient steps to eliminate or prevent any conflicts of interest arising out of the production and dissemination of this communication. The employees of FXCM commit to acting in the clients' best interests and represent their views without misleading, deceiving, or otherwise impairing the clients' ability to make informed investment decisions. For more information about the FXCM's internal organizational and administrative arrangements for the prevention of conflicts, please refer to the Firms' Managing Conflicts Policy. Please ensure that you read and understand our Full Disclaimer and Liability provision concerning the foregoing Information, which can be accessed on the website.

Dow Jones Potential bearish drop | 26th Apr 2022On the H4, with price moving below the ichimoku cloud , we have a bearish bias that price will drop from our entry at 34078 where the 161.8% Fibonacci retracement is to our take profit at 33354 in line with the horizontal swing low support and 61.8% Fibonacci retracement . Alternatively, price may break structure and head for stop loss where the 61.8% Fibonacci retracement is at 34739.
Any opinions, news, research, analyses, prices, other information, or links to third-party sites contained on this website are provided on an "as-is" basis, as general market commentary, and do not constitute investment advice. The market commentary has not been prepared in accordance with legal requirements designed to promote the independence of investment research, and it is therefore not subject to any prohibition on dealing ahead of dissemination. Although this commentary is not produced by an independent source, FXCM takes all sufficient steps to eliminate or prevent any conflicts of interest arising out of the production and dissemination of this communication. The employees of FXCM commit to acting in the clients' best interests and represent their views without misleading, deceiving, or otherwise impairing the clients' ability to make informed investment decisions. For more information about the FXCM's internal organizational and administrative arrangements for the prevention of conflicts, please refer to the Firms' Managing Conflicts Policy. Please ensure that you read and understand our Full Disclaimer and Liability provision concerning the foregoing Information, which can be accessed on the website.

Dow Jones Potential bullish rise | 25th Apr 2022On the H4, with price moving above the ichimoku cloud , we have a bullish bias that price will rise to our 1st resistance at 34078 where the overlap resistance is from our 1st support at 33354 in line with the horizontal pullback support and 61.8% Fibonacci retracement . Alternatively, price may break 1st support structure and head for 2nd support where the horizontal swing low support is at 32670.
Any opinions, news, research, analyses, prices, other information, or links to third-party sites contained on this website are provided on an "as-is" basis, as general market commentary, and do not constitute investment advice. The market commentary has not been prepared in accordance with legal requirements designed to promote the independence of investment research, and it is therefore not subject to any prohibition on dealing ahead of dissemination. Although this commentary is not produced by an independent source, FXCM takes all sufficient steps to eliminate or prevent any conflicts of interest arising out of the production and dissemination of this communication. The employees of FXCM commit to acting in the clients' best interests and represent their views without misleading, deceiving, or otherwise impairing the clients' ability to make informed investment decisions. For more information about the FXCM's internal organizational and administrative arrangements for the prevention of conflicts, please refer to the Firms' Managing Conflicts Policy. Please ensure that you read and understand our Full Disclaimer and Liability provision concerning the foregoing Information, which can be accessed on the website.

US30 Potential For Bullish Bounce | 22nd April 2022Price is near to the key pivot and we see that ichimoku cloud indicator is trying to push the price up. Therefore, we can expect the price to potentially bounce from the buy entry level of 34636 in line with 61.8% fibonacci retracement and 61.8% fibonacci projection towards the take profit level of 35368 which is a previous horizontal swing high resistance.
Any opinions, news, research, analyses, prices, other information, or links to third-party sites contained on this website are provided on an "as-is" basis, as general market commentary, and do not constitute investment advice. The market commentary has not been prepared in accordance with legal requirements designed to promote the independence of investment research, and it is therefore not subject to any prohibition on dealing ahead of dissemination. Although this commentary is not produced by an independent source, FXCM takes all sufficient steps to eliminate or prevent any conflicts of interest arising out of the production and dissemination of this communication. The employees of FXCM commit to acting in the clients' best interests and represent their views without misleading, deceiving, or otherwise impairing the clients' ability to make informed investment decisions. For more information about the FXCM's internal organizational and administrative arrangements for the prevention of conflicts, please refer to the Firms' Managing Conflicts Policy. Please ensure that you read and understand our Full Disclaimer and Liability provision concerning the foregoing Information, which can be accessed on the website.

E-Mini SP 500 Futures Weekly Chart Gann PredictionlevelCME_MINI:ES1! near the convergence of multiple Gann Support Levels 4345, 4335, and 4315 indicating a possible bottom this week from which we can start to move towards Gann Resistance Levels 4403, 4415, and 4460.
CME_MINI:ES1! closing above 4460 this week would indicate continuation of the uptrend towards 4460, 4480, and 4560 Gann Resistance Levels next week.
Good Luck!

E-Mini Dow Jones Futures GANN Levels for Week of 18.04.2022CBOT_MINI:YM1!
Weekly View is Negative. Cloisng below 34,300 this week!
Resistance: 34,400, 34,500, and 34,600
Support 34,300, and 33,770
Good Luck!

1929 Crash DJIA FractalIF, HISTORY play out again, we are looking bullish until 2026 (Crypto Bull Run).
DJI needs adouble bounce before its bullish. If this play out, there may be an opportunity for a large swing.
TONS of FEAR news out there about the crash, SELL SELL SELL!!
- Does this mean buy? YES!
Bullish if you are a FRACTAL trader, but i loke many perspectives.

E-Mini Dow Jones Futures GANN Levels for todayCBOT_MINI:YM1! trading in a tight range 34,440 and 34,580 since open. Resistances are 34580 and 34620 above which we expect CBOT_MINI:YM1! to move towards the 34740 levels.
In the event, our support of 34440 breaks, we could test the 34350 support level.
Watch the video for full details on the trading levels and range for today. Good Luck!
Have a great weekend & Happy Good Friday!

DOW JONES starting new rally to 36000.Dow Jones (DJI) has been correcting inside a Channel Down ever since the March 29 Top. This was the top of the March rally that broke emphatically much higher than the 1D MA50 (blue trend-line), effectively confirming that this was the market bottom during the Ukraine - Russia war and the ongoing battle with inflation.
During uptrend technical structures, short-term Channel Down corrections are considered to be Bull Flags that serve as opportunities to buy for the continuation of the long-term bullish trend. The last such Bull Flag pattern, after a market correction of similar structured magnitude, was in May 2020 following the March 2020 correction due to the COVID pandemic market crash. Note that in both cases, the 1D Death Cross pattern (when the 1D MA50 crosses below the 1D MA200 (orange trend-line)) was formed on the market bottoms.
As you see, both Bull Flag patterns formed around the 0.618 Fibonacci retracement level and corrected as low as the 1D MA50 inside the Red Ichimoku Cloud. In 2020, shortly after the Bull Flag broke to the upside, the 1W MACD formed a Bullish Cross. On the current (2022) pattern, the 1W MACD is very close to forming that Bullish Cross, potentially meaning that we are currently on an early buy signal.
When the Bull Flag broke to the upside, the 2020 pattern made its next Higher High just above the 0.786 Fibonacci retracement level. On the current pattern, the 0.786 Fib is just below 36000. That is our target on Dow for the medium-term.
--------------------------------------------------------------------------------------------------------
Please like, subscribe and share your ideas and charts with the community!
--------------------------------------------------------------------------------------------------------

Bitcoin and DOW + S&P500 Coupling This chart tracks the coupling of Bitcoin with the DJIA and SP500 over time

SPX long target 4750it seems Wave 5 started . SPX long target 4750. I am expecting bull market top at 5300 before crashing hard .

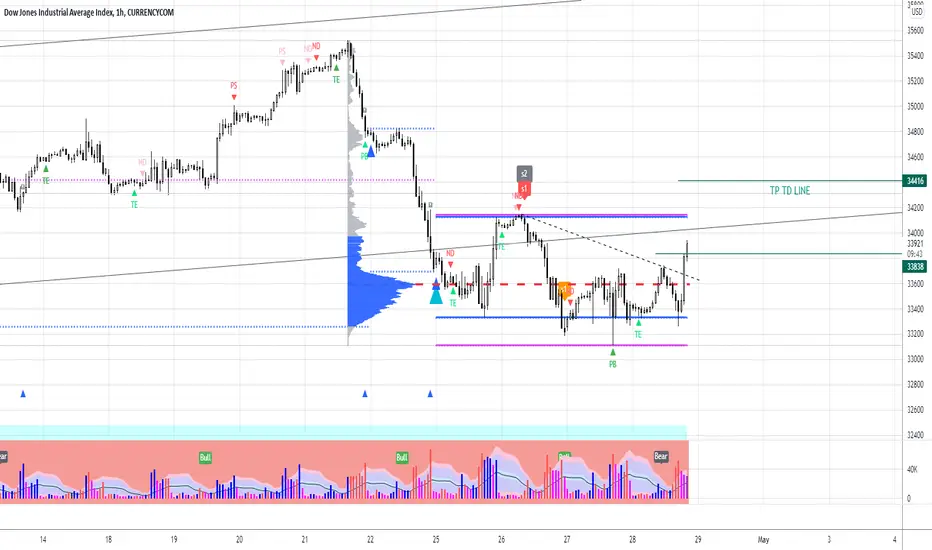
DOW JONES key levels to watch that will determine the trendDow Jones has been trading within the 1D MA200 (orange trend-line) and the 1D MA50 (blue trend-line) for the past 5 days. The rejection from the March 29 High came despite closing above the 1D MA200, on a move that caught the market off guard.
So far the price action resembles the blow-off top of January 05, which ended in a violent selling sequence. However this can be invalidated if the 0.382 Fibonacci retracement level (around 34000) holds, which is the new Buy Zone as mentioned on my previous analysis. If it holds, I expect Resistance 1 (35400) and Resistance 2 (35875) to be tested. If not, the January pattern will be confirmed and should test the Higher Lows trend-line of the February 24 bottom.
Short-term traders can keep scalping by taking advantage the 1D MA200 - MA50 range for short-term profits.
--------------------------------------------------------------------------------------------------------
** Please support this idea with your likes and comments, it is the best way to keep it relevant and support me. **
--------------------------------------------------------------------------------------------------------
Waiting and watching DJISadly, it has receded back into the bearish trend line. So, now is not the time to be a HERO !
Wait for the price action to break out first, await the bulish signals then go LONG.

US30 (Dow Jones Index) 4H short analysisCURRENCYCOM:US30
Head and Shoulders formation on the 4 Hour chart
Technical analysis of the 4 hour chart
Trade with caution and good luck.

Dow Jones, Wave scenario !dowjones has cut the upper channel from the downtrend correction condition and is now forming 5 small correction waves to get ready to form wave C. We can also see there is a morning star canddlestick and divergence on the stochastic. This is a signal for an uptrend (for a moment).

DOW JONES broke its 1D MA200 but may consolidate for a whileDow Jones (DJI) broke today above its 1D MA200 (orange trend-line) for the first time since February 16. However, as the Ukraine-Russia war isn't yet over, this rally will seek reassurances from this week's high impact macro-economic reports, namely Wednesday's GDP and Friday's Nonfarm Payrolls.
If the index closes a 1D candle above Resistance 1 (35150) then the next target will be Resistance 2 (35875). If not and the price shoots back below the 1D MA200, look for a multi-week consolidation within the 1D MA200 and the 1D MA50 (blue trend-line), which will be a good scalping opportunity.
The new long-term buy Zone is around the 0.382 Fibonacci retracement level but a closing below it should seek support on the bottom's Higher Lows trend-line. However I have to give the advantage to the long-term bullish case, as the RSI just broke above a multi-month Lower Highs trend-line, which is an indication of a long-term rally for 2022.
--------------------------------------------------------------------------------------------------------
** Please support this idea with your likes and comments, it is the best way to keep it relevant and support me. **
--------------------------------------------------------------------------------------------------------

Short DJIA/SPX etc until 2035A long-term bear market is ahead. Almost all indexes are to loose 70-80% from their highs. Would not be surprised to see DJIA breaking 15k level this year. Hedges are strongly recommended here.
