DOWJONES expect this sell off Hi traders:
Similar like NAS and SPX, I am expect the sell on the indices to happen very soon.
Price as we see is getting squeezed and corrected in the latest price action.
Its unlikely we can continue see price behave this way without the impulsive phrase to come in.
The key is to wait for confirmation breakout from the LTF, and look for continuation corrections to give you the best R:R.
Thank you
Djia


UDOW (leveraged product) used to Trade Sentiment of DJIAI use UDOW when I'm bullish on the DJIA, which I am.
Yes, a leveraged product which inherits more RISK.
This is not investment advise.
A picture perfect ascending channel has formed.
(blue lines)
Start trimming positions at UDOW 104/share.
No need to short, trust start trimming.
BUY back more UDOW at bottom of blue channel,
likely around 84, at orange line of support convergence.
- Status Date: Dec 03, 2020
- Stay cool, stay humble, stay safe.
- Cryptmando

Restraint at the highs📌 SPX has had its advance cut off; an attempt to cap it from the reckless advance allows the possibility of a panic blow which is decisive and impulsive in such situations, namely the invasion towards the pivot.
This idea illustrates the stratagem of a major high against a 'positive' news flow.
Since the Vol expansion is necessary for the defence of the highs, an exchange at 21/22 is the way we defend. You should memorise this move of forcing our opponent to make up their mind, after clearing the positivity newsflow around vaccine and etc we are going to have 'diversion' introduced. This should be considered playing against, contested elections and uncomfortable positioning from stimulus expectations leaves the entire board looking vulnerable.
Thanks as usual for keeping the feedback coming 👍 or 👎

BOING-CO Daily Stock Chart!The daily chart pattern and Elliott wave possible count may suggest an uptick to
the upper trend line then a downtrend may resume.


𝗗𝗼𝘄 𝗨𝗽𝗱𝗮𝘁𝗲: $YM_F Daily. 🎅🏼📈 into Year End?Held support area ~$26K and channel broke out to new ATH. Over $30K and will likely see a 🎅🏼📈 into year end
$DJI $DIA $SPX $SPY $ES_F $NDX $QQQ $NQ_F $VIX #DowJones #ElliottWave #Trading #Stocks

DJI - Comparing Today's Market vs September 1929Comparing similarities between today's Dow Jones vs. 1929 boom & crash.
Looking at 1929, there was a similar, but shorter-term double top prior to the crash, but instead of crashing after an apparent double top, we blew upwards massively first and then crashed.

S&P500 Saw Another Re-test TodayThe Index started to selling off again heading into the afternoon session. Price came close to this week's low made on Monday, but it held. Now price is trading almost unchanged for the day, down -.09%.
In the mid-term, as long as the price holds above the trendline, the S&P500 is looking bullish. From a swing trader point of view, the index will not look bearish until it consolidates below 3500. The keyword here is to consolidate! This market has seen a lot of false breakouts whether it's a bullish or a bearish move.

DOW JONES The RSI shows extension to this rally. 30500 eyed.My focus on DJIA is on the 1D time-frame where the RSI is approaching the 77.000 Resistance. This is a 5 month old trend-line and it appears that with all the positive fundamentals involved, the rally can be extended until this level is tested.
An even more interesting find is that every Top since the March meltdown, is on (or near) the -0.382 Fibonacci extension of the previous. That was spot on for the June 09 Top and the September 02 Top. This time the -0.382 Fib is at 31000.
Does it make sense to target 30500?
Recent DOW JONES signal:
** Please support this idea with your likes and comments, it is the best way to keep it relevant and support me. **
--------------------------------------------------------------------------------------------------------
!! Donations via TradingView coins also help me a great deal at posting more free trading content and signals here !!
🎉 👍 Shout-out to TradingShot's 💰 top TradingView Coin donor 💰 this week ==> seba26-77
--------------------------------------------------------------------------------------------------------

DOW 30k! 💨After the election results, the Dow jumped to new record highs on Monday, marking its high just shy of the 30k milestone. Our primary expectation is a breach of the 30k mark and a continuation of wave iii in orange. To confirm the outbreak, the Dow must break above the 30k mark. Should the bears send the market on a detour, and the support at 28781 is broken, we expect the further downward movement towards the next support line at 27648. One way to play the current scenario is to place entry orders above and below the mentioned decision levels. The upcoming days will be filled with suspension!

XAUThis seems likely guys. Full disclosure I'm short the miners so I have some bias. But chances of gold breaking up past ATHs without another 3T stimulus package until Jan 2021 seems very unlikely IMO.

10 yr noteThis is a pretty big bear div on the stochastic rsi on the daily TF. So this is a HTF div that continued down all say while bond yields went up.
Something is coming and its a bear.

PYPL Still Above Major Support LevelsPaypal looking bullish into the election. Price is still trading above some major support levels at 171.00 & 164.00 respectively. Look to buy into major support levels as risk/reward becomes very attractive. If the price manages to consolidate below 162.00 cut losses quickly. Any consolidation below 162.00 will be considered very bearish.


Stock Indices overview ahead of US elections $SPX $NASDAQAll is ready for a downside breakout but we could wait for it after the elections in USA not before. Watch the video technical analysis of the most important Indices $DJIA $SPX $NASDAQ

DJIA - double top in progressThe DJIA index after the previous slump has retraced back to the bearish gap from February. The gap seems to be a strong area of resistance which has stopped DJIA rally twice.
As a consequence, we may expect a potential double top pattern to be formed. So if the 26536 low is broken we could expect a further downward movement toward the textbook target located at 24191. Near that level, to 50% Fibo retracement is also located.
________
Daniel Kostecki, Chief Analyst Conotoxia Ltd.
Materials, analysis and opinions contained, referenced or provided herein are intended solely for informational and educational purposes. Personal opinion of the author does not represent and should not be constructed as a statement or an investment advice made by Conotoxia Ltd. All indiscriminate reliance on illustrative or informational materials may lead to losses. Past performance is not a reliable indicator of future results.
81% of retail investor accounts lose money when trading CFDs with this provider. You should consider whether you understand how CFDs work and whether you can afford to take the high risk of losing your money.

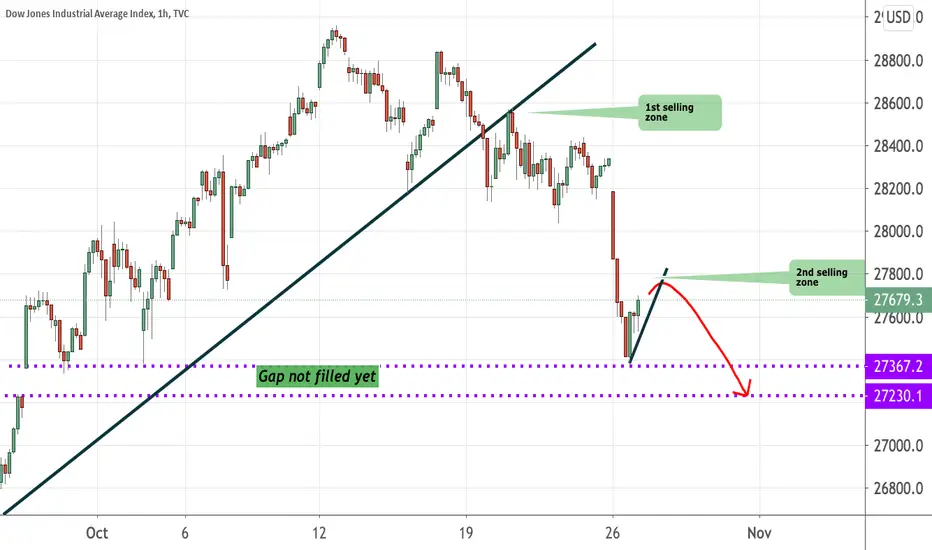
Riding on the downfall of 900 points fall in DJIAFor those who have been following me for a while, you would be able to spot this selling opportunity last night.
I expect the gap to be filled up before we see more selling resume and revisit 26,724 area.
Please note that a rebound is possible after the gap area is filled up so watch for bullish or bearish signal before you take your next action. Sometimes, we let our initial wins and become a little over confident.
A look at the Day chart would tell you that the main trend line is still super bullish so this is a short term sell ONLY.
Those who are not comfortable shorting and if you have not shorted yesterday, please stay on the sideline , watch my updates for the next long opportunity.
According to CNBC sources -Strategist blamed the selling on the surge in coronavirus cases, election uncertainty and the fact that Congress could not agree on stimulus spending.
Now, like I said before, news are meant to be sensational and most of the time negative. Trend trading focus on the chart and one need not be too bothered with the news.
ridethepig | SPX into elections and beyond📍 SPX - into the elections and beyond
This waterfall is a demonstration of how and where a decline in confidence on the risk front should be punished.
The lust to expand equities higher is rather less here than one might suspect at first look. With the unsurprising hurdle of a contested election in US, buyers are threatened by an obstruction in democracy and Schwab transferring his influence across the Atlantic.
The only valid plan here is to look for sells and be prepared for a waterfall into November. Sharp speculators are not buying at these levels and looking to set in motion a new economic cycle (yet), first we must finish the correction.

ridethepig | Dow and Volatility into the elections and beyondThis diagram consists of my conception of the election positional play and continues into my treatment of the end-game in an economic cycle.
1️⃣ The reciprocal relationship between risk tolerance on the one hand and a contested election on the other.
As we will soon notice, my dear followers, my conception of the next few weeks and months is largely based on the knowledge which we have painstakingly collected since 2019.
2️⃣ A house of cards.
I started picking up on the alarm bells in October last year.
My VIX models were starting to warn of a +500% move towards 85.
A sweep of the lows under 12 to capitulate any soft bulls would force put covering.
This was all done in Q419 before a contraction in globalisation entered into play from Q120.
You can check for yourself here the timestamps
…and oh surprise surprise…
85 was the exact HIGH of the FIRST COVID CHAPTER.
🔑 Pay attention to what happens next
Sure the move from 12 to 85 might have been easy to spot
- We tested it to the pipette ✅
- Buyers were exhausted and found a valid place to cover ✅
I want to highlight something very important, as you have all seen the flows live in advance....Let’s go into some details and leave make the picture crystal clear:
If you are wondering how...?
First if we look vix from 85 as we originally did, we can see the October 2019 highs are open.
Obviously, these are same levels when my models began to pick up the alarm bells.
Here is where things start making sense
Been in absolutely no doubt.
The biggest sharks in the game are repositioning.
Remember, VIX ⬆️ gives us the green light to sell risk in absolute terms .
As you can all see we continued to track the flows together across other asset classes.
In this case, the move was not without venom for European Equities.
Using the 2020 map for DAX for reference:
Perpetual bonds are the Trojan horse for government defaults. Insiders know what was cooking and wanted to unwind German Equity exposure outguessing the ‘Green New Deal’.
Well we are back to square one.
Equities completing the retrace and we are set for Covid Chapter Two.
Professional portfolios are going to come under severe stress in the coming weeks, even the most advanced players will be tested to their limits as they all have the same ingredients.

$GM the battle of faith$GM has always been a good indicator of $DJIA and the way it could move in the future. Last week swing high in this stock is highly unusual taking into an account indebtness and GDP fall and consumers uncertainty invoked by COVID-19. 38-38.4 is that magic line this stock needs to cross above or te be rejected from. It will be good for trading.
