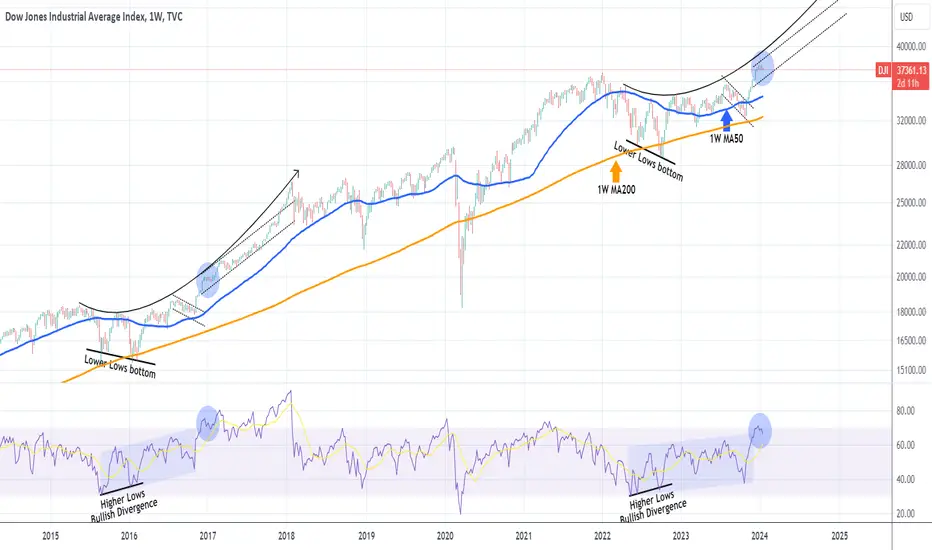
DOW JONES Why you don't want to miss this rally.Dow Jones (DJI) is pulling back on a technical correction as the 1W RSI got overbought (above the 70.00 mark) on the December 26 1W candle. That was basically the first time since June 01 2021 it got overbought and that time also gave a technical pull-back.
What draws our attention more than that time though is the December 19 2016 pull-back when the 1W RSI was again overbought. The difference here is that the price action and patterns that preceded that pull-back/ consolidation are very similar. A Lower Lows bottom on the 1W MA200 (orange trend-line) that took place on a 1W RSI Higher Lows Bullish Divergence, gave way to a break and sustainable rise above the 1W MA50 (blue trend-line). Following the current pull-back/ consolidation we are at, a very strong Channel Up took place.
As a result, even though the sentiment is bearish on the short-term, possibly until the January 31 Fed Meeting, it is clear that the long-term trend is bullish. Every such correction has high probabilities from now on to be a buy opportunity. The target can be as high as 43000 within 2024.
-------------------------------------------------------------------------------
** Please LIKE 👍, FOLLOW ✅, SHARE 🙌 and COMMENT ✍ if you enjoy this idea! Also share your ideas and charts in the comments section below! This is best way to keep it relevant, support us, keep the content here free and allow the idea to reach as many people as possible. **
-------------------------------------------------------------------------------
💸💸💸💸💸💸
👇 👇 👇 👇 👇 👇
Djia
DOW JONES: Top is being formed, 1D RSI Bearish Divergence.Dow Jones has been trading sideways since the December 28th 2023 High, having tested that Resistance after another three times. Naturally the 4H timeframe is neutral and the 1D technical outlook is about to as well (RSI = 56.255, MACD = 185.180, ADX = 33.836). The 1D RSI in particular is under a LH trendline, which is of the same shape as August 1st 2023, May 1st 2023 and December 13th 2022, all major market tops of the past 13 months.
This is a strong technical Bearish Divergence and consequently we expect a pullback to at least the 1D MA50. Based on those past peaks and corrections though, we should be expecting at least a 0.382 Fibonacci pullback, thus our target is near the S2 level (TP = 36,000).
## If you like our free content follow our profile to get more daily ideas. ##
## Comments and likes are greatly appreciated. ##

DOW JONES Correction has started. Where can it stop?Dow Jones (DJI) started a strong decline since our December 29 2023 sell call (see chart below), the strongest since the remarkable rally started on the October 29 bottom:
On today's analysis, we want to look into the same market dynamics and the pattern we drew 10 days ago but this time on the 1D time-frame. What stands out the most is that this time on the January 02 2024 High, the RSI peak that was made a few days back on December 19 2023 (hence the Bearish Divergence) was a (much) Higher High that the previous two (red arrows down) on the Higher Highs trend-line (July 26 2023 and April 13 2023), that was made on the vastly overbought level of 87.50 (highest since January 11 2018).
Our short-term target remains 36750, which represents the 0.618 Fibonacci retracement level from the Jan 02 High. The other feature on this 1D chart that stands out is the 38.50 1D RSI Support, which provided rebounds on May 25 2023 (long-term) and August 24 2023 (short-term). That RSI Support reveals where our first buy attempt should be. Price-wise that could be as low was the 0.5 Fibonacci retracement level (35100) of the October 27 Low. By the time it potentially makes contact with it, the 1D MA200 (orange trend-line) could be there as well.
A medium-term candidate is also a -4.50% range from the Jan 02 High, which would give us 36150 and is where the 1D MA50 (blue trend-line) is headed right now.
-------------------------------------------------------------------------------
** Please LIKE 👍, FOLLOW ✅, SHARE 🙌 and COMMENT ✍ if you enjoy this idea! Also share your ideas and charts in the comments section below! This is best way to keep it relevant, support us, keep the content here free and allow the idea to reach as many people as possible. **
-------------------------------------------------------------------------------
💸💸💸💸💸💸
👇 👇 👇 👇 👇 👇

SPX Cash AnalysisWe're now getting a confirming signal that last week's top was at least a local top. Primary analysis (in Blue) however, because we did not make a new high in the SPX like the DJIA and NDX, the black (B) wave count is a valid EWT count. I do not favor the black pathway mainly due to our MACD signal, the other major indices hitting new highs, and lastly the price action I have as of today.
Best to all,
Chris

TARGET REACHED Dow Jones at 37,242 - Still bullishReverse Cup and Handle formed on Dow Jones.
The price broke up and since then has been rocketing to its first target at 37,242.
Now that it is the new year generally we can expect the January Effect to kick in with enhanced optimism and positive buying.
I don't like the USD looking to strengthen though, that might change the course.
RIght now I don't have a setup or pattern line up. SO we will just go with the momentum and trend.
Let's see if we can hit 40,000.


USA Recession begins, now!USA economy expected to get hit now and DJIA reaches 161.8% target for wave 3.

DOW JONES Huge Bearish Divergence on 4HDow Jones (DJI) is trading within a very aggressive Channel Up since the October 27 bottom that has seen it rise almost by +17%, making new a All Time High (ATH) in the process. In the meantime it is about to hit the Higher Highs trend-line that has been acting as a Resistance, rejecting similar Channel Up patterns since April 14.
What is more alarming than this Resistance, is the Channel Down that has emerged on the 4H RSI. The other two similar Channel Down patterns that emerged after the RSI got overbought, did so right before the index peaked on the Higher Highs trend-line, starting two corrective Bearish Megaphone patterns. Those structures reached at least the 0.5 Fibonacci retracement level measured from the previous Higher Low, and the 0.618 Fibonacci level from the bottom of the (blue) Channel Up.
Based on this occurrence, we expect yet another Higher Highs rejection that will test at least the 0.618 Fib at 36750, which is our current sell target. Potentially, if the selling pressure is pilled up and transitions to the 1D time-frame, it can reach as low as the 0.5 Fibonacci from the October bottom at 35150.
-------------------------------------------------------------------------------
** Please LIKE 👍, FOLLOW ✅, SHARE 🙌 and COMMENT ✍ if you enjoy this idea! Also share your ideas and charts in the comments section below! This is best way to keep it relevant, support us, keep the content here free and allow the idea to reach as many people as possible. **
-------------------------------------------------------------------------------
💸💸💸💸💸💸
👇 👇 👇 👇 👇 👇


UPDATE: Dow Jones almost reaching target at 37,242SInce the price broke above the breakout pattern, the price has been moving on a strong but unsustainable inclination trend.
Yes, it will most likely hit the initial target 37,242 as we're almost there.
But, we also need to consider that in the next three weeks, we could have some consolidation range.
This doesn't mean, we should expect a crash afterwards. On the contrary with the US dollar weakening and with the interest rate hike on hold - means we should expect futher upside in 2024.
But I'll let you know...

DOW JONES Does this rally still surprise you?Two months ago (October 11) we made a bold statement calling for "the start of a new Bull rally under our nose" on Dow Jones (DJI) (see chart below):
Many traders/ investors/ market participants have been surprised by the current November - December rally but in reality they shouldn't as the index is methodically repeating the 2016 - 2017 Rising Wedge pattern, as we've shown on that analysis. We are now at the level where the price is breaking above that pattern (blue circle), which comes after the 1W RSI makes a fake-out break breach below the Higher Lows and then rebounds.
On the current analysis we expand the chart more, in order to show you that the very same Rising Wedge also emerged from May 2011 to December 2012. We are therefore on a +10 year cyclical pattern which the all three Wedges not only displaying identical break-outs/ fake-outs but also similar duration.
The 2011/12 pattern peaked on the 2.618 Fibonacci extension, the 2015/16 a little higher on the 3.0 Fib ext. We can assume that this progression could give a new top on a higher Fib, but if we take the worst case scenario of the model (2.618 Fib), we can expect a High around 42900.
Check out also how the Sine Waves grasp fairly accurately the cyclical movement on those bottoms and peaks during these past +10 years. Another important observation is that after the index broke above the Rising Wedge in 2016, it didn't offer any significant dips to buy. Rare buy entry opportunities existed only on the middle trend-line (orange) of the Bollinger Bands. The 2013 break-out gave significantly more dips buy opportunities, 7 in total all marginally below the Bollinger middle, before the 2.618 Fibonacci peak.
-------------------------------------------------------------------------------
** Please LIKE 👍, FOLLOW ✅, SHARE 🙌 and COMMENT ✍ if you enjoy this idea! Also share your ideas and charts in the comments section below! This is best way to keep it relevant, support us, keep the content here free and allow the idea to reach as many people as possible. **
-------------------------------------------------------------------------------
💸💸💸💸💸💸
👇 👇 👇 👇 👇 👇

VIX Index at Lowest Levels Since 2017OVERVIEW
As of 12/12/2023, CBOE:VIX is at 11.82.
There have only been a handful of periods over the last 30 years where stock market volatility is at a similar level, including 2007 and 1994.
Some would argue it implies an increasing level of volatility will be due in 2024.
What is the VIX?
The CBOE Volatility Index, is a real-time market index representing the market's expectations for volatility over the coming 30 days. Investors often refer to the VIX as the "fear index" or "fear gauge" because it is one of the most recognized measures of market volatility.
Here's a breakdown of what the VIX represents:
Volatility Measurement:
The VIX measures the stock market's expectation of volatility based on S&P 500 index options. It is calculated using the bid and ask prices of S&P 500 index options.
Forward-Looking: Unlike many market metrics that look at past performance, the VIX is forward-looking. It provides a 30-day forward projection of volatility.
Market Sentiment Indicator: A high VIX value indicates that traders expect significant changes (volatility) in stock prices, which is often associated with market uncertainty or fear. Conversely, a low VIX suggests low expected volatility and is often associated with market stability.
Not a Direct Stock Market Indicator : It's important to note that the VIX does not measure the direction of stock market movements. Instead, it measures how much the market is expected to fluctuate, regardless of the direction.
Use in Investment Strategies: Some investors use the VIX to help in making decisions about market timing. For example, a high VIX might suggest a market turning point, leading some to consider it a good time to buy, while others might see it as a signal to sell.
VIX Derivatives: There are various financial products, such as VIX futures and options, that allow investors to trade based on their views of future market volatility.
Risk Management Tool: For portfolio managers and sophisticated investors, the VIX can be a tool to hedge against market volatility or to take a position on future volatility.
In summary, the VIX is a key measure of market expectations of near-term volatility conveyed by S&P 500 stock index option prices. It has become a crucial tool in financial markets for hedging, trading, and investment strategy formulation

DOW JONES Channel Up still holding, aiming at All Time Highs.Dow Jones (DJI) maintains its bullish trade within the Channel Up pattern that started on the October 27 Low. The 4H MA50 (blue trend-line) has been supporting since November 01 and as long as it continues to do so, the index is more likely to test the 36975 All Time High (Jan 05 2022). Especially since it is currently on a 4H MACD Bullish Cross.
The previous two MACD Bullish Crosses have delivered rises of around +2.70% to the top of the Channel Up. Another +2.70% rise will send the price above 37000 and that is our target. If however the index closes below the 4H MA50, we will take the long's loss and reverse to a short immediately, targeting the bottom of the Channel Up. If the price closes below it, we will re-sell and target Support 1 at 35300, where potentially contact with the 4H MA200 (orange trend-line) can be made for the first time since November 02.
-------------------------------------------------------------------------------
** Please LIKE 👍, FOLLOW ✅, SHARE 🙌 and COMMENT ✍ if you enjoy this idea! Also share your ideas and charts in the comments section below! This is best way to keep it relevant, support us, keep the content here free and allow the idea to reach as many people as possible. **
-------------------------------------------------------------------------------
💸💸💸💸💸💸
👇 👇 👇 👇 👇 👇

DOW JONES Next stop 37000Dow Jones held the MA50 (4h) today after the initial NFP decline.
This keeps the Channel Up intact on its upper layers, aiming for a new Higher High.
Trading Plan:
1. Buy as long as the MA50 (4h) holds.
2. Sell if it breaks.
Targets:
1. 37000 (Fibonacci 1.78 extension, like the Nov 15th Higher High).
2. 35700 (bottom of Channel Up).
Tips:
1. The RSI (4h) rebounded exactly on the level (Support 1) the Nov 9th did. The two legs are so far very symmetrical and promt to the extension of the Channel Up.
Please like, follow and comment!!
Notes:
Past trading plan:

Updated SP500 Analysis. FORECASTS REMAINS UNCHANGEDHas Elliott Wave Lost Its Forecasting Accuracy?
I cannot recall the exact setting, but many years ago I was asked this specific question…
” …as the number of practitioners of Elliott Wave Theory grows due to its popularity, won’t more people be trading these wave patterns and in doing so, somehow skew the theory’s efficacy”?
It’s a great question.
One in which I think requires a more nuanced, rather than simple answer. Forecasting markets using Elliott Wave Theory (EWT) is only as accurate as the practitioner. With respect to EWT, if one could consider being in a renaissance of sorts, I would say, now is that time, because of the increase in practitioners . Since R.N. Elliott’s final published work, Nature's Law –The Secret of the Universe published in June, 1946 several individuals have contributed to the theory in incremental ways. However, this article is not about the history of Elliott Wave theory, but a thought experiment in the continued efficacy of what I would consider to be the only effective and comprehensive analytical tool that describes the price movements of markets.
If there is one phrase, I have used over the years to explain short term pattern ambiguity it would be…
“Nothing clears up the current price action, like more price action”.
Meaning, at times, an objective practitioner of EWT can decipher a pattern in different ways, and what will deem the current pattern, optimal , will be the price action that follows. This is the primary reason I include alternative counts within all my published work. However, I am a purist in the pursuit of arriving at a truth. Using EWT, I find the truth mostly has two potential outcomes, and only the price action that follows will lean more so towards one, rather than the other. That is why I believe that when one shares their work with the public, (like here on Trading View) it should be their own work, and not a concoction of other people’s work posted on the Internet, and peddled as one’s own. As a trader, I think there are no rules that govern the pursuit of profit. As an analyst, I believe when sharing an analytical forecast, it should be the work of the one posting. Explaining how I determine some people are posting analysis that is an aggregation of other public postings is of less importance than remaining on topic in relation to the efficacy of EWT in forecasting. Last year, I was rated the top author on Solana, a crypto currency. I no longer share my analysis on Solana with the public. However, a quick search of current analysis on Solana yields ideas that lack context, or make bold predictions, that I can say are not based on a rules-based forecasting tool like EWT. This is one method I use to discern the analysis is either not their own, or is not worthy of using hard earned money to get behind. Solana, as a chart falls into the category of having one primary analytical thesis, and an alternate for me. Ironically, in this case, they both point higher towards triple digits. I see nothing posted on Solana here that contains the context of why prices have moved higher and where they will go over the very long term. Additionally, there is nothing contained with the Solana chart that tells me new lows are option to be considered. Yet, some with say that is precisely where that crypto currency is headed.
I often wonder when substandard analysis is shared with the public does it change the optimal pathway of correct analysis. It's impossible to know for sure. However, it seems reasonable to think that the longer-term targets would not change, but the smaller timeframe sub-divisions might. This may lead to more short term complex patterns, but in the grand scheme of things, the efficacy of EWT I do not think is harmed. Traders who follow EWT analysis may find mixed results. That is why if you follow anyone else's analysis on the Internet, make sure they are providing details, context, the nuance behind what could happen, versus shallow context and a lack of a well thought out thesis. It is possible, you're reading someone's else's work, interpreted and passed off as their own.
This leads me to my updated analysis on the SP500.
My last post on the SPX futures was on October 28 which was one day after the market bottomed. The purple pathway I deemed low probability. In retrospect, this is precisely what has played out. However, now that price has rallied swiftly higher, I have to consider yet another possibility.
The blue count in the chart above.
As of this morning, both my primary black, and first alternative count, has the index in a c wave lower towards the lower 3,000 area. Black subdivides more so than purple, but they ultimately arrive in the same area. The blue count requires some explanation and the context to warn followers of this sort of price action will play out. Regardless of my primary, first or second alternate counts, a retrace should begin soon. In the case of black and purple, those retraces turn into impulsive patterns towards my target. However, in the case of the blue second alternative, that retrace will take the form of a 3-wave pattern, but ultimately reconcile higher. This resulting higher price action can be for a new high in primary B, or an even higher high resulting in new all-time highs, as v of 5 of Supercycle wave (III). The interesting aspect of either of those moves higher results in an ending diagonal by virtue of overlap that occurred on October 27th 2023.
THIS WILL RESULT IN A MARKET CRASH SCENARIO.
Price will return to their point of origination, which in the case of a new primary B wave high, that price originated at 3502 in October of 2022. In the case of new all-time highs for wave (III) in the super cycle degree, that is the Covid-19 bottom at 2191, which occurred in March 2020. Therefore, I'll conclude by saying that we should all expect a retrace lower to start as early as next week. To what extent, will determine the direction of the SP500 into the first half of 2024. Is there a possibility of the index making a new high? Current price action suggests I cannot rule that out...but so far, (Even this very impressive November 2023 rally) leads me to believe anything has occurred to make me change my original forecast of 3200-3300 in the SPX Futures.
If we do decide to go up and make new highs...I think for this trader, that may be cause to get flat assets in general and to the degree it makes sense. I'm referring to assets directly AND indirectly associated with the stock market.
Best to all,
Chris

Dow Jones broken into a BULL MARKET New All Time Highs comingReverse Cup and Handle has formed on Dow Jones...
This was also coinciding with the broken downtrend that took place early this month...
We are looking super bullish with great upside to come.
All Time Highs seem to be on the cards, and this could help other markets to flourish...
7>21>200
RSI>50
Target 37,242

DOW JONES: The top is close. Pullback expected.Dow Jones is unfolding the second rally sequence of the 1 year Channel Up and has reached today the 0.786 Fibonacci level of July's High. The 1D technical outlook is about to turn overbought (RSI = 68.650, MACD = 236.580, ADX = 32.415) and as the rally approaches the R1 level (35,100) as well as being almost on the +9.05% range from the bottom, we are looking towards a late April peak formation and pullback.
The pullback is expected to be at a -2.75% minimum, like June 23rd that reached the 1D MA50. Sell, TP = 34,300.
See how our prior idea has worked:
## If you like our free content follow our profile to get more daily ideas. ##
## Comments and likes are greatly appreciated. ##

DOW JONES Consolidation leading to a Christmas rally?Dow Jones / US30 spent all week above the 1day MA50, in fact Friday's rebound took place exactly on it (Support A at 33850).
This is potentially an Inverse Head and Shoulders pattern and with the 1day RSI at 60.00 and over its MA, it draws comparisons with the June 15th pattern, which peaked at +6.08%.
That pattern has same measurements as the current Inverse Head and Shoulders and formed the Right Shoulder in 3 weeks, supported by the 1day MA50.
After that another +6.15% leg brought the price to the 1.786 Fibonacci extension.
Similarly, the current Inverse Head and Shoulders may target the 1.786 Fibonacci, which in this case will be a little under the 35700 Resistance B high.
Buy and target 35500 (a little under Fibonacci 1.786).
Previous chart:
Follow us, like the idea and leave a comment below!!

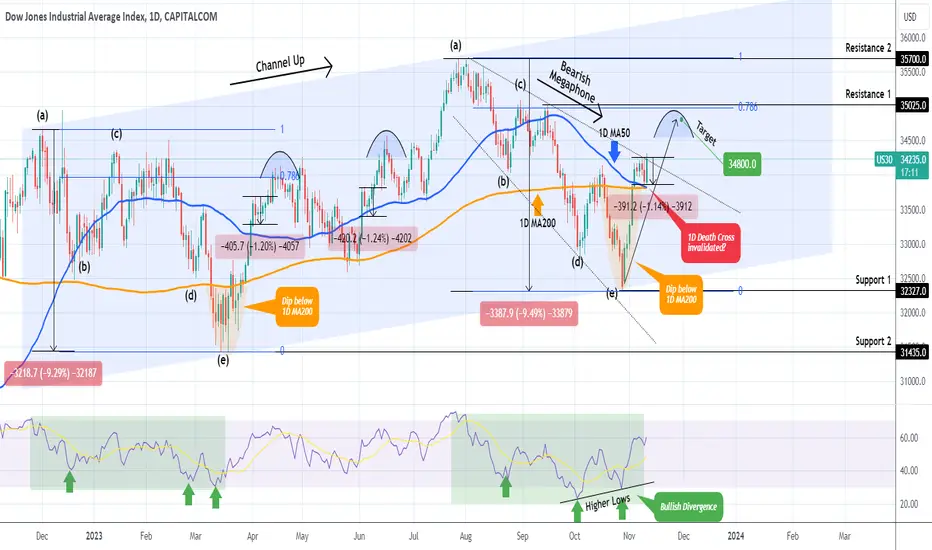
DOW JONES Strong rebound on the 1D MA50!Dow Jones (DJI) is having an excellent rebound ever since our October 31 buy signal (see chart below), which we issued after the index bottomed on the Higher Lows trend-line of the 12-month Channel Up:
The price broke today even above the 3-month Bearish Megaphone, which was the pattern that executed the Channel Up correction. Today's rebound is being done after the index hit and held the 1D MA50 (blue trend-line), which is in fact on top of the 1D MA200 (orange trend-line). If it continues, we may see this 1D Death Cross (a technically bearish pattern) getting invalidated.
However, we do lower our medium-term target from 35000 to 34800 as this rebound is coming off a -1.15% pull-back, which resembles those of June 06 and April 04, that topped on the next rise and then pulled-back to the 1D MA50.
-------------------------------------------------------------------------------
** Please LIKE 👍, FOLLOW ✅, SHARE 🙌 and COMMENT ✍ if you enjoy this idea! Also share your ideas and charts in the comments section below! This is best way to keep it relevant, support us, keep the content here free and allow the idea to reach as many people as possible. **
-------------------------------------------------------------------------------
💸💸💸💸💸💸
👇 👇 👇 👇 👇 👇
Weekly Update: Fire is MesmerizingAs we continue to subdivide within this larger cycle wave a down targeting the low 3,000 area, we appear to find ourselves in a countertrend b-wave retracement. This area has the potential to carve out potential complex patterns as b-waves and wave 4's are the areas where traders are frustrated from a sentiment standpoint.
I do not think we should be prepared for an easy consolidation and additionally, I believe we could be for a while. Within this area price should behave within a range. It would not be uncommon to experience irregular corrective patterns that slightly exceed previous highs or lows. As a Pattern Analyst I have no mechanism to forecast these sub-divisions.
My main reason I believe we stay contained within a range is based entirely on 2 aspects of data. (1) we have retraced much higher than in standard form, and (2) The IWM just completed it's b-wave triangle, and if recent history is any guide when comparing small caps to large caps is there appears to be 1-3 month lag in the broader markets. See my small cap analysis here .
Nonetheless, what comes next is a c-wave. If you have followed me for a while, you'll know a c-wave down feels like a crash. I'm not saying the stock markets are about to crash...I'm simply saying that soon if you find yourself saying out loud, "This feels like the stock market is crashing" ...that's how you know you're in a c-wave.
Are the bulls playing with fire here? My mom always told me that fire is mesmerizing, but don't you dare touch it.
Best to all,
Chris

Weekly Update: Do Small Caps Still Lead the Broader Markets?We've all heard that the small capitalized publicly traded companies lead the larger cap companies, more so featured in the broader indices. A quick look back shows the Small Caps Topped in November 2021, whereas the Nasdaq and SP500 did not top till January 2022. Subsequently, the IWM bottomed in June of 2022, and it took the NDX and SPX till October of 2022 to form a bottom.
So it appears we do not have to go back too far to see this phenomenon is still valid. If this price action of leading the broader markets continues to persist, then the IWM is now poised to literally "Drop like Rock".
A quick observation shows the small caps are around their lows bouncing slightly for wave 2 in our primary c-wave down. You can read my prior posts on the SPX and NDX indices but it appears if you want to know if the recent bullish feeling rally in the DJIA, NDX and SP500 has sustainable legs...look no further than the IWM.
Best to all,
Chris

US STOCKMARKET CRASH : DJIA 20000Monthly chart analysis
Dow jones to fall to $20,000
Reason : geo politics
Us/china war over taiwan will disrupt supply chain worse than covid
World wide inflation.

DOW JONES Technical pull back ahead of Golden Cross (4h).Dow Jones is on course to form a Golden Cross on the (4h) time frame within 2 days.
Despite being bullish medium term, this pattern has caused a minor short term pull back all the prior 3 times it emerged in 2023.
Trading Plan:
1. Sell on the current market price.
Targets:
1. 33750 (-1.20% decline, same with all previous cases).
Tips:
1. The RSI (4h) got overbought on Friday, as it had done all of the previous 3 fractals we are looking at that preceded the Golden Cross (4h). An additional sell signal.
Please like, follow and comment!!
Notes:
Past trading plan:
