HAS DOW STARTED ITS JOURNEY TO DOWN SIDE SEE YORSELF !!!COMPARING MY SATEMENTS FOR LAST TWO POSTS WITH THE ACTUAL MOVE IN DJI
1. In yesterday post point no 2. I clearly mentioned that if dow opens gap down . As it opened slightly gap down, one should wait for price breching red dotted zone to short . In monday post I clearly mentioned that swing high Z is the stop loss for shorts positional trade. That high is still intact. Both days post are attached for those who really want correct insight for this index. They can check all details to understand the present phase of dow.
2. As you can see price is still above the red dotted line so this is no trading zone for positional new traders . Those who are already in trade can put sl of Z point swing high. Now for new traders, for positional trades , let price break the lower end of zone and it sustains 30 mins after breaking then positional shorts can be initiated. Trend change to upwards direction when price breach Z swing high. Rest market will decide.
YOGESH VATS
Djiaprediction

Ready for ONE MORE Time BUBBLE Crush ?( Next Month)Ready for Crush? End of This month until June End, All Market gonna Crush Again.
Currently, Market not move technically or fundamentally, Only pump and dump with fear of Covid-19
Fed Helping Market to stable but for how long they can stable once this Virus long down End, Stock COULD crush one more time then later year Pull back.
🛑SUPPORT/RESISTANCE
✅S1= 23800
✅S2=22000
✴️R1=24500
✴️R2=25100
Please like, share, comments and follow me to get daily base analysis
Thank you for your support, I appreciate it.
DOW JONES INDUSTRIAL AVERAGE INDEX (DJI) DailyDates in the future with the greatest probability for a price high or price low.
The Djinn Predictive Indicators are simple mathematical equations. Once an equation is given to Siri the algorithm provides the future price swing date. Djinn Indicators work on all charts, for any asset category and in all time frames. Occasionally a Djinn Predictive Indicator will miss its prediction date by one candlestick. If multiple Djinn prediction dates are missed and are plowed through by same color Henikin Ashi candles the asset is being "reset". The "reset" is complete when Henikin Ashi candles are back in sync with Djinn price high or low prediction dates.
One way the Djinn Indicator is used to enter and exit trades:
For best results trade in the direction of the trend.
The Linear Regression channel is used to determine trend direction. The Linear Regression is set at 2 -2 30.
When a green Henikin Ashi candle intersects with the linear regression upper deviation line (green line) and both indicators intersect with a Djinn prediction date a sell is triggered.
When a red Henikin Ashi candle intersects with the linear regression lower deviation line (red line) and both indicators intersect with a Djinn prediction date a buy is triggered.
This trading strategy works on daily, weekly and Monthly Djinn Predictive charts.
This is not trading advice. Trade at your own risk.

GET READY TO SEE TREND CHANGE IN DOW FROM MONDAY ONWARDS TRADE PLAN FOR 18/5/20( MONDAY)
1. The chart I am showing is the daily chart of DJI . Here currently dow is in local distribution phase , where last leg of upwards move is going on. In fact intermediate corrective structure last leg.
2. This is irregular corrective pattern whose last leg is expected to go in red dotted upper micro zone . This the point where this local phase of distribution will end with the completion of c leg of intermediate correction is expected to finish. It may be possible that price would move from lower end of red dotted zone to down side.
3. When this sort of structure gets completed , then with trend gets started that is from point Z is down. Therefore, as per my analysis dow will see fall from Monday on wards. As you all know stock market is game of probability nothing can be 100% sure. So some conditions also apply with this analysis. lets us discuss them in detail.
4. You can see in fig. I made an arrow of green color pointing towards up side. In fact that is showing one condition here. The condition is If price breaches the upper end of micro red dotted zone and comes back in next one hour with out breaking swing of upper side and the day candle closes in red zone, then this zone will remain intact. And positional shorts can be taken with the stop loss of upper swing high. with the first target of blue support line.
5. On the other hand , on breaching price from upper band of red zone and price do not cone back in next one hour of trading then sentiments of shorts will change to longs. Rest market will decide . Price is supreme.
YOGESH VATS

DJI: Market Showing Weakness, Short Term (May 3)X Force Global Analysis:
All markets is currently showing weakness in both technical and fundamental reasonings. With no clear signs of recovery for the COVID-19 situation, we may see an uprise of technical traders taking advantage of the situation to drive price down even further trying to keep the technical aspects on a larger picture in tact.
With that being said, we can see a clear break of the 1D rising wedge that may drive us down to the main three fib levels.
Another interesting correlation is with the cryptocurrency markets, where Bitcoin is showing similar signs of retracements and bounces. Please check the extreme similarities in our other analysis:
Trade Safe.

Is It Time For The Recovery? Or More Down Side? (DJI)Their is a lot to study here.
Ever since our initial breakout we have not seen a retest on the breakout to test for a support.
Each impulse has decreased roughly by 7% each push back up.
The last wave was a 7% impulse as we reach the level of Resistance.
The decrease in buy percentage could represent a correction to come.
24815 is key break level for upside continuation.
If it did fail to breakout out I'd look to play a bounce off the downward breakout level to see if we can find support.
Total we have 5 waves up to current level. Could be end of a wave cycle.
I know that these times have impacted many lives and ultimately I just wish it would fly back up and the world can go back to work.
Very critical area for the stockmarket around these levels.
Enjoy.

SPX: The Great Depression and Today's Market 1W (Apr. 27)X FORCE GLOBAL ANALYSIS:
The Great Depression that took place in 1929, took 10 years to recover, and is still remembered as one of the most devastating events that hit the stock market. Today, the stock market is recovering from a devastating hit caused by a virus outbreak (COVID-19). Governments and banks have worked together, initiating both monetary and fiscal policies to resuscitate the market. However, doomsday theories arise, comparing the current situation to that of 1929. In this analysis, we explore the possibilities of a Depression in 2020.
Analysis
- First off, we look at the technicals, comparing the Dow Jones Industrial Average in 1929, and the S&P500 in 2020
- Visuals demonstrate a similarity in terms of the general trend
- Both charts start off with a parabolic move (not demonstrated above).
- Then, a phase of consolidation - marked by the red zone - which represents base 4 of a parabolic move
- The first thing to note during this phase is that we see an extended bearish divergence
- Prices form higher highs and the Relative Strength Index (RSI) forms lower highs, demonstrating a lack of strength in the bullish trend
- After reaching the peak, we see the Moving Average Convergence Divergence (MACD) form a death cross. This death cross marks the beginning of a temporary bearish trend reversal
- Then a bounce near the trend line takes place. During the Great Depression, DJI bounced over 50% before continuing to drop. SPX has currently bounced over 30%.
- As it bounces, an ascending bearish wedge pattern is formed
- As the ascending wedge pattern reaches resistance between the 0.618 and 0.5 FIbonacci resistance zones, a rejection takes place
- Prices drop further, and we see a continuation of a downtrend following the descending trend line, marked by the dotted purple trend line.
- According to Ray Dalio, one of the most successful hedge fund managers in history, there are debt supercyles
- The last debt supercycle ended in 1929, and usually last 50-100 years
- Because this crisis was initiated by a viral outbreak, the real economy has also been significantly damaged, with unemployment rates having skyrocketed
Counterarguments
- Unlike the government and banks back in 1929, we are more prepared for a crisis today.
- The US has initiated Quantitative Easing at an unprecedented rate, and the Fed has cut interest rates like never before in history
- As biomedical companies heavily invest in medicines and vaccines, we see hope in eradicating the virus.
- Since this crisis was triggered by the virus, mass production of a vaccine could immediately end the crisis (driven by bullish anticipations of the future), and possibly take us to all time highs
- The doomsday prediction has been a popular argument for years. Ray Dalio has also been taking about the possibility of a debt supercycle since 2016.
Market Sentiment:
The fear and greed index for the S&P500 Index still points towards fear, despite the huge bounce we have recently witnessed.
What We Believe
It's impossible to perfectly predict and time the market. Leveraging for maximal positions in the market is definitely not optimal, and so is terminating all positions to catch the bottom. We believe that the trend is your friend. Identifying short, medium, and long term trends is absolutely essential, and choosing the right stocks, with strong fundamentals that can stand the test of time throughout this crisis, is the recipe for success.
Trade Safe.

Dow JonesSymbol: DJI
Who said major recessions couldn't be predicted?
Buy green
Sell red
I'm just sayin.... 🤫
----------------------------------------------------
Want to level up your trading skills?
We just realesed our new course! Follow our tradingview page and visit the link in our bio if you are looking for new strategy to add to your arsenal.
Also checkout our trading indicator available in the link on our page.
---------------------------------------------------
Thank you for your continued support, God bless.
- Major League Trader

The Fakeout BounceWhether old charts, new charts, big drops or smaller ones - charts with sharp drops in price share very similar characteristics. I decided to use two very different examples; one from a different period in time, though similar to our current move in size (Crash of 1929), and one from our current time period and though much smaller in size it still meets the sharp drop criteria (January 2018).
This move is pretty standard in these scenarios, a sharp wave 4 retracement after a massive wave 3 drop setting the stage for wave 5. Me personally, I am looking at the 1.272 extension as a potential bottom on this move, plus 2000 is likely to be a psychological support as well. Looking for that move to conclude most likely by month's end.

Dow JonesStock Symbol: DJI
Big picture, don't fight it. Let it correct. It is way to early to make a call on this. We are viewing this from looking way out. That is a massive red doozie. Waiting for solid compression. Last break like this was the 2008 collapse. I ain't touching it.
Diversify and use 5% stoploss
----------------------------------------------------
We just realesed our new course! Follow our tradingview page and visit the link in our bio if you are looking for new strategy to add to your arsenal.
Use Promo Code: FIRST100 to receive $50 off of your course!
First come, first serve / Code valid for first 100 buyers. Normal price $99
---------------------------------------------------
Thank you for your continued support, God bless you though these times.
- Major League Trader

This chart should scare the hell out of you.Doing a lot of research lately on the crash of 1929, and how that played out. In the first leg down (similar to where I think we are today), the market fell 40-50% in 3 months, similar to now.
Then we had a snapback bear market rally, regaining 50% back of what was lost, which keep in mind means you only got back 20-25%. This took 5-6 months to play out, and I believe this will be the case starting in May/June and ending around October/November right before the election.
If things play out as I think history has already fortold, this would be a sweeping victory for Biden which will usher in an era of socialist policies, and continue to support a further burning of stock markets until ~2022.
So enjoy that snapback rally in the summer months and then if things start looking bad again, Get the F*** Out, or go short.
BECAUSE, after the initial 5-6 month snapback rally of 1930, the market rolled over for another -85% decline!...
I truly believe that there will be no safe place if this plays out.
Commodities will go down, real estate will go down, crypto will burst and the few names that remain after will be like true gold, silver, platinum and such.
This all being said, I'm not a fortune teller and this is not financial/investing advice. What this is is some perspective.
And it makes sense if you think about our current demographics, war timelines, wealth inequality, inflated asset prices, and a bubble almost anywhere you want to look.

Dow Jones SelloffEven with the bounce that Dow Jones is experiencing, the general trend is still bearish and will likely be for a while as long as Covid-19 is around. At the end of trading hours buying spiked, hinting towards a sharp selloff, as has happened the last 4 times it has spiked last minute. On top of this, the 10 day RSI has just reached 70, suggesting it is now in the recovery's overbought territory. Although the stimulus bill is a much bigger deal, the market has not yet compensated for the impact of the record unemployment rate. If it goes up tomorrow, I believe it will be a very risky bet to hold on during the weekend since the 3 largest percentage losses have happened on Mondays.

Rally on DJI (Dow Jones)The Dow Jones Industrial Average rose more than 11% to clock its biggest advance since 1933. Dow Jones futures jumped Tuesday morning, along with S&P 500 futures and Nasdaq futures, amid optimism about a massive stimulus deal.
New support at 20,000 for DJI. Not sure how long this rally will last because its basically akin to printing money to keep the economy going. I feel the fundamentals are weakening but the artificial support might keep the market alive for a short period of time but long term wise, might be harmful for the economy. Just my 2 cents. hmm..

DJI MACRO VIEW, M, 37% Consolidation Coming From Bull Decade!1. Monthly Chart shows the same RSI oversold conditions as the high in 2007 time-frame (79 RSI) that led to the 2008 downturn.
a. Current chart shows the same oversold conditions in 2018 (80 RSI) which are leading to the now late 2018/19 downturn.
b. Retracement was roughly 50% during this past market collapse because support were the 2002/03 levels and RSI of 17.9 indicated severe oversold conditions.
2. After 2008 consolidation the new support level were the lows of 2002/03. (Big Psychological Factor for Traders to Re-enter Bearish Market)
a. Future chart shows the new support level will be the 2015/16 support.
b. Retracement lines up with the Fibonacci retracement of roughly 38% where support from the 2015/16 levels will prevent the market from correcting to the 50% levels of 2008.
The time-span was 518 days during the 2007/2008 retracement.....which led me to conclude that by January of 2020 the market should begin recovering after finding the 2015/16 support and showing oversold RSI conditions.
Mere speculation of course since past performance does not reflect future results, so please don't bet your life savings.

DJI ~ My Corona?The black swan is here. COVID-19 will cause economic and health warfare for the foreseeable future.
Publishing this to be able to watch it unfold over the years.
It's based off 3 month candles displayed as a line chart.


DJI 30 min Chart - Sell to reach 2nd targetbeside March 10 posts
now we Sell US30 30 min - Head and shoulder pattern
expect to reach 2nd target 18000 - 17826.

DJI Stock - A global market collapse 2020I am not an expert TA or Analyst. These messages are based on my own knowledge, research, and learnings. I may be wrong or I may be right but this is how I see the current market during a crisis within a crisis (financial & health crisis).
The sentiment speaks what the chart is telling us and currently, we are in FEAR & UNCERTAINTY or the people finally awake how our old financial system work. Let us see what really is 2020 for each one of us!
Stay safe, protect your assets and be smart! :)

DOW JONES INDUSTRIAL AVERAGE INDEX (DJI) MonthlyDates in the future with the greatest probability for a price high or low

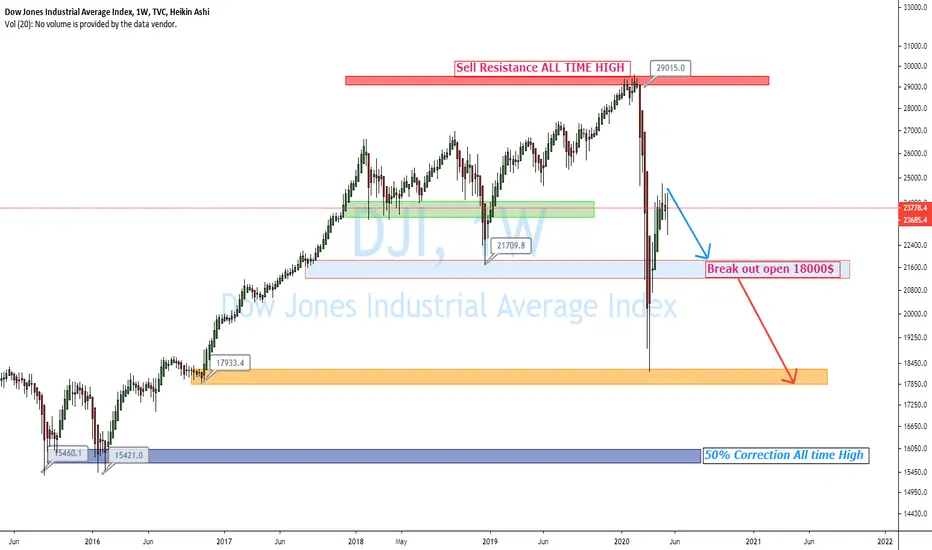
DJI DOW HUGE RECESSION CRASH, 50% CRASH BEFORE EOY *UPDATED*After i sucessfully predicted this massive crash 7 Months Ago on my original chart idea, i decided to update with potential targets and say that dow could go as low as 15-16K before we find an official bottom


DJI BUY FOREXCOM:DJI BUY from current price
TP1-26910
TP2-27450
Hi traders here i have a buy idea for DJI
What are your thoughts share your opinion on the comments also support me with likes
