Dow JonesSymbol: DJI
Who said major recessions couldn't be predicted?
Buy green
Sell red
I'm just sayin.... 🤫
----------------------------------------------------
Want to level up your trading skills?
We just realesed our new course! Follow our tradingview page and visit the link in our bio if you are looking for new strategy to add to your arsenal.
Also checkout our trading indicator available in the link on our page.
---------------------------------------------------
Thank you for your continued support, God bless.
- Major League Trader
Djiashort

$DIA Bears VS BULL Final Round (Bears are against the ropes)Possible start of a bull market or just a reprieve for the bulls? Will the Bears strike a knockout punch? Or do the Bulls have Aaron Rodgers for the hail Mary? The war is nail biting and only the victors write history.
Technical Analysis: I think the market is in a very important place facing 3 major resistance after its latest run up. From a technical perspective the run up in equities is still well within what is expected for a re-tracement and what I believe to be the B wave in an ABC correction. I have noted the major resistances I feel we need to hurdle past before we can call this a new Bull market. Next week will be telling and I would not go into next week short or long any positions (unless they are long term trades). A lot can happen over the long weekend but I fail to see how things can be assumed as okay in the financial world even after (and hopefully soon) we get past covid and people get back to work.
A lot of damage has been done to the world and we could be headed to a global recession.
For the bulls, if we do break above R3 then we can expect shorter bull market before the bears regroup to fight another war.
Please do your DD

The Fakeout BounceWhether old charts, new charts, big drops or smaller ones - charts with sharp drops in price share very similar characteristics. I decided to use two very different examples; one from a different period in time, though similar to our current move in size (Crash of 1929), and one from our current time period and though much smaller in size it still meets the sharp drop criteria (January 2018).
This move is pretty standard in these scenarios, a sharp wave 4 retracement after a massive wave 3 drop setting the stage for wave 5. Me personally, I am looking at the 1.272 extension as a potential bottom on this move, plus 2000 is likely to be a psychological support as well. Looking for that move to conclude most likely by month's end.

Dow Jones SelloffEven with the bounce that Dow Jones is experiencing, the general trend is still bearish and will likely be for a while as long as Covid-19 is around. At the end of trading hours buying spiked, hinting towards a sharp selloff, as has happened the last 4 times it has spiked last minute. On top of this, the 10 day RSI has just reached 70, suggesting it is now in the recovery's overbought territory. Although the stimulus bill is a much bigger deal, the market has not yet compensated for the impact of the record unemployment rate. If it goes up tomorrow, I believe it will be a very risky bet to hold on during the weekend since the 3 largest percentage losses have happened on Mondays.

Rally on DJI (Dow Jones)The Dow Jones Industrial Average rose more than 11% to clock its biggest advance since 1933. Dow Jones futures jumped Tuesday morning, along with S&P 500 futures and Nasdaq futures, amid optimism about a massive stimulus deal.
New support at 20,000 for DJI. Not sure how long this rally will last because its basically akin to printing money to keep the economy going. I feel the fundamentals are weakening but the artificial support might keep the market alive for a short period of time but long term wise, might be harmful for the economy. Just my 2 cents. hmm..

DOW JONES INDUSTRIAL AVERAGE INDEX (DJI) MonthlyDates in the future with the greatest probability for a price high or low

DJI DOW HUGE RECESSION CRASH, 50% CRASH BEFORE EOY *UPDATED*After i sucessfully predicted this massive crash 7 Months Ago on my original chart idea, i decided to update with potential targets and say that dow could go as low as 15-16K before we find an official bottom

$DJT leading $DJIA by 15 months into an election crash?Dow Theory
DJT leading DJI by 15 months.
1987-style crash bottoms on election day.
Just an idea

Trading Pathways Analysis of DJI H4 Chart
The outlined white arrow pathway is the predicted pathway that the DJI H4 will follow in the coming days or weeks. Using my unique charting methods, I have been able to arrive at HIGH PROBABILITY turning points where DJI H4 will turn.
PLEASE NOTE THE ABOVE ANALYSIS IS FOR EDUCATIONAL PURPOSES ONLY. THEY ARE NOT DIRECT INSTRUCTIONS TO TRADE AND ANY LOSS INCURRED BY FOLLOWING THIS ANALYSIS IS AT YOUR OWN RISK.
Eiseprod of Trading Pathways

$DJIA 2019 perfect EW tramlinesDJIA in 2019 was a textbook tramline, even a pitchfork. Expect Q1 7% pullback, then a final 5-wave blowout into the election. Watch out for centreline resistance on the drop.

DJI Future Map - A Correction is Imminent$DJI has been on an absolutely MASSIVE bull run since the collapse back in 2008-2009; a decade ago!
We all know what goes up must come down though and the DJI is due for another +50% correction.
This chart is on the Weekly. I usually prefer using the Day charts however I noticed some interesting trends that I hoped to share.
2008-2009
-The correction in 2008 was 55% from top to bottom
-The RSI at the peak was slightly Overbought so a little surprised the price tanked -7784 points
2016-2018
-The 1.618 ratio (19008) took 8 years to be hit
-The 2.618 ratio (26793) took 1 year, 2016-2017
-The RSI at the 2.618 level was 95 – Super Overbought which made sense to see the beginning of a huge correction however that wasn’t the case. A double top formed at the same level and then -
the price corrected roughly -5000 points, -18-20% towards the end of 2018-2019
-This correction pinged off possibly the 1.702-1.786 level (21712) from the first FIB (08-09)
-The RSI was once again just slightly Overbought at 70-72 level
-Price has continued to climb due to various political measures; volatility between Trump and China (Tariffs) as well as the beginning of the Impeachment talk
-The FED also injecting the ‘NOT QE’ funds into the REPO arena has stimulated the economy as well
-The current RSI is at 67 so it’s getting once again very close to those Overbought levels that haven’t been met since a year ago when the correction occurred
-Trump officially Impeached on December 18th and the $DJI keeps pumping
Beyond
I can’t predict the future but based on my FIB mapping, I’m expecting the possibility of a massive recession/depression type correction to be made when the 3.618 (34577) level is met. This is based on the FIB calculation from 2008-2009.
The current movements are lining up quite nicely with this FIB chart and the new FIB chart if calculated from the future ‘top’ indicates that we will see a re-tracement to the 0.618 (26627) level and in my opinion ultimately back down to the 1.618 (13761) level where I believe a good amount of resistance will be met. This is a negative 60% drop!
In the event 2.618 (896) level is met (worse than a Depression) that’s a negative 96% dump. I dunno if this will happen, but my guess is that we'll see this drop in-between 2021-2022.

DJIA - Weekly View - Matter of time - Part 1 of 2Ascending wedge pattern, within another ascending wedge.
DJIA shows that broader correction in all equities should happen soon.
Market is overbought, pattern is exhausted.
Failure of inner ascending wedge still puts price pattern in other ascending wedge. Both bearish.
This price action confirms that SPY should see further down movement.
I will put up another daily chart showing closer price action.
Thank you for liking, commenting, throwing up a chart, following, or viewing.
I am not a financial advisor. My comments and reviews are based on what I do with my personal accounts.
Disclosure - I am long MARA, GBTC, BTCUSD, GDX, VIXY.
Short SPY and AAPL.


DJI Short --Waiting for Catalyst TVC:DJI FOREXCOM:DJI TVC:DJI OSE:DJIA1!
Waiting for catalyst to Short the market

$DJI #DJI double top - likely to correct.DJI double top pattern formed.
Look for support on the 50,100 or 200 day SMA.
More support lines indicated w/ magenta lines.
This can't go up forever. This is not financial advise, because I am not a financial adviser........ I am just a dude.

Thoughts on the Dow Jones Heading Into the WeekendHope you guys enjoy the video, be sure to leave a like, comment, and follow for future posts!
The Dow Jones was down about 600 points today as President Trump continued his sparring session with China, and increased tariffs yet again. We can see a dangerous M forming on our 1 day time frame and I indicated crucial support levels with the fibonacci as well as the dashed red line. If those levels do not hold, we will see the Dow take a plummet in the next week, and the talk of a recession may become a reality. Looking at our shorter time frame, we can see the Megalodon timer giving us a green. I hope that this is a sign that buyers will hold the support levels for the Dow Jones, and hopefully the US and China can come to an agreement soon, so that we may continue our bullish run in the stock market!
Our most powerful indicator called the bottom on Bitcoin! Check it out here!

What's Next For the Dow Jones?The Dow Jones has been all over the news as always, but very volatile as of late. With trade wars escalating, the question of a recession is at the front of the headlines. If we look at our 1 day time frame we can see our fibonacci retracement level right below the dashed line I put on the chart. This is the danger zone. Looking at the chart pattern we can see a dangerous M beginning to form. The MacD also looks suspect as the DJI had a rough day. If the Dow cannot hold these levels between the dashed line and the fibonacci line, we may really see a volatile downwards movement. It is not looking great. If we turn to our shorter time frame though, we can see that the Megalodon timer is giving us a green. Hopefully this will be enough to boost us back upwards, because if not... the talk of a recession may become a reality!
The Megalodon indicator uses a machine learning algorithm, combined with data from over 500 buy setups, and over 2000 indicators to produce extremely accurate buy signals on any and all asset classes! You will also receive real time buy and sell signals for the stock market, cryptocurrency, as well as forex markets! We also completed our cryptocurrency automated trade bot. It trades for you, using our backtested indicator with phenomenal results! Click the link in my bio and try out the megalodon indicators today!

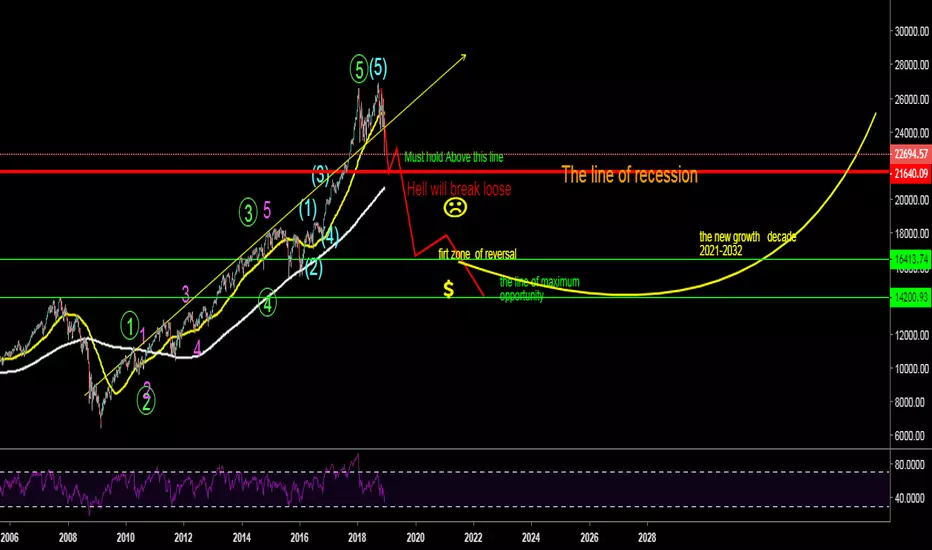
Recession Part 1 : The Dow CrashSince last recession(2007-09) DJI have been growing steadily in last 10 years without any break.
All impulsive trends comes with pullback/recession/ and DJI is no such exception..
If dow jones cant hold above the redline (21640) we might see big down trend coming in markets which has already been started.
Few reason:
www.nasdaq.com
www.theguardian.com
www.washingtonpost.com
If recession comes then it would be a new opportunity in coming decade and can make you super rich and wealthy.But the question is will you be at the right side of the trend?
DJI 1HR Chart LONG ChanneltradingHello to all watching my charts.
Here is the Dow Jones DJI in a 1 HR in my chartsystem
with channel trading.
At the moment we are long and we will check on monday
whether these channel will continue to give further up the direction
or if the index will fall out or make a break out.
Whats very interesting is that same channel in the past has function
as support and resistance in May.
Best trades for all
Renkotrade

DJI Situation end of 15.3.2019 LONG
Hello everyone who is watching my charts.
Here is the update to the end of today's DJI trading day
The situation remains unchanged.
What should we pay attention to on Monday?
We now have 2 long trend lines
the one in the steep Long channel I have marked blue.
But I'm afraid this steep uptrend will not last long.
But below that we have an interesting 2nd new long trend line which has developed the last few days and which I marked red.
This trendline seems to me to be the more important in the longer term,
As long as they do not break the situation continues long.
First a break of this red line puts the Long Setup in a neutral setup.
Underneath there is an important support in the area 25550 which I marked black.
If it breaks we are in Short Terrain.
But at least there is no sign of this level tonight.
---------------------------
--This information is not a recommendation to buy or sell. It is to be used for educational purposes only .Alllways do your own research---
----------------------------

DJI LONG BREAKOUT 15.3.2019 11:30 NYTNow we have an interesting sign here.
DJI has break ot of the short channel (i have marked them in red)
and comes bak to our well known blue trendline from 11.3.2019
Thats a really strong sign.
DJI managed not only to go sideways out .
Strong up and trading along the long line in blue.
I exspected now higher prices
Also to notice
We have taken out the resistance at 25757 and thats also a fine
long sign.
I will update that at end of todays trading.

DJI SHORT end of 12.3.2019In the opposite direction to the Nasdaq situation we have here now the DJI.
DJI is still caught in the bigger short channel i have marked in red lines.
He tried to go out at end of yesterday and start of todays trading but
the outbreak failed.
Now the upper line (i have matrked the channel in red lines)
is the important resistance line for the ext trading days.
Unfortunately for the bulls the yesterday established
long trendline has been broken today (now in orange color)
That not a strong sign.
It is to exspect either a fall dwon in the trend channel or a
sideways go out, but also these possibility is NOT a long
setup.
If that occures we have to check the situation new
whether there comes up a new long trendlie or similar strong signs
or not.
So for now situation is still Short in the channel
--This information is not a recommendation to buy or sell. It is to be used for educational purposes only .Alllways do your own research---

DJI SHORT end of 8.3.2019 Short trendchannels establishedDJI is now rading in he new short trendchannel
i have marked them with red lines.
These channel is split in a smaller more shorter range
i have marked ht upper line of that part of channel in purple and the its own lower side , marked in red.
So in a few words:
Between the lower red and the purple line
has been the shortest range.
1 Time Buyers have tried to put DJI out of them
but since end to 8.3. they have not really been succesfull.
We have to check on monday whether the next try which has been started at end of yesterdays trading (25548) will be now successfull.
That would be a first sign of a litte bit revocery.
Next step would be to get on the upper side and upper trendline
(upper red line) of the channel
If DJI reach the level of 25600 till end of monday trading
and climb avove that aerea the setup will going to neutral.
All below this is stay in short
