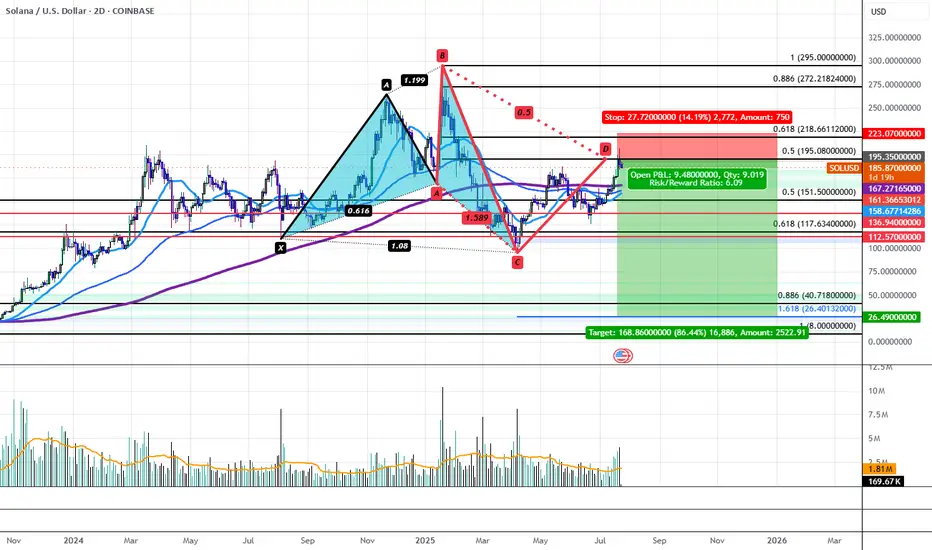
Solana's Bearish 5-0 is Locking in a Bearish Reversal to $26.40Solana has recently run up to Horizontal Resistance Zone of $195-$210 aligning with the PCZ of a Bearish 5-0 and has begun to impulse downwards with volume to back it. This could be the start of a greater move down that would take SOL back to the low of the distributive range at $95.16. If the level breaks, we would then target a drop down to the $40.72-$26.40 confluence area aligning with the all-time 0.886 retrace as well as the 1.618 extension from previous swing low to high. Only at these levels could we even possibly begin to consider Bullish Entries on Solana.
Djt
Upside breakout looks imminent The technical pattern is near to resolution any time now, maybe this week or next week. Then I expect an upside breakout.
After the bitcoin treasury news was announced the stock spiked and then sold off (typical when a company announces dilution). They reported the raise was complete late on Friday, then a few decent buys came in but most buyers haven't had chance to re-enter yet.
Any more bitcoin treasury news can be explosive for DJT.
Positive sentiment, meme effect, news, and the bullish technicals and I can see this popping big time!
Not investment advice. Just my own thoughts.

DJT Weekly Options Trade Plan 2025-04-15NASDAQ:DJT DJT Weekly Analysis Summary (2025-04-15)
Below is a consolidated analysis based on the four reports:
─────────────────────────────
SUMMARY OF EACH MODEL’S KEY POINTS
• Grok/xAI Report:
– Notes that DJT is trading near its 10‐period EMAs on both the 5‑minute and daily charts.
– Indicates a moderately bullish short‐term outlook (helped by positive news about “Truth Social” investment accounts) even though the max pain is at $19.00.
– Recommends a call option trade (buy naked call) at or near the $20.00 strike with an acceptable premium (~$0.63).
• Claude/Anthropic Report:
– The report encountered an error and produced no usable analysis.
• Llama/Meta Report:
– Observes that while the 5‑minute chart shows short‐term bullishness (with price above key EMAs), the overall daily picture and max pain theory (targeting $19.00) point toward a slightly bearish bias.
– Suggests trading a put (such as buying the $19.50 put) but notes factors like high daily volatility and mixed indicators.
• Gemini/Google Report:
– Provides a nuanced view where the 5‑minute charts show consolidation near $20 while the daily chart’s indicators (RSI, MACD histogram, bullish postive news) favor a moderately bullish move.
– Highlights key liquidity around the $20 strikes and ultimately favors a call trade—leaning toward a slightly out‑of‑the‐money option ($20.50 call) but noting that trade risk should be managed tightly.
• DeepSeek Report:
– Summarizes the technical picture with DJT trading above short‐term moving averages but acknowledges max pain at $19.00.
– With a positive news catalyst and falling volatility (VIX), it leans moderately bullish and recommends a call purchase at the $20.00 strike.
─────────────────────────────
AREAS OF AGREEMENT AND DISAGREEMENT
• Agreement:
– All models note a current price of roughly $19.96 with technical support around the short‐term (near the 10‑period EMA).
– Ea
ch analysis recognizes key levels: immediate support near $19.85–$19.94 and resistance around $20.00–$20.50.
– Most models see positive momentum from favorable news (Truth Social catalyst) and improving short‑term indicators.
– Options-chain details (high OI and volume at the $20 strikes) underline the importance of that level.
• Disagreement:
– Llama/Meta tilts toward a bearish reading (using daily MACD and max pain theory, expecting a move toward $19.00) and suggests puts rather than calls.
– Strike selection differs slightly—with some reports favoring the ATM $20.00 call (Grok/xAI and DeepSeek) and others suggesting a slightly OTM $20.50 call (Gemini/Google).
─────────────────────────────
CONCLUSION AND RECOMMENDATION
Overall Market Direction Consensus:
The majority of analyses (three out of four usable models) lean moderately bullish on DJT in the near term. Positive technical momentum on the daily charts together with supportive news outweigh the bearish hints (like max pain and Llama/Meta’s view).
Recommended Trade:
– Trade Type: Buy single‑leg, naked call
– Chosen Strike: $20.00 call (weekly option)
– Expiration: 2025‑04‑17
– Entry: At open with an entry price near the ask of $0.63 per contract
– Risk/Reward Targets:
• Profit Target: Approximately a 20% premium gain (rising from $0.63 to about $0.76)
• Stop‑Loss: About 50% loss of the premium (around $0.32)
– Confidence Level: About 70% (reflecting the bullish bias driven by news and short‑term technicals, while remaining cautious of the max pain level)
Key Risks & Considerations:
– The max pain at $19.00 may exert downward pressure as expiration nears.
– Short‑term volatility remains high (VIX at 30.12), so the trade will need tight risk management.
– Should DJT fail to break above immediate resistance or show signs of a sharp reversal (e.g. dropping below $19.85), consider exiting early to protect capital.
─────────────────────────────
TRADE_DETAILS (JSON Format)
{
"instrument": "DJT",
"direction": "call",
"strike": 20.00,
"expiry": "2025-04-17",
"confidence": 0.70,
"profit_target": 0.76,
"stop_loss": 0.32,
"size": 1,
"entry_price": 0.63,
"entry_timing": "open"
}

Bullish Opportunity – DJT (Trump Media & Technology Group)Bullish Opportunity – DJT (Trump Media & Technology Group)
🟢 Entry Zone: 22 - 22.65
❌ No Stop Loss (high-risk, momentum-based setup , but it is up to you)
✅ TP1: 28.00
✅ TP2: 35.00
✅ TP3: 40.00+
🔍 Technical Highlights:
• Price reclaimed the 9 EMA for the first time in weeks – early reversal signal
• MACD bullish cross with growing histogram – momentum building steadily
• RSI rising from oversold levels, suggesting increased buying interest
• After-hours price action shows strength above the EMA zone – buyers stepping in ahead of the open
• Structure resembles the early stages of a breakout move
📰 Fundamental Catalysts Supporting the Move:
• Strategic partnership with Crypto.com to launch blockchain-based ETFs
• DJT to integrate tokenized investment products via its Truth-Fi platform, tied to the Truth Social ecosystem
• This opens up a new narrative: social media meets crypto + ETFs – highly speculative, retail-driven space
• Volume and volatility are picking up following the announcement, driving renewed attention to the stock
📌 Summary:
DJT is setting up for a speculative momentum trade backed by strong technical signals and a fresh fundamental narrative.
No stop loss on this setup — suitable for short-term traders comfortable managing risk manually and long-term investors. If volume confirms, this could move fast.

Future DJT move prediction by the end of may(wave3)using Elliott wave+ fibs to draw the prediction, if DJT can hold the low now, and see an uptrend coming, then this is what i can see in the near future. please do correct me and offer your ideas, thanks

Trump Media ($DJT) – Truth Social’s Latest MovesTrump Media ( NASDAQ:DJT ) – Truth Social’s Latest Moves
(1/9)
Good afternoon, TradingView! 🌞 Trump Media ( NASDAQ:DJT ) is trending 📈, last at $ 29.23 per Feb 18, 2025, close (Yahoo Finance), down 3.82% that day. Q4 2024 showed a $ 401M loss, yet cash reserves hit $ 777M 🌿. Let’s dive into this social media play! 🔍
(2/9) – PRICE PERFORMANCE 📊
• Feb 18, 2025: $ 29.23, down 3.82% from $ 30.39 💰
• Q4 2024: Revenue at $ 1M, down from $ 1.1M year prior 📏
• Full Year 2024: $ 3.6M sales, $ 401M net loss 🌟
It’s volatile, with cash as a lifeline! ⚙️
(3/9) – MARKET POSITION 📈
• Market Cap: $ 6.43B as of Feb 18, 2025, per Yahoo 🏆
• User Base: 9M Truth Social sign-ups as of Feb 2024 ⏰
• Trend: Exploring M&A, per Feb 14 filing 🎯
Firm, betting on growth! 🚀
(4/9) – KEY DEVELOPMENTS 🔑
• Q4 Earnings: $ 401M loss reported Feb 14, 2025 🔄
• Expansion: Plans for Truth.Fi ETFs, per Feb 6 Reuters 🌍
• Market Reaction: Flat post-earnings, per CNBC 📋
Adapting, diversification’s key! 💡
(5/9) – RISKS IN FOCUS ⚡
• Losses: $ 401M hit in 2024, per Feb 14 filing 🔍
• Competition: Meta, X pressure social media 📉
• Regulation: Legal woes linger, per Feb 14 SEC ❄️
Tough, but risks loom large! 🛑
(6/9) – SWOT: STRENGTHS 💪
• Cash Reserves: $ 777M buffer, per Feb 14 filing 🥇
• Brand: Trump loyalty drives interest 📊
• Flexibility: M&A plans in motion 🔧
Got resilience in the tank! 🏦
(7/9) – SWOT: WEAKNESSES & OPPORTUNITIES ⚖️
• Weaknesses: Revenue down, losses up 📉
• Opportunities: Crypto ventures, M&A growth 📈
Can NASDAQ:DJT turn cash into wins? 🤔
(8/9) – NASDAQ:DJT ’s $ 23.93 , cash-rich but loss-heavy, your take? 🗳️
• Bullish: $ 35+ soon, M&A pays 🐂
• Neutral: Steady, risks balance ⚖️
• Bearish: $ -20 looms, losses weigh 🐻
Chime in below! 👇
(9/9) – FINAL TAKEAWAY 🎯
NASDAQ:DJT ’s $ 29.23 Feb 18 close masks $ 777M cash stash 📈, but $ 401M losses sting 🌿. Volatility bites, yet dips are our DCA gold 💰. We grab ‘em low, climb like pros! Gem or bust?

DJT DJT (Trump Media & Technology Group) is showing strong bullish momentum this week, breaking through key resistance levels around $36 with high volume and confirming a potential continuation toward the $45 target. The weekly chart highlights expanding Bollinger Bands and solid price action, while the hourly chart shows bullish EMA alignment and strong momentum, supported by elevated RSI levels. With buyers clearly in control, $45 is a realistic target for this week as the stock maintains its upward trajectory.

1/20 Weekly Watchlist + NotesWeekly Watchlist and Market Analysis Using #TheStrat
Indexes - SPY went failed 2D week following the previous week going 3 and we nearly went 3 on this last week, but came up short with little room to go to previous week highs. This week we look to go 3-2-2U to confirm the month being failed 2D that has now retraced more than 50% of the previous months range, meaning we are now closer to taking out previous month highs than we are to reclaiming previous month lows. With full timeframe continuity green, we know that buyers are full in control at the moment, and this upcoming week looks to confirm that further as we look to target previous weekly highs on our way up to ATH levels. No daily actionable signal and a couple daily gaps to the downside, so we will see what happens Tuesday pre market whether we gap down to give last weeks buyers some corrective activity, whether we gap up, clear weekly magnitude (at the high of the weekly 3 from the week prior to this last week) before seeing if we expand further to confirm the month attempting to go 3 or begin reversing back through last weeks range. Finally, we may just open flat and see where intraday signals and continuity take us.
(Slightly pressed for time at the time of writing so I apologize for the lack of detail like my normal posts)
Watchlist:
Bullish:
NVDA - 2-1-2U Daily, 2-2 Weekly. Daily BF looks interesting
PLTR - 3-2-2U Weekly. High rVOL
WMT - Hammer 2-2 Week, MoMo Hammer Daily. Inside green Month which isn't great this late in the month, but not bad enough to ruin this setup for me
DLTR - Hammer 3-2-2U weekly after month went 3. Looking to go back through the months range now. Note: DG full FTFC red so no sector support
IONQ - 3-1 Week at M Exhaustion. MASSIVE range on this one. Nearly 30% underlying move from weekly trigger to magnitude
HIMS - Hammer failed 2D, Weekly 3-1, Failed 2D month attempting to go 3
Bearish:
DOCU - Weekly 3-2-2 Shooter. Daily Big red 3 following double inside day so potential 3-2D daily to trigger shooter week down. Filling in massive gap from the last earnings report
Neutral:
DAL + UAL: Both have inside weeks. DAL at exhaustion risk. UAL bright green. Relative strength in the airline industry

Official Trump will be listed on Coinbase soon!Official Trump will go crazy when it becomes fully available to Coinbase users. It seems to Still Be EARLY for a 10x or 100X. This will be a worldwide phenomenon. Looking for places to DCA against the 5 min 100 EMA. May see larger pullbacks to the 1hr 50 EMA as price rises.

Can DJT Trump Media & Technology Group Hit 171? Hey, trading family
DJT from Trump Media & Technology Group is hovering around $42 right now. If we can rally it up to $62.50 and break out of that triangle, we're in for an epic run. We're talking potential jumps to $106, then $142, and if the stars align, we could see $171! With all the buzz around the inauguration, this could be DJT's moment to shine.
If you're as excited about this potential breakout as I am, please give this post a boost, leave some love in the comments, or share it around! And if you want to chat more about this or need more trading insights, feel free to DM me or check out my profile for more.
Let's watch this one together and see if we can hit those numbers!
Kris/Mindbloome Exchange
Trade What You See

DJT TRUMP TIMEDJT broke out
buy at $40.00-$35.00
take profit1-$45.00
take profit 2-$50.00
take profit3-$55.00
take profit 4-$65.00

HUGE $1.69 to $9.50 vertical 462% by 10:15am $PHIO🚀 4 Buy Alerts sent out along the way up on NASDAQ:PHIO plus other stocks mentions which had solid moves

DJT: Will It Break $33.85 or $38.55 First? DJT is at a tipping point, and it could go either way. Here’s what to watch so you’re ready for the next big move.
1) If DJT Drops Below $33.85
If this level breaks, things could get rough. Here’s what might happen:
-$28–$26: This is the first stop where the price might chill for a bit.
-$10: If the selling gets heavy, this is where we could end up.
2) If DJT Pops Above $38.55
If the bulls take charge, it could be time to ride the wave higher:
A break above $38.55 could spark a nice rally and push the price upward.
What’s the Plan?
-Keep an eye on $33.85 and $38.55—they’re the magic numbers.
-Be patient and wait for a clear move before jumping in.
If this makes sense, toss me a like or follow. Got questions about DJT or another stock you’re stuck on? Hit me up in the DMs—I’m here to help.
And hey, if you’re feeling burned out or stressed about trading, let’s talk. I’m all about helping you find your balance and keeping things sustainable. Chill, stay focused, and let’s catch the next wave together!
Kris/ Mindbloome Exchange
Trade What You See

Trump Media & Technology Group (DJT): Big Moves Ahead?Good morning, trading family!
Trump Media & Technology Group (DJT) is at a critical juncture, and here’s what we’re watching:
If the price falls below $33.87: It could drop to $30-$28, with a chance of bouncing back to $59.57 afterward.
If the price breaks above $38.51: We could see momentum push it to $59 or higher.
If it fails to hold $28: Deeper declines may follow.
These levels are key, and how the price reacts will set the direction. Let’s stay sharp and trade smart!
Comment, like, follow, or send me a DM if you want more insights on this setup!
Kris/Mindbloome Exchange
Trade What You See

$DJT Analysis of the Chart: Trump Media & Technology Group CorpThis daily chart shows Trump Media & Technology Group Corp., currently trading at $34.71, slightly below the pivot level (P: $34.58) and experiencing a minor pullback. The white dashed lines represent dark pool levels, indicating significant institutional activity zones. The price is consolidating near critical levels, with a potential for either a bullish recovery or a bearish continuation, depending on upcoming price action.
Technical Analysis
Trend Analysis
Prior Trend:
The stock has exhibited a downtrend from August through mid-September, characterized by lower lows and lower highs.
A bullish reversal began in late September, leading to a strong rally into November, crossing major resistance levels and forming a clear uptrend.
Current Trend:
After hitting a peak at $53.99 (R3) in early November, the stock entered a correction phase.
The price has been consolidating near the $34.58 pivot level, testing the 8 EMA for support.
Key Levels
Resistance Levels:
R1 ($41.99): First key resistance and potential profit target for a bullish move.
R2 ($46.57): Secondary resistance where sellers might reappear.
R3 ($53.99): Major resistance, representing the upper boundary of the previous rally.
Support Levels:
S1 ($27.16): First critical support level below the current price, coinciding with prior consolidation.
S2 ($22.58): Secondary support level, marking the midpoint of the September rally.
S3 ($15.17): Significant long-term support, indicating the lower end of the bearish phase.
Dark Pool Levels:
The white dashed lines indicate dark pool trading activity, with notable levels at $34.58 (Pivot) and $30.28, both acting as significant support or resistance depending on price action.
Volume Analysis
Volume spiked during the rally in October and early November, signaling strong institutional participation.
Recent volume is declining, which is typical during consolidation, but a volume breakout would signal the next directional move.
Moving Averages (8 EMA and 21 EMA):
8 EMA (yellow line): The price is currently testing this short-term support level. Holding above this line would indicate potential bullish momentum.
21 EMA (blue line): Acts as medium-term support. A break below it would suggest bearish continuation.
Potential Scenarios
Bullish Case:
Key Factors:
The price holds above $34.58 (Pivot) and the 8 EMA, confirming strong buying interest.
A breakout above R1 ($41.99) would signal a resumption of the bullish trend.
Entry: Enter a long position above $35.00, confirming a bounce off the pivot or a breakout above the 8 EMA.
Profit Targets:
First Target: $41.99 (R1).
Second Target: $46.57 (R2).
Stretch Target: $53.99 (R3).
Stop Loss: Close below $32.75, as a break of this level invalidates the bullish setup.
Bearish Case:
Key Factors:
The price breaks below $34.58 (Pivot) and the 8 EMA, confirming selling pressure.
A breakdown below $32.75 would likely lead to further declines toward support levels.
Entry: Enter a short position below $32.75, confirming a breakdown.
Profit Targets:
First Target: $30.28 (Dark Pool Level).
Second Target: $27.16 (S1).
Stretch Target: $22.58 (S2).
Stop Loss: Close above $35.50, as it would invalidate the bearish setup.
Conclusion
The stock is currently at a critical juncture, consolidating near the $34.58 pivot level and the 8 EMA. A decisive move in either direction, accompanied by volume confirmation, will determine the next trend. Traders should watch for a breakout above $35.00 for a bullish setup or a breakdown below $32.75 for a bearish move. Clear profit targets and stop-loss levels are essential to managing risk in this trade.

DJT to $42NASDAQ:DJT looks like it is tying to make its way out of the lower Golden Zone. Assuming 34.75 holds this will retest 41.50-42 Area. Let's see what happens.

Bitcoin Swinging to 100K?Bitcoin (BTC) Swinging to $95k then $100k? With confirmed interest in crypto from the Trump Media (DJT). They are signaling that crypto will be the next hot thing. We are at all time high for crypto Market Cap at $3 Trillion. More money will pour in if banks and the US become more Crypto-friendly!

BAKKT gets the Trump PumpCrypto custody, trading, and on ramp solutions provider BAKKT just got a pump i price that sent it above the double bottom enckline thanks to Donald trump’s media company suggesting they want to acquire the platform. Bodes well for price flipping this neckline to support and valdating the double bottom breakout in the near future. *not financial advice*

DJT at a Crossroads: Bullish Momentum or Potential Pullback?The DJT stock is showing signs of a potential trend reversal after a prolonged downtrend. For an extended period, the stock moved in a clear downward trajectory, forming lower highs and lower lows. Recently, however, a significant breakout above the downward trendline has occurred, accompanied by a noticeable increase in trading volume, signaling renewed buying interest.
The price has established a strong support zone between 28.50 and 30.00, where it has shown stability and a sharp rebound. This zone highlights a key area of buyer activity, making it a crucial level to watch. On the upside, the levels of 66.42, 70, and 92.50 represent important resistance zones. The first at 66.42 may act as a near-term barrier, while 70 is a natural psychological resistance level and the next logical target. Finally, 92.50 serves as a long-term target if bullish momentum persists.
Recent price action also reflects strategic liquidity plays. Liquidity was swept from the lows below 30.00, likely allowing for significant accumulation by institutional buyers. The subsequent price recovery above this level reinforces the potential for a sustained upward movement. Breaking and holding above 66.42 will confirm strength in the upward trend, potentially paving the way toward 70, and eventually 92.50, a key historical level.
Additionally, moving averages are aligning toward a bullish crossover, further supporting the outlook for continued upward momentum. The recent increase in trading activity at current levels underscores growing market interest and confidence in the stock.
Looking ahead, if the price remains above the 28.50–30.00 support zone , the next targets are 66.42, followed by 70, and finally 92.50 as the primary resistance levels. However, caution is warranted in the event of a break below 28.50, as this could lead to further downside toward 13.01.
In conclusion, the stock is at a critical juncture. Monitoring price action and volume near key levels will be essential to confirm the next direction. Risk management remains paramount, especially when navigating strong support and resistance areas.

Money over Politics - Trump Media(DJT) to buy Bakkt(BKKT)?Money over politics - Donald Trump Media( NASDAQ:DJT ) in talks to buy crypto company Bakkt ( NYSE:BKKT ). Follow the money. I am thinking that this is a very bullish sign if the government starts to change regulation around bitcoin and other crypto. It will be in the president's personal interest to make the US more crypto-friendly. If this acquisition goes through then Bitcoin to the moon!

Is the Trump Trade Fading? The sugar high from Trump’s victory may be wearing off in a few areas.
Tesla, once a post-election favorite after Elon Musk’s support of Trump’s campaign, has now reversed direction. Reports suggest that Republicans will end the $7,500 EV tax credit—a move that’s sent Rivian tumbling 9%, while Tesla is down nearly 4%.
Shares of Trump Media & Technology slid 8% today. But being a meme stock, analysis here won't tell us much. In a notable signal, the CFO and two other insiders sold over $16 million of stock in the week following the election.
Yet, the U.S. dollar remains resilient, possibly buoyed by the Cabinet picks coming out of the Trump administration. Marco Rubio’s nomination as Secretary of State suggests a tough stance on China. Known for his anti-communist positions and support for Hong Kong’s democracy movement, Rubio has advocated for tighter export controls on U.S. technology and visa sanctions against Chinese officials, hinting at a policy that may go well beyond tariffs.

DJT a winner in life. A winner in the market? Hello Traders,
Quite obvious large wedge pattern emerging here, with price action sitting on a solid support. If it breaks support below shown on the chart, we will more likely than not, come down between $10 & $11. This would have course be our best entry point. Could it happen? OF COURSE, this is why we do TA! It is to assure we have a plan for all possibilities and minimize risk along the way!
That being said, where price action is currently, we could very likely start next week with a green candle and continue it through mid week and if so my plan is to start buying some contracts If the week closes green. Possibly a few if we get two green closes M & T. it’s very likely to break out in the next month or two. Maybe within another 1-2 weeks. If we see a solid green candle close next week.
In addition, look at that massive sell volume that couldn’t even break support. My money is on the bounce and then breakout here where we stand! Best of luck and always follow the path of less resistance and have a plan for a diverging outcome! This is law if you want to be consistently profitable!
Stay Profitable,
Savvys

Trump wins? $DJT to fall into election, then rally after?I've been watching the DJT chart for a while now. I originally took a trade at $17 with intention to hold, but got scared out of the position on the loss of $16. It ended up bottoming at $13. Since then, it's gone 3x with people anticipating a Trump win.
We've corrected in the last few days and the chart looks like it wants to see more downside into the $27-20 levels. That's where I'll start scaling into positions in both spot and calls.
To me, that looks like a great buying opportunity. On higher timeframes, it looks like the stock is getting ready for a large move above $100 post election.
Let's see how it plays out over the next week.
